
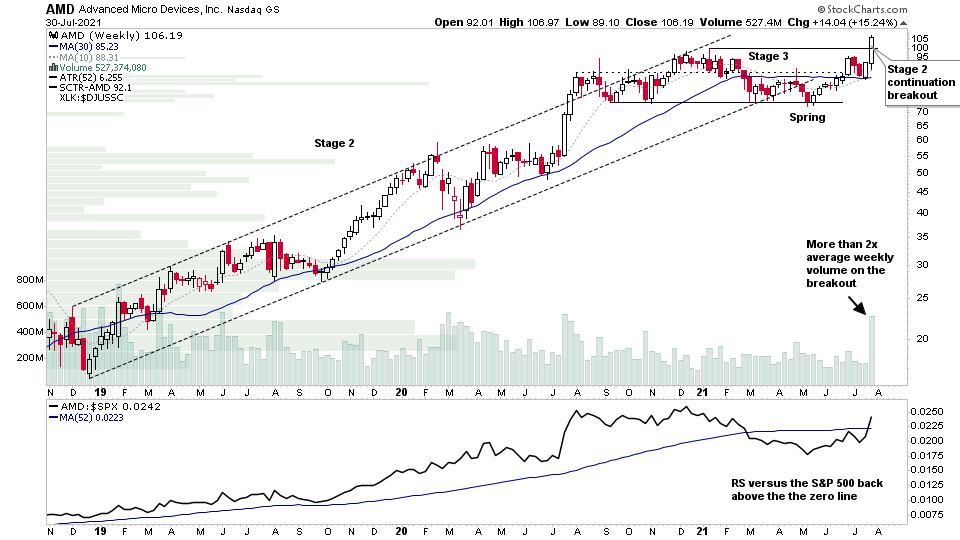
$AMD - Weekly Stage 2 Breakout
$AMD completed a new Stage 2 breakout this week to new highs with the methods key criteria:
- Volume at least 2x the weekly average
- RS vs S&P 500 above a flat or rising "Zero Line" (52 week RS MA)
- No near term resistance
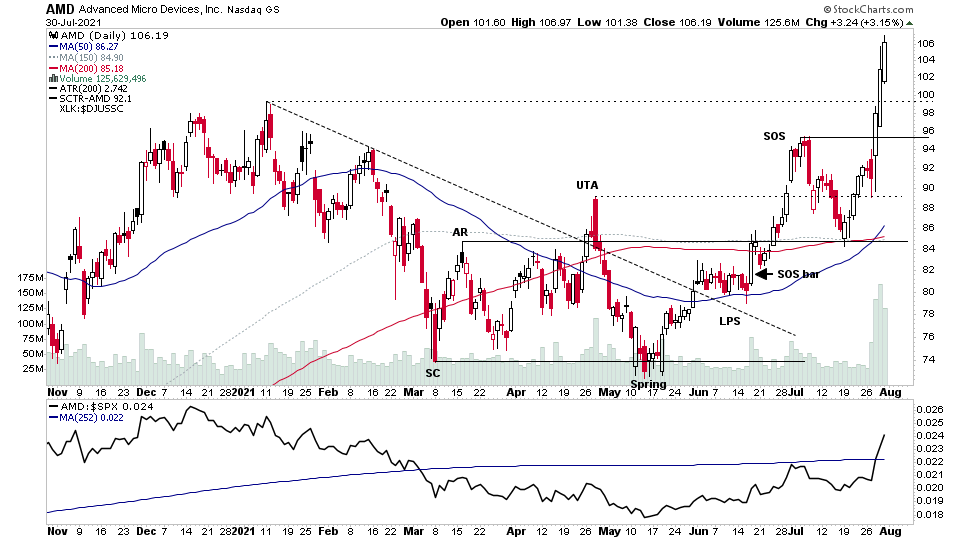
I've posted about it numerous times of late as it made a spring in May and had a potential sign of strength rally, which imo reverted it back to Stage 1. It then backed up to support at the top of the trading range and rallied strongly into and following its earnings to make the Stage 2 breakout this week to new highs.
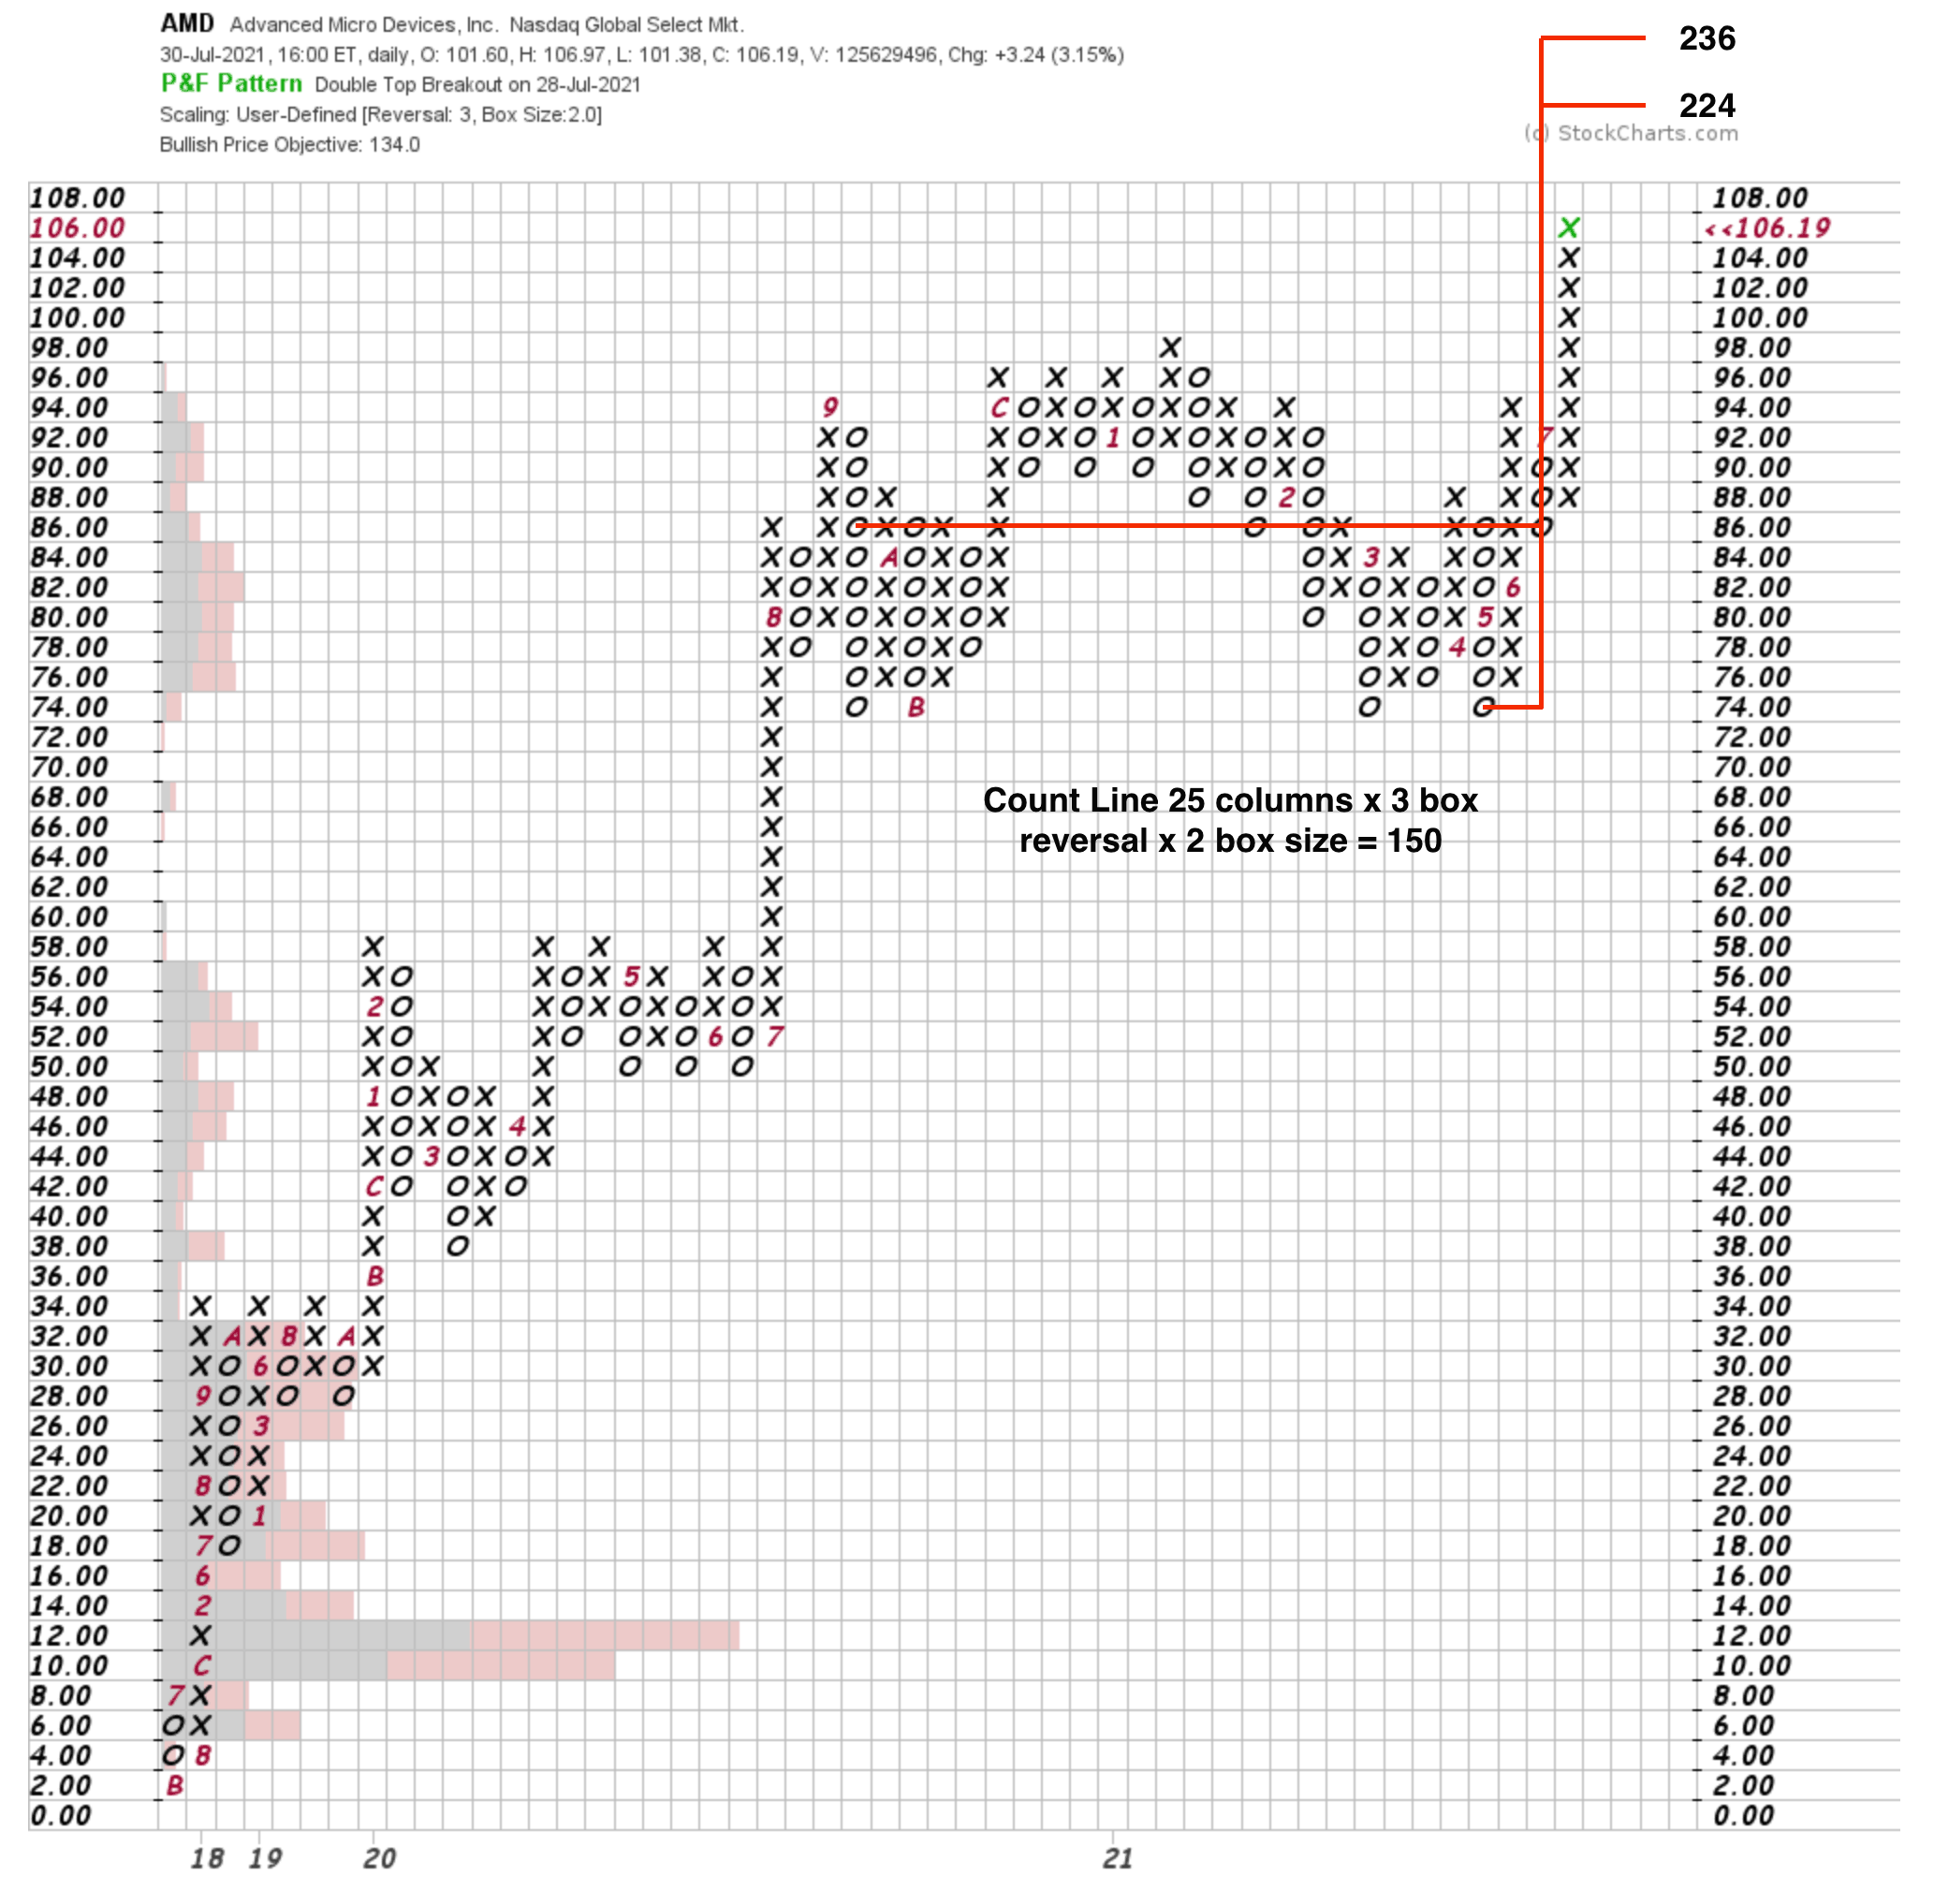
Point & Figure Horizontal Price Target (Wyckoff method)
It's built a big cause over the last year, so using the Wyckoff method you can now project a target range using the P&F horizontal count method.
With a box size of 2, on a 3 box reversal chart it give a count line of 25 columns. Hence 25 x 3 x 2 = 150
The LPS is at 86 and the low the base is at 74, therefore:
74 + 150 = 224
86 + 150 = 236
Average target of 230
230 is 117% above the current price. So the cause is strong*
*With investor method entries I aim for a cause above 100%, as the stop loss will be larger to begin with.
So with a big cause and A+ price / volume and RS characteristics. The next potential Stage Analysis entry point would be on a backup to towards the breakout level around the key Livermore 100 level imo. So will be watching how it reacts in the coming weeks.
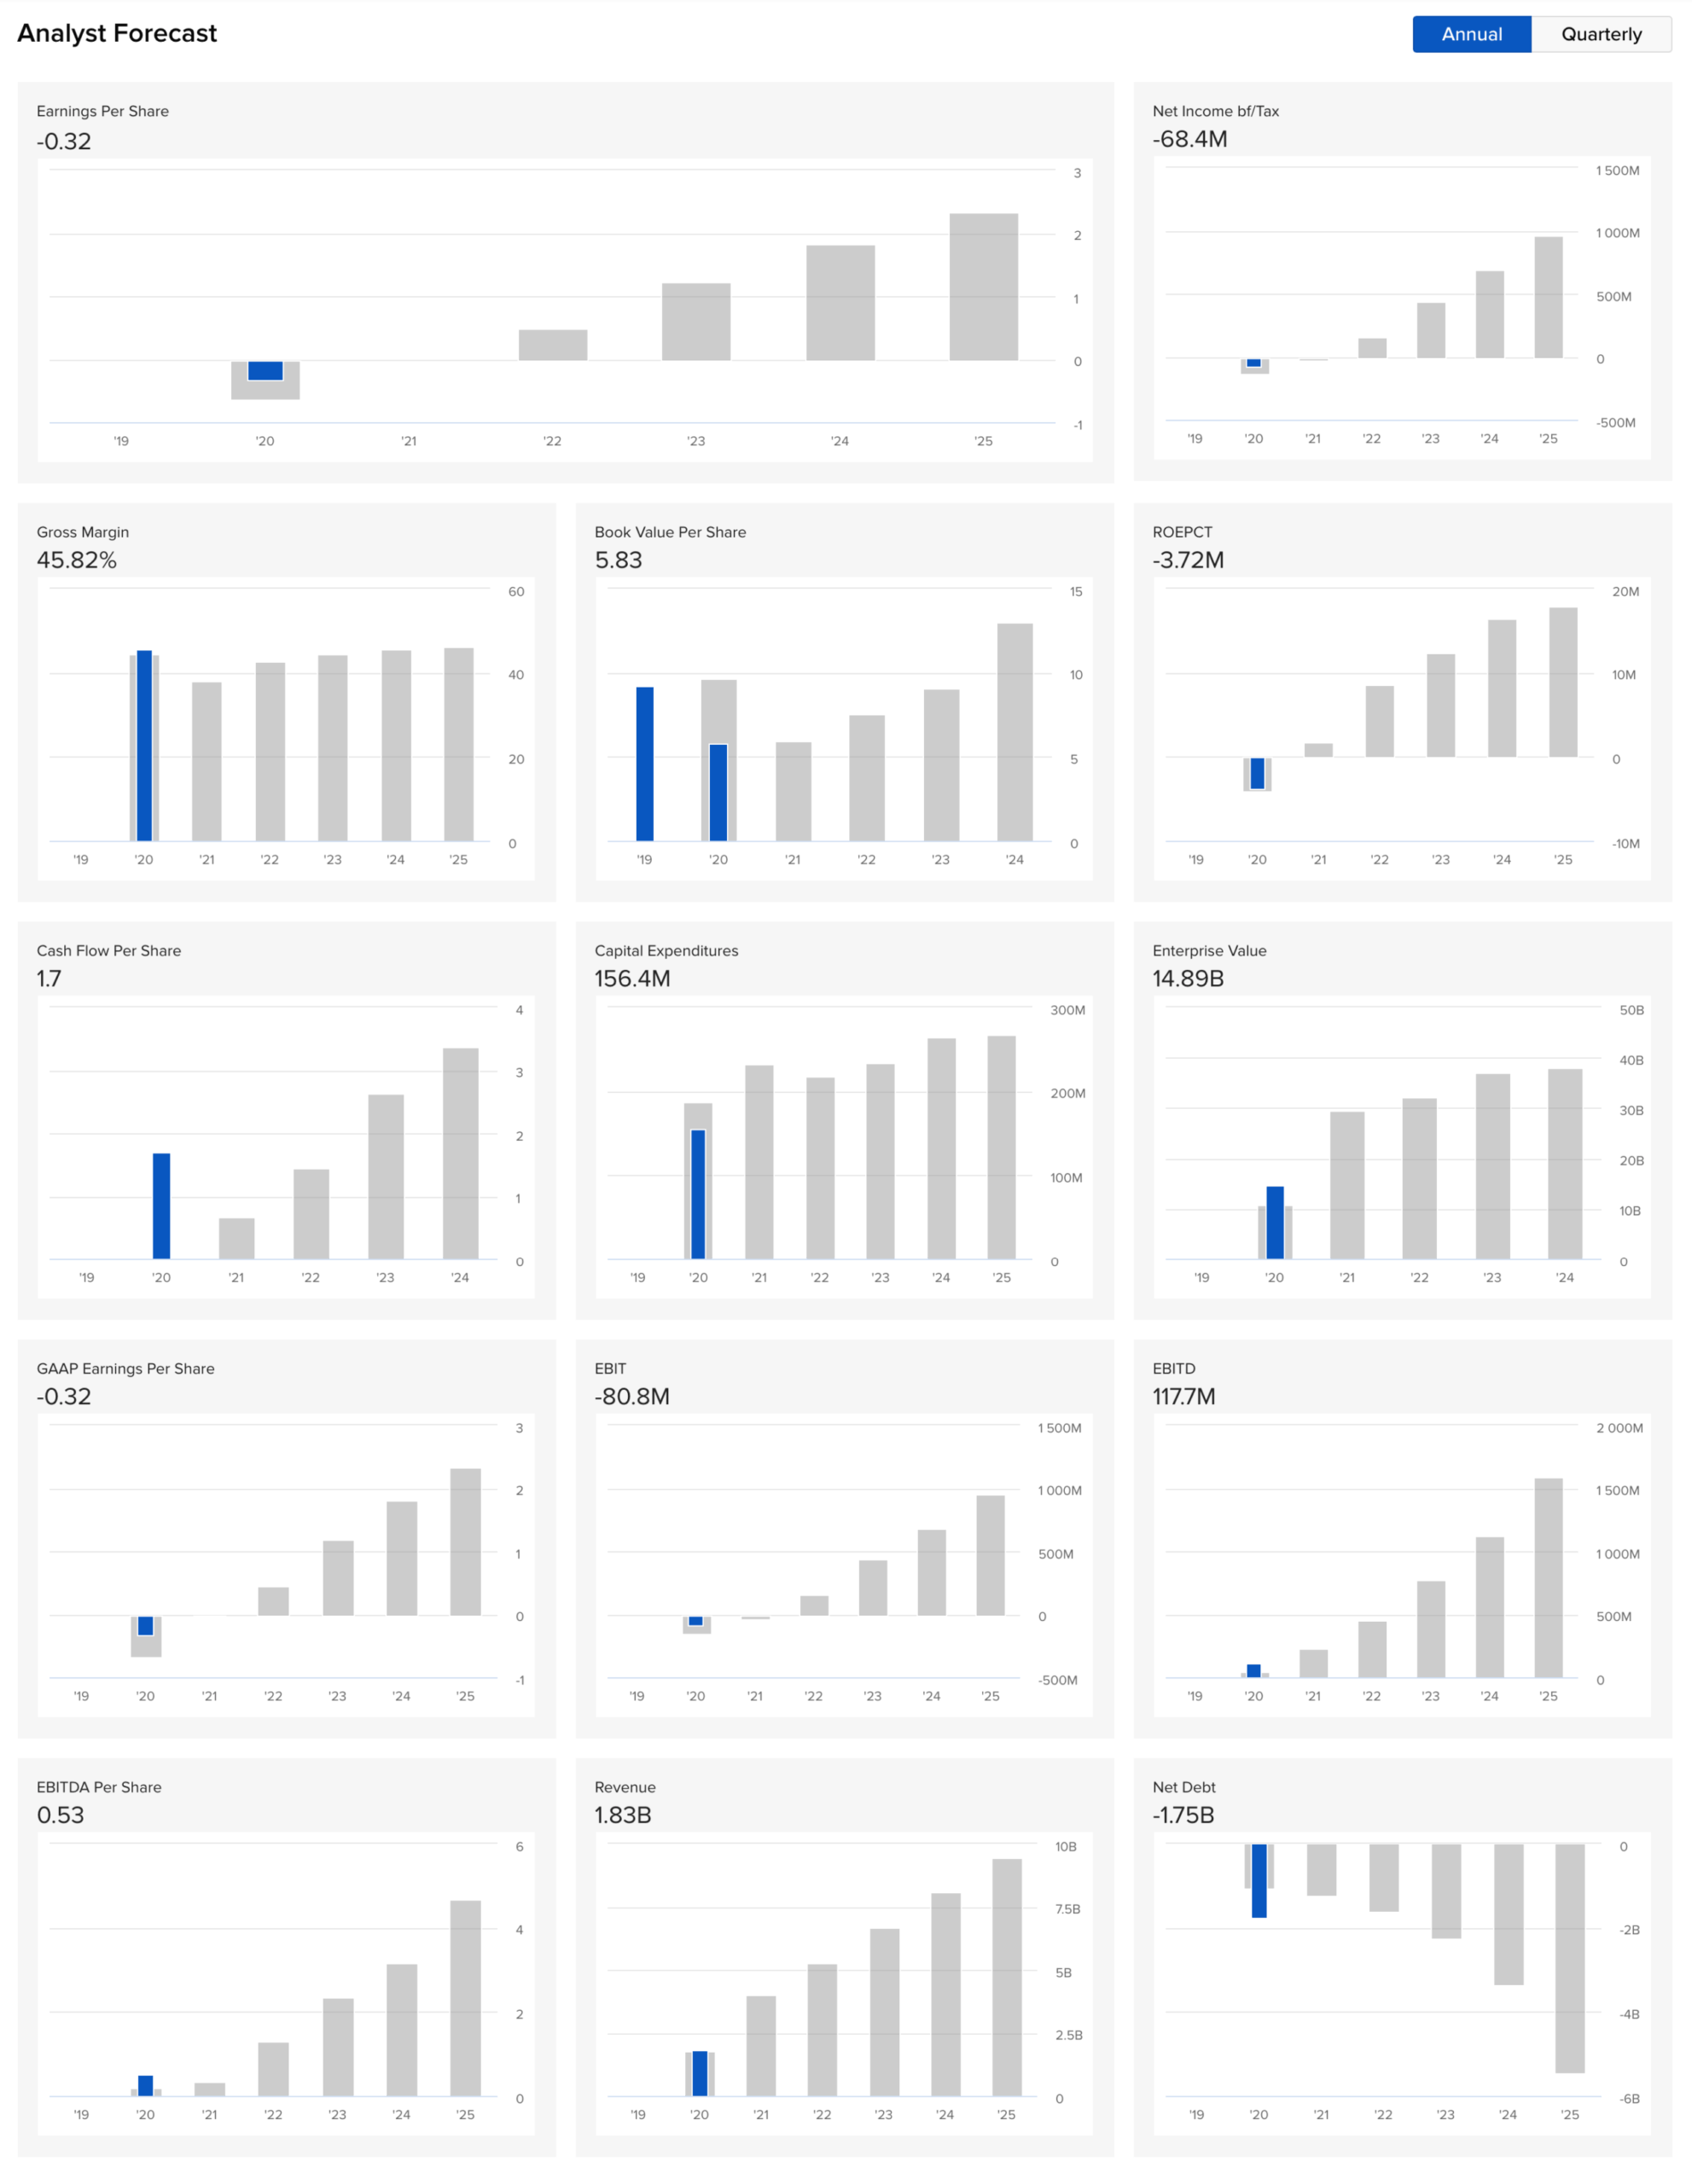
Annual fundamentals + future estimates
Want to learn more? Join Today.
Become a member of Stage Analysis to learn more about the Stage Analysis method and to see our regular posts and videos on US stocks and crypto.
Join today at https://www.getrevue.co/profile/stageanalysis/members
Disclaimer: For educational purpose only. Not investment advice. Seek professional advice from a financial advisor before making any investing decisions.