
Market Breadth: Percentage of Stocks Above their 50 Day, 150 Day & 200 Day Moving Averages Combined
The full post is available to view by members only. For immediate access:
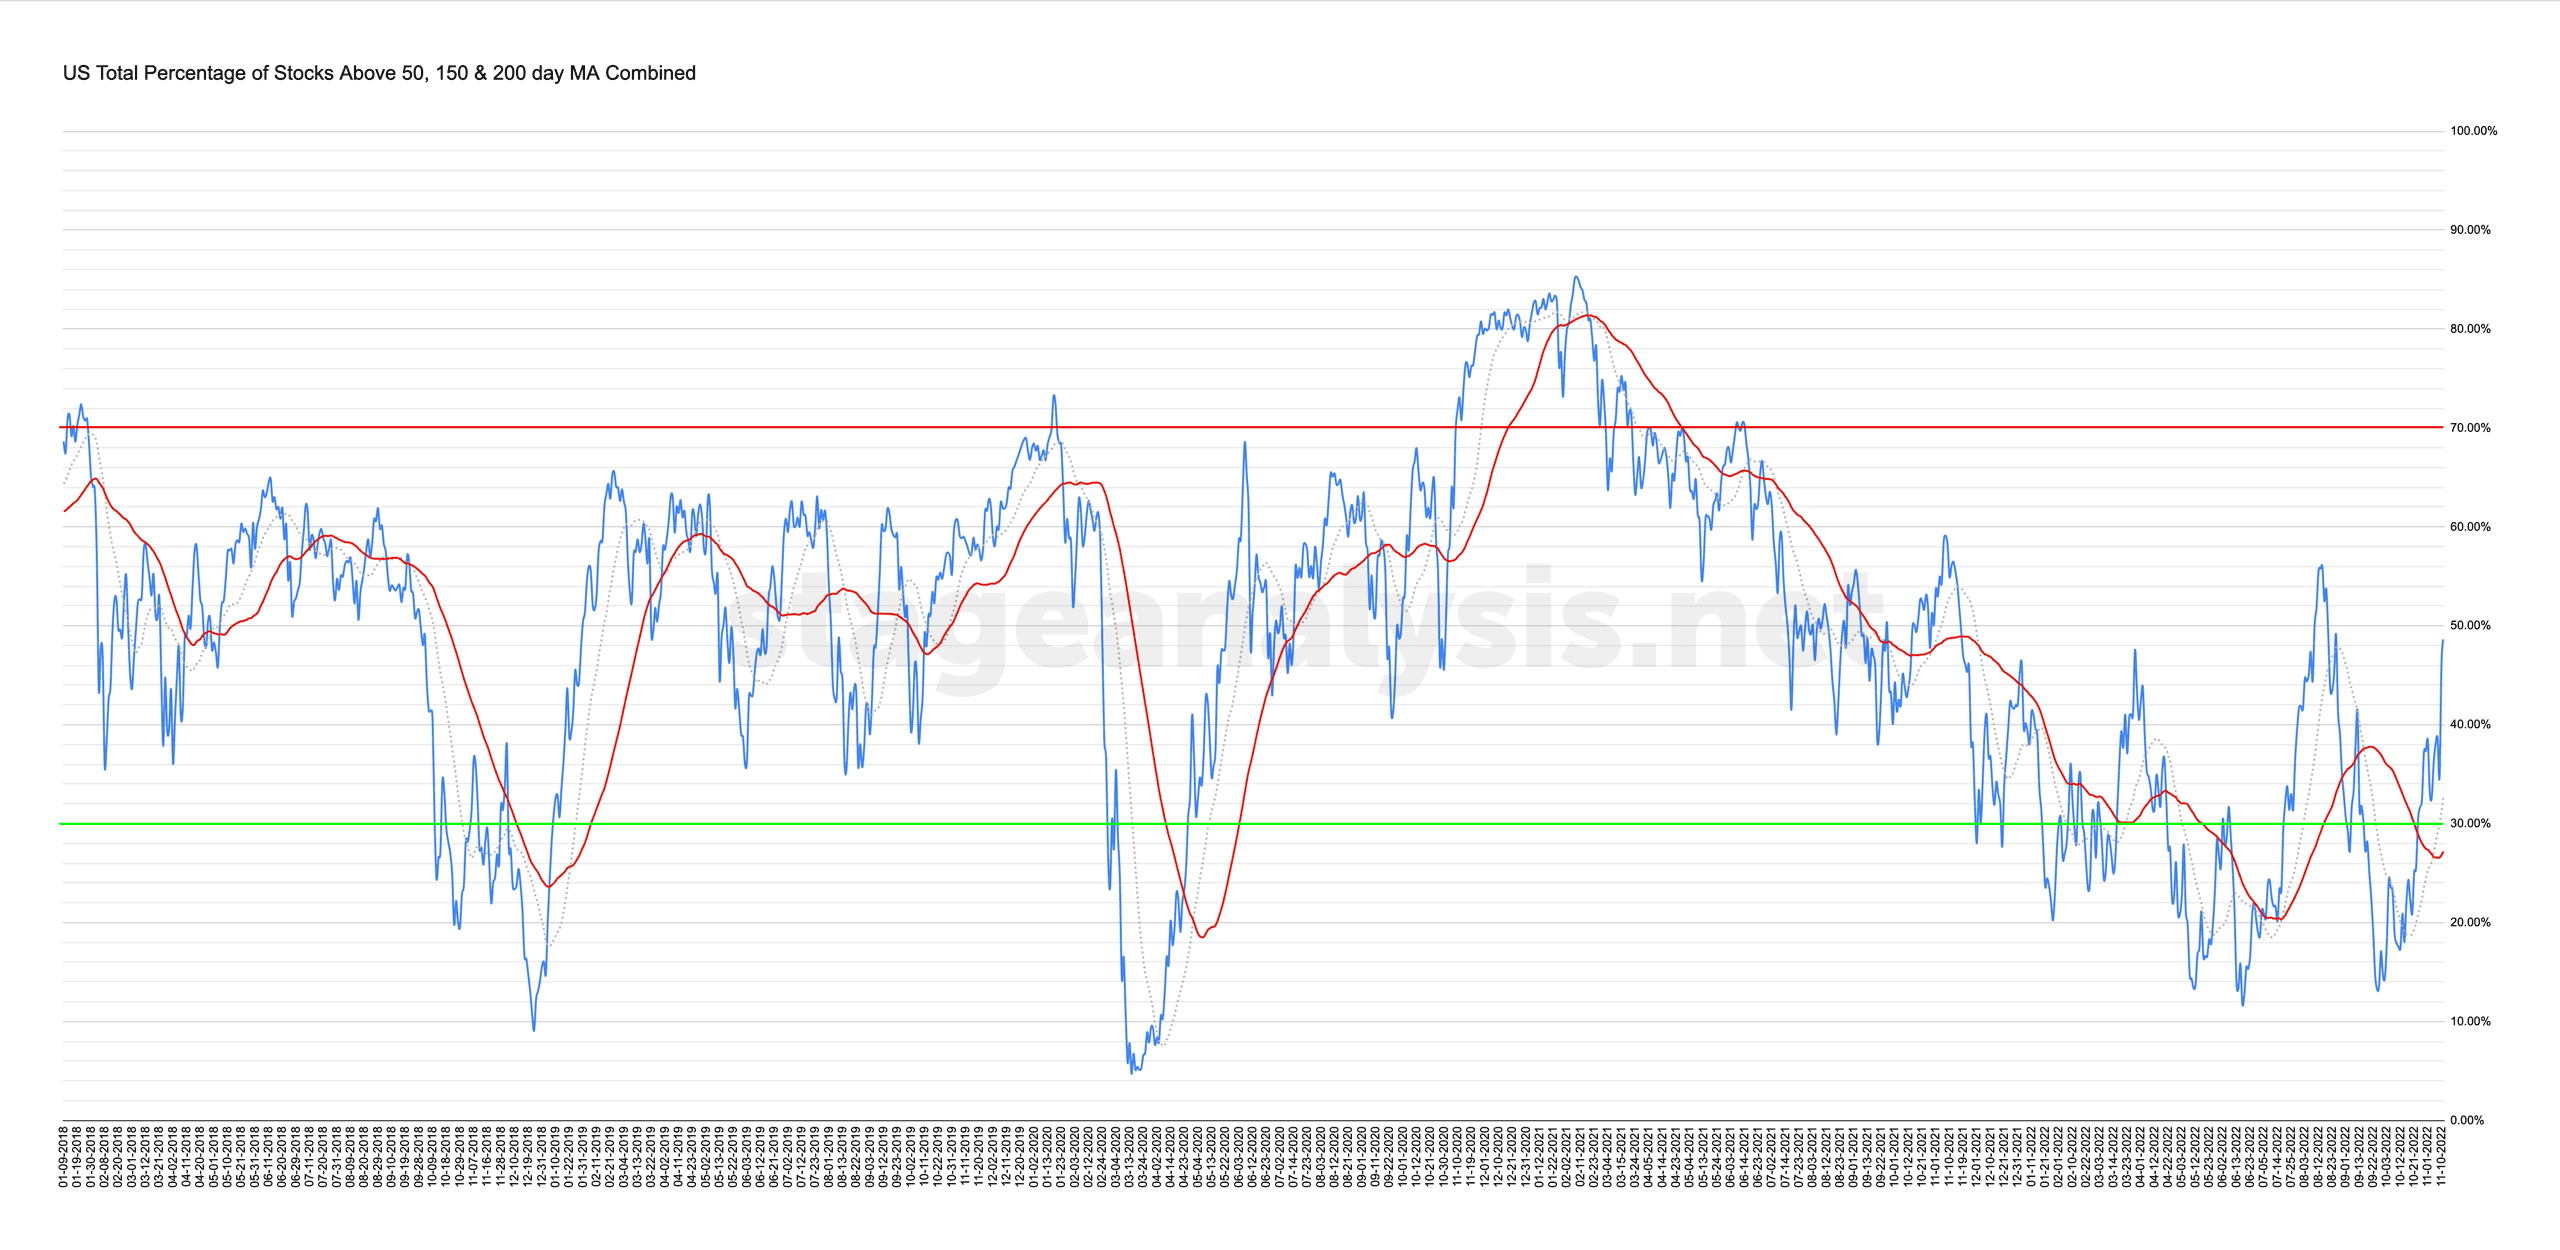
48.63% (+12.46% 1wk)
Status: Positive Environment in the Stage 1 zone
The US Total Percentage of Stocks above their 50 Day, 150 Day & 200 Day Moving Averages (shown above) surged higher over the week by +12.46% to close the week at 48.63%, which is the highest level that it's seen since the August highs and higher than the March and January peaks.
Therefore the status has been upgraded to Positive Environment in the Stage 1 zone, as it has moved above the 40% level and into the Stage 1 zone in the middle of the range. Also the Tentative part of the status has also been removed that it had for the prior two weeks, as it's made a higher high and is now reasonably extended from the 50 day MA – which is used as the signal line for the statuses.
To move back to a Stage 2 environment, we'd need to see the total percentage of stocks continue to expand and move above the 60% level – which it last moved below in July 2021, when a huge amount of stocks had already started to display Stage 3 characteristics (see the Russell 2000 and NYSE charts from that time).
So currently we are seeing a continued expansion in the moving average breadth that has moved it back into the Stage 1 zone.

The Point and Figure chart (shown above) added a further 5 Xs to the column during the week and so the P&F strategy remains on Offense and on Bull Confirmed status, and has now been on a bullish status since the 18th October when reversed up to Bull Alert status.
Become a Stage Analysis Member:
To see more like this – US Stocks watchlist posts, detailed videos each weekend, use our unique Stage Analysis tools, such as the US Stocks & ETFs Screener, Charts, Market Breadth, Group Relative Strength and more...
Join Today
Disclaimer: For educational purpose only. Not investment advice. Seek professional advice from a financial advisor before making any investing decisions.