
Market Breadth: Percentage of Stocks Above their 50 Day, 150 Day & 200 Day Moving Averages Combined
The full post is available to view by members only. For immediate access:
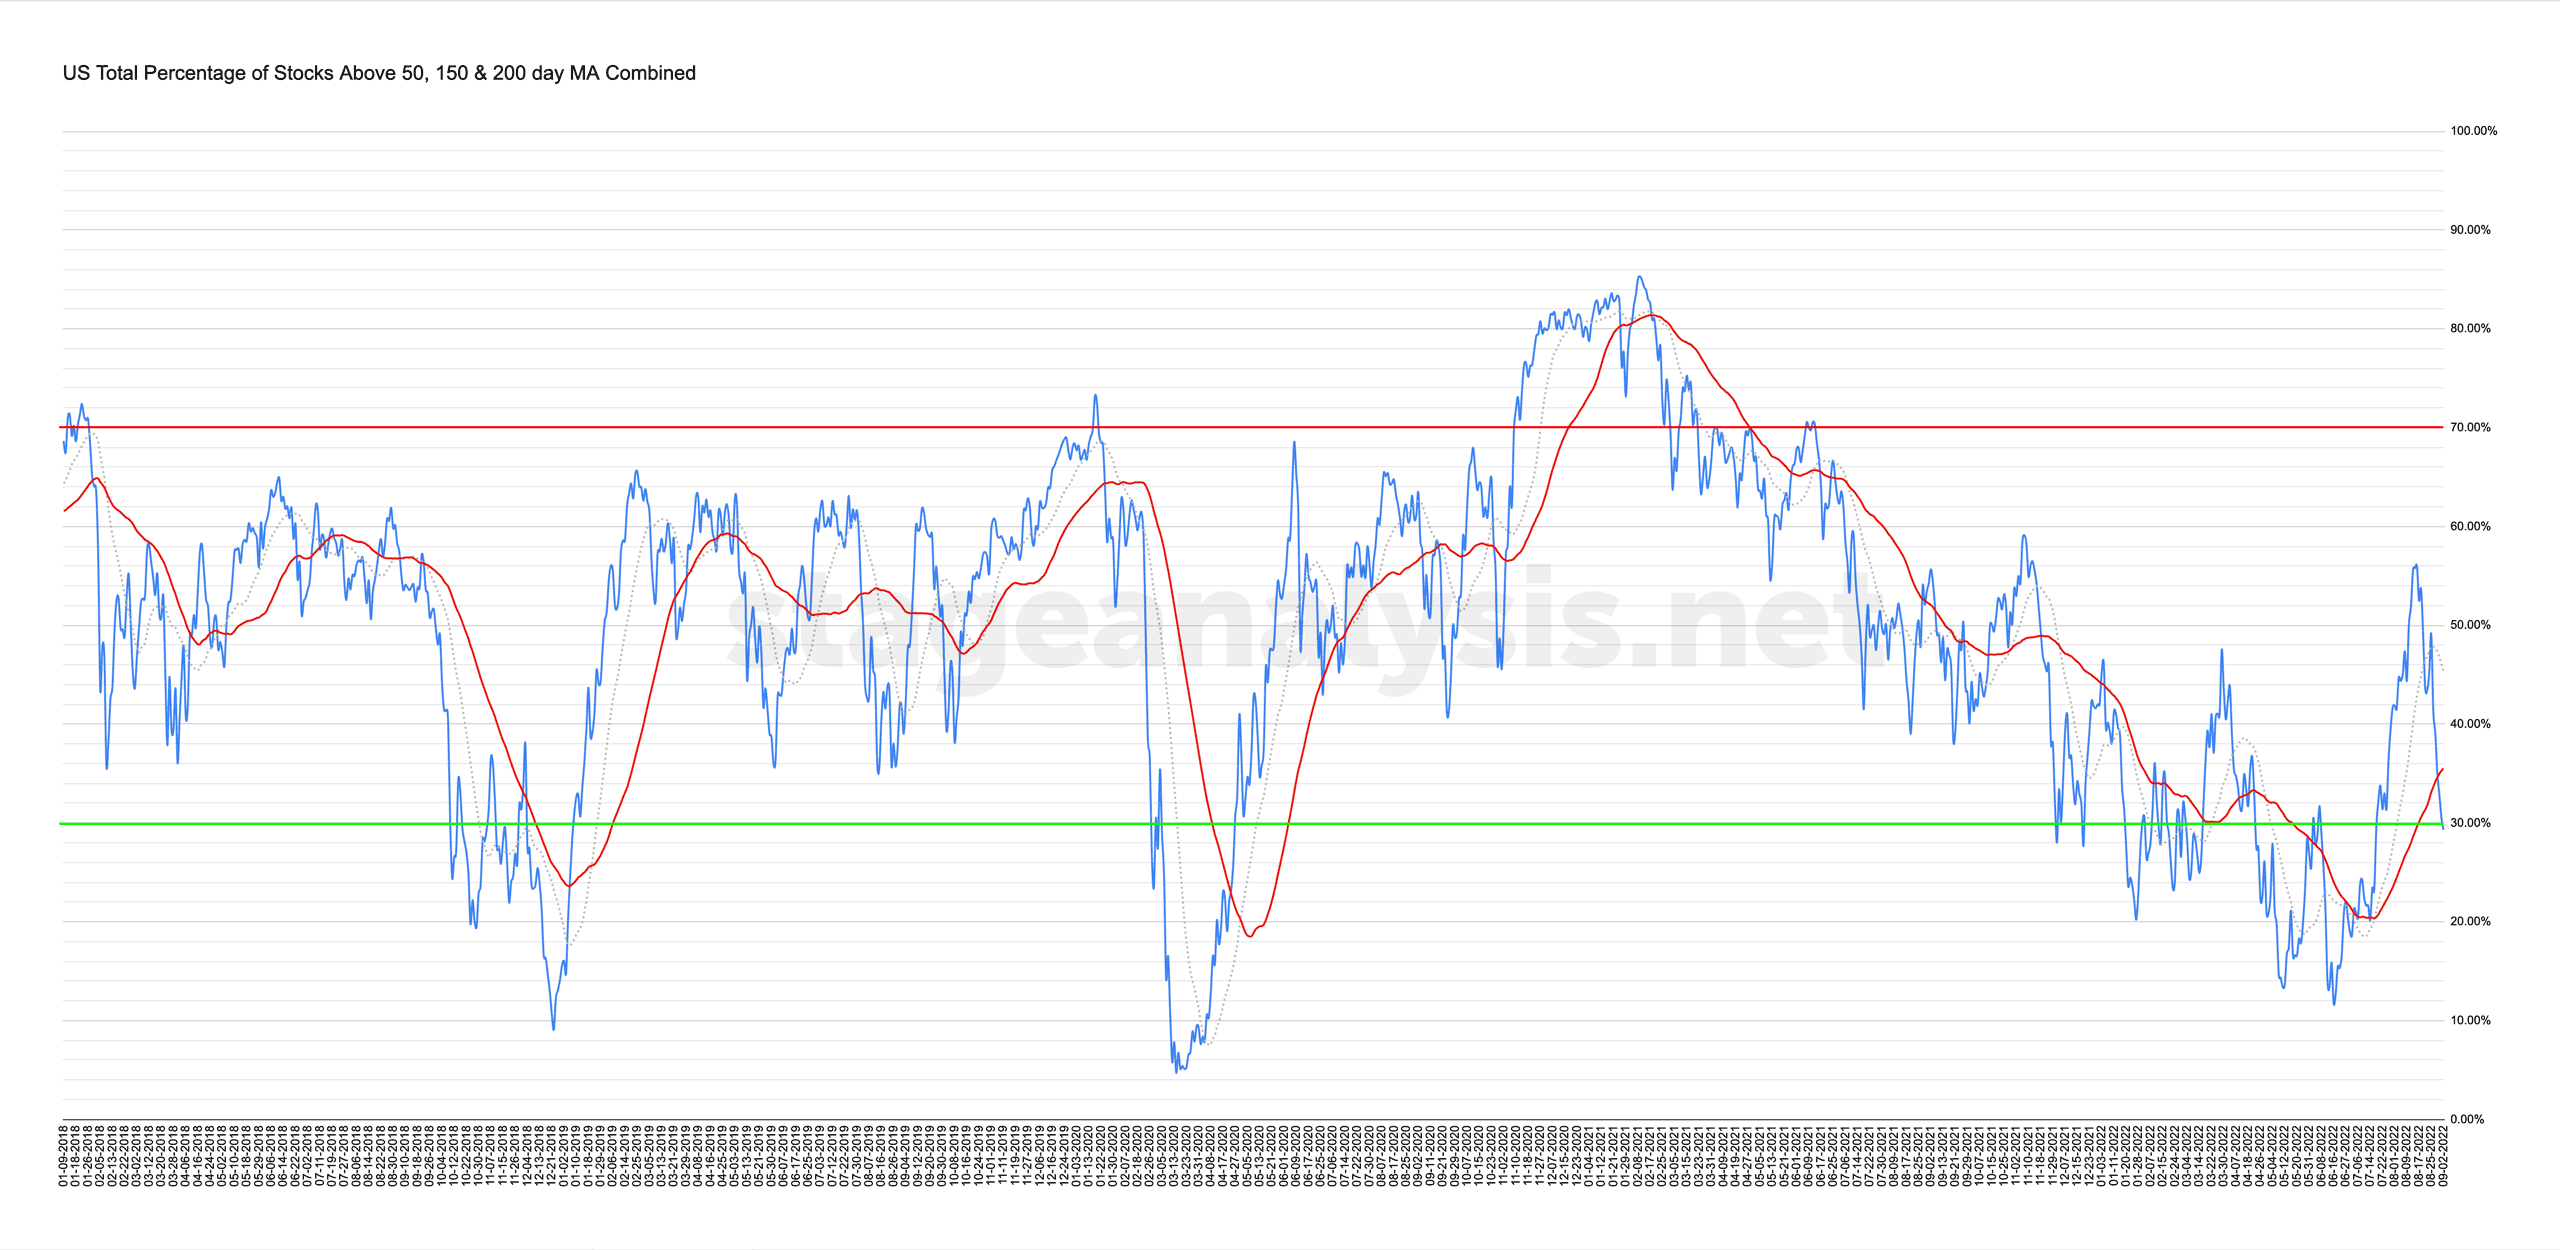
29.31% (-12.05% 1wk)
Status: Difficult Environment in the Stage 4 zone
The US Total Percentage of Stocks above their 50 Day, 150 Day & 200 Day Moving Averages continued lower for a third week, dropping a further -12.05%, to close the week at 29.31%, and back in the lower zone. So it was a very large decline in the moving average breadth, and in doing so it has now re-entered Stage 4 territory (below 40%) by this measure only and the status has weakened to Difficult Environment.
I will talk more about this and all of the other combined moving average breadth charts from the full members post in detail during the Stage Analysis Members weekend video – which is scheduled for later on Sunday afternoon EST.
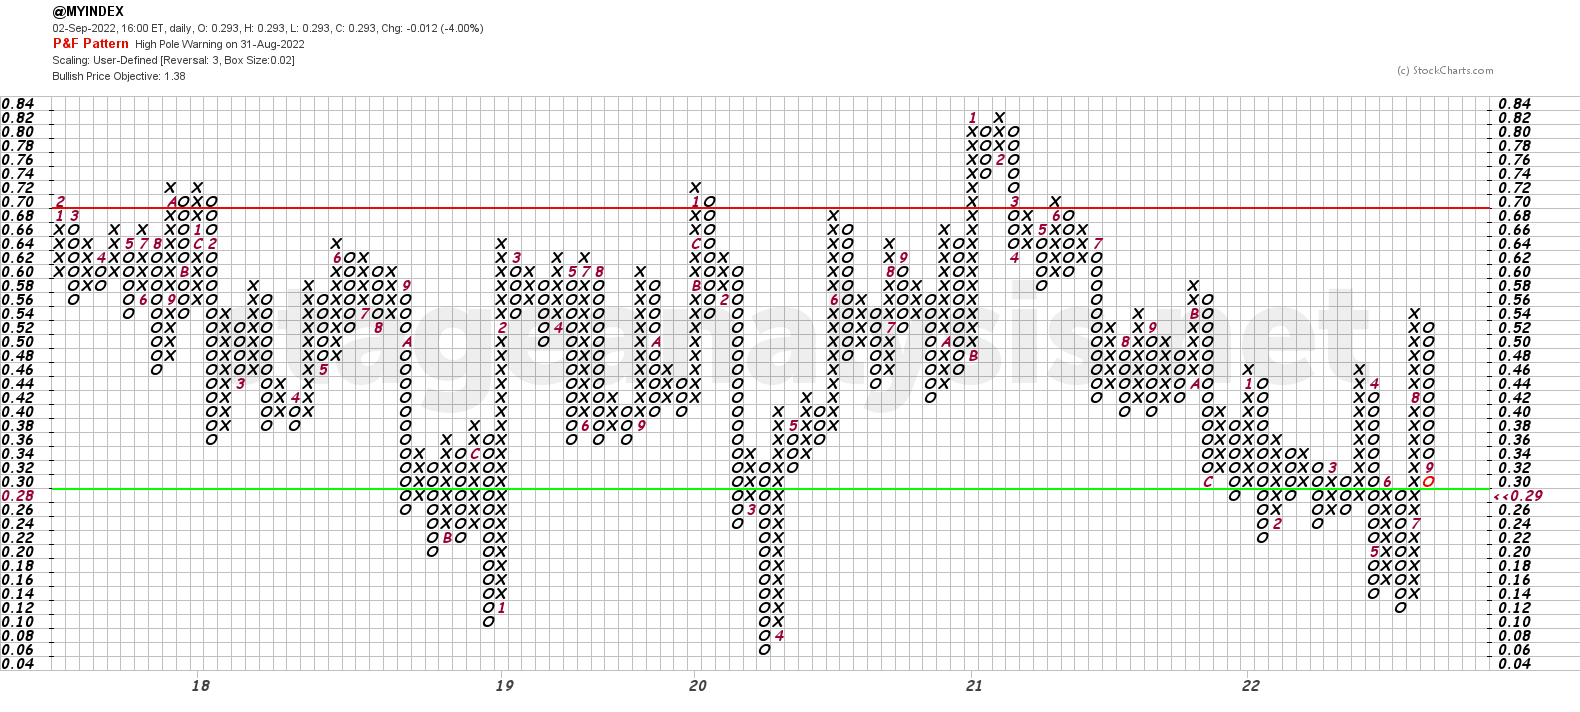
The Point & Figure chart dropped a further 6 boxes, causing a high pole warning, as it's reversed more than 50% of the previous column of Xs. However, it hasn't switched columns, and so the P&F status remains on Bull Correction and the strategy on Defense.
Become a Stage Analysis Member:
To see more like this – US Stocks watchlist posts, detailed videos each weekend, use our unique Stage Analysis tools, such as the US Stocks & ETFs Screener, Charts, Market Breadth, Group Relative Strength and more...
Join Today
Disclaimer: For educational purpose only. Not investment advice. Seek professional advice from a financial advisor before making any investing decisions.