
Market Breadth: Percentage of Stocks Above their 50 Day, 150 Day & 200 Day Moving Averages Combined
The full post is available to view by members only. For immediate access:
45.01% (+3.36% 1wk)
Status: Positive Environment in the Stage 1 zone
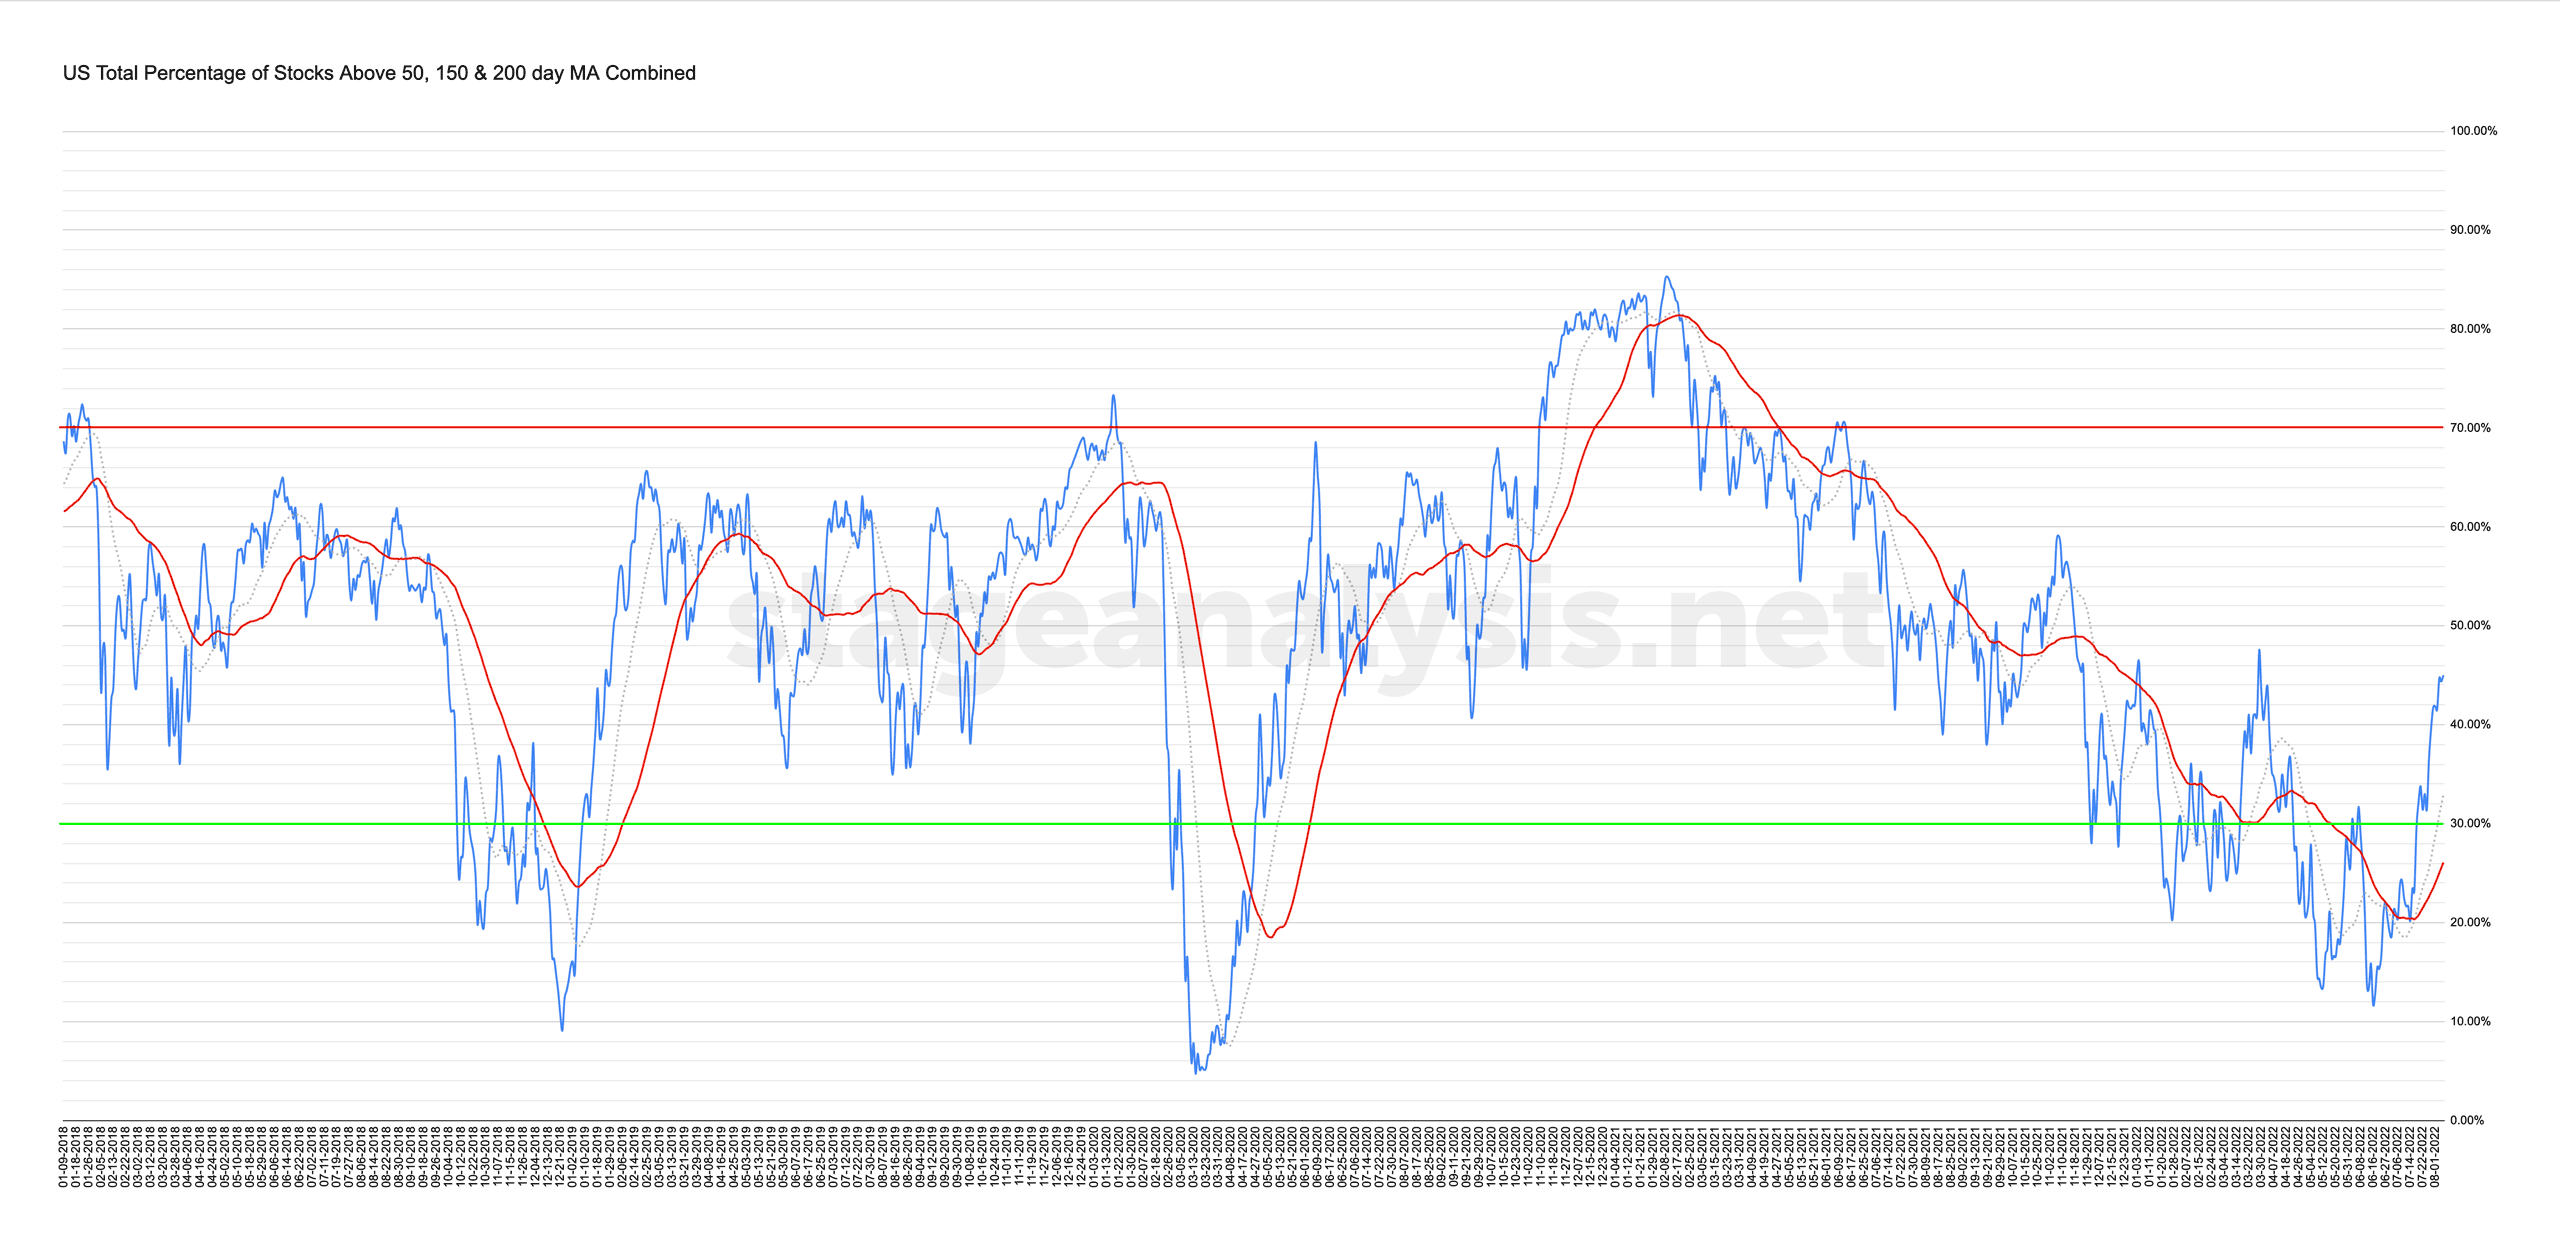
The US Total Percentage of Stocks Above their 50 Day, 150 Day & 200 Day Moving Averages continued the short-term expansion in breadth since the June 16th low at 11.65%, and moved higher to close the week at 45.01%. Which is a gain of +3.36%, and moves the average further into the Stage 1 zone (between the 40% to 60% range), after spending 90% of the year to date in the Stage 4 zone (below 40%).
However, the run up has been sharp and as I said in last weekends post, it's still very much at the lower end of that range and so although it may be attempting to transition to Stage 1, it will need much more confirmation still. But it continues to make progress and is now at the highest level that it's been above its own 50 day MA so far this year (+18.93% above the 50 day MA). But it's approaching the 4th January (46.17%) and 29th March (47.56%) prior 2022 breadth swing highs. So they are levels of interest in the near term to see if they can be overcome or not.
The short-term counter-trend rally continues to show an expansion in breadth, and is now a clear change of character compared to the prior rally attempts of this current year (i.e. March 2022). But to get more bullish it would need to show even more strength in the near-term, as the prior two Stage 4 bear markets ended with an expansion in the distance above its own 50 day MA to around the 30% above the 50 day MA level. So the combined average would need to push a further +11% above its own 50 day MA from here to match those periods from January 2019 and April/May 2020.
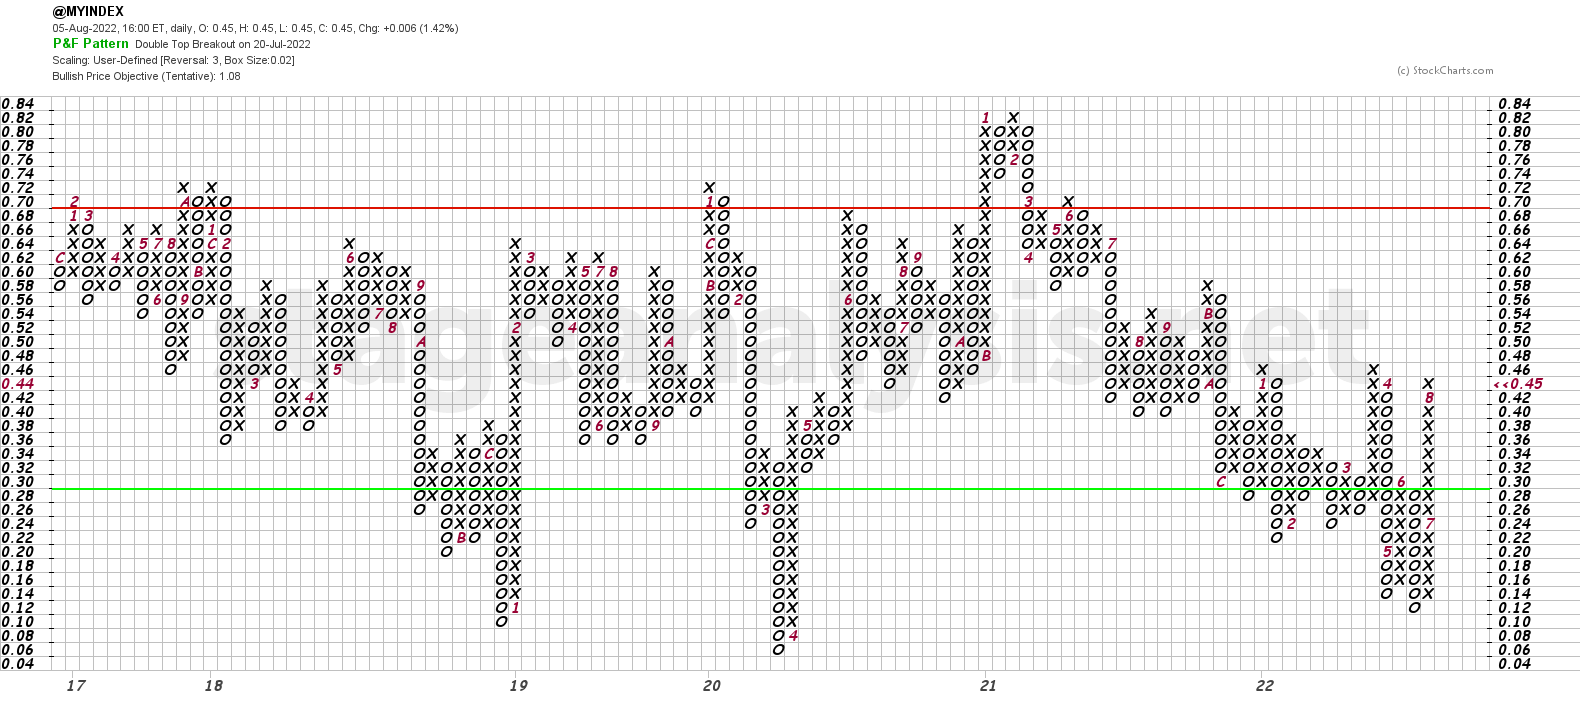
The Point & Figure chart added a further 2 Xs to its current column, and so remains on Bull Confirmed status for a third week, after moving to Bull Alert status all the way back on June 24th. So it's been a Bullish status for 6 weeks and is now within 1 box of the prior two swing highs from the earlier in the year.
I'll discuss all of the combined moving average breadth charts from the full post in detail during the Stage Analysis Members weekend video – which is scheduled for later on Sunday afternoon EST.
Become a Stage Analysis Member:
To see more like this – US Stocks watchlist posts, detailed videos each weekend, use our unique Stage Analysis tools, such as the US Stocks & ETFs Screener, Charts, Market Breadth, Group Relative Strength and more...
Join Today
Disclaimer: For educational purpose only. Not investment advice. Seek professional advice from a financial advisor before making any investing decisions.