
US Stocks Industry Groups Relative Strength Rankings
The full post is available to view by members only. For immediate access:
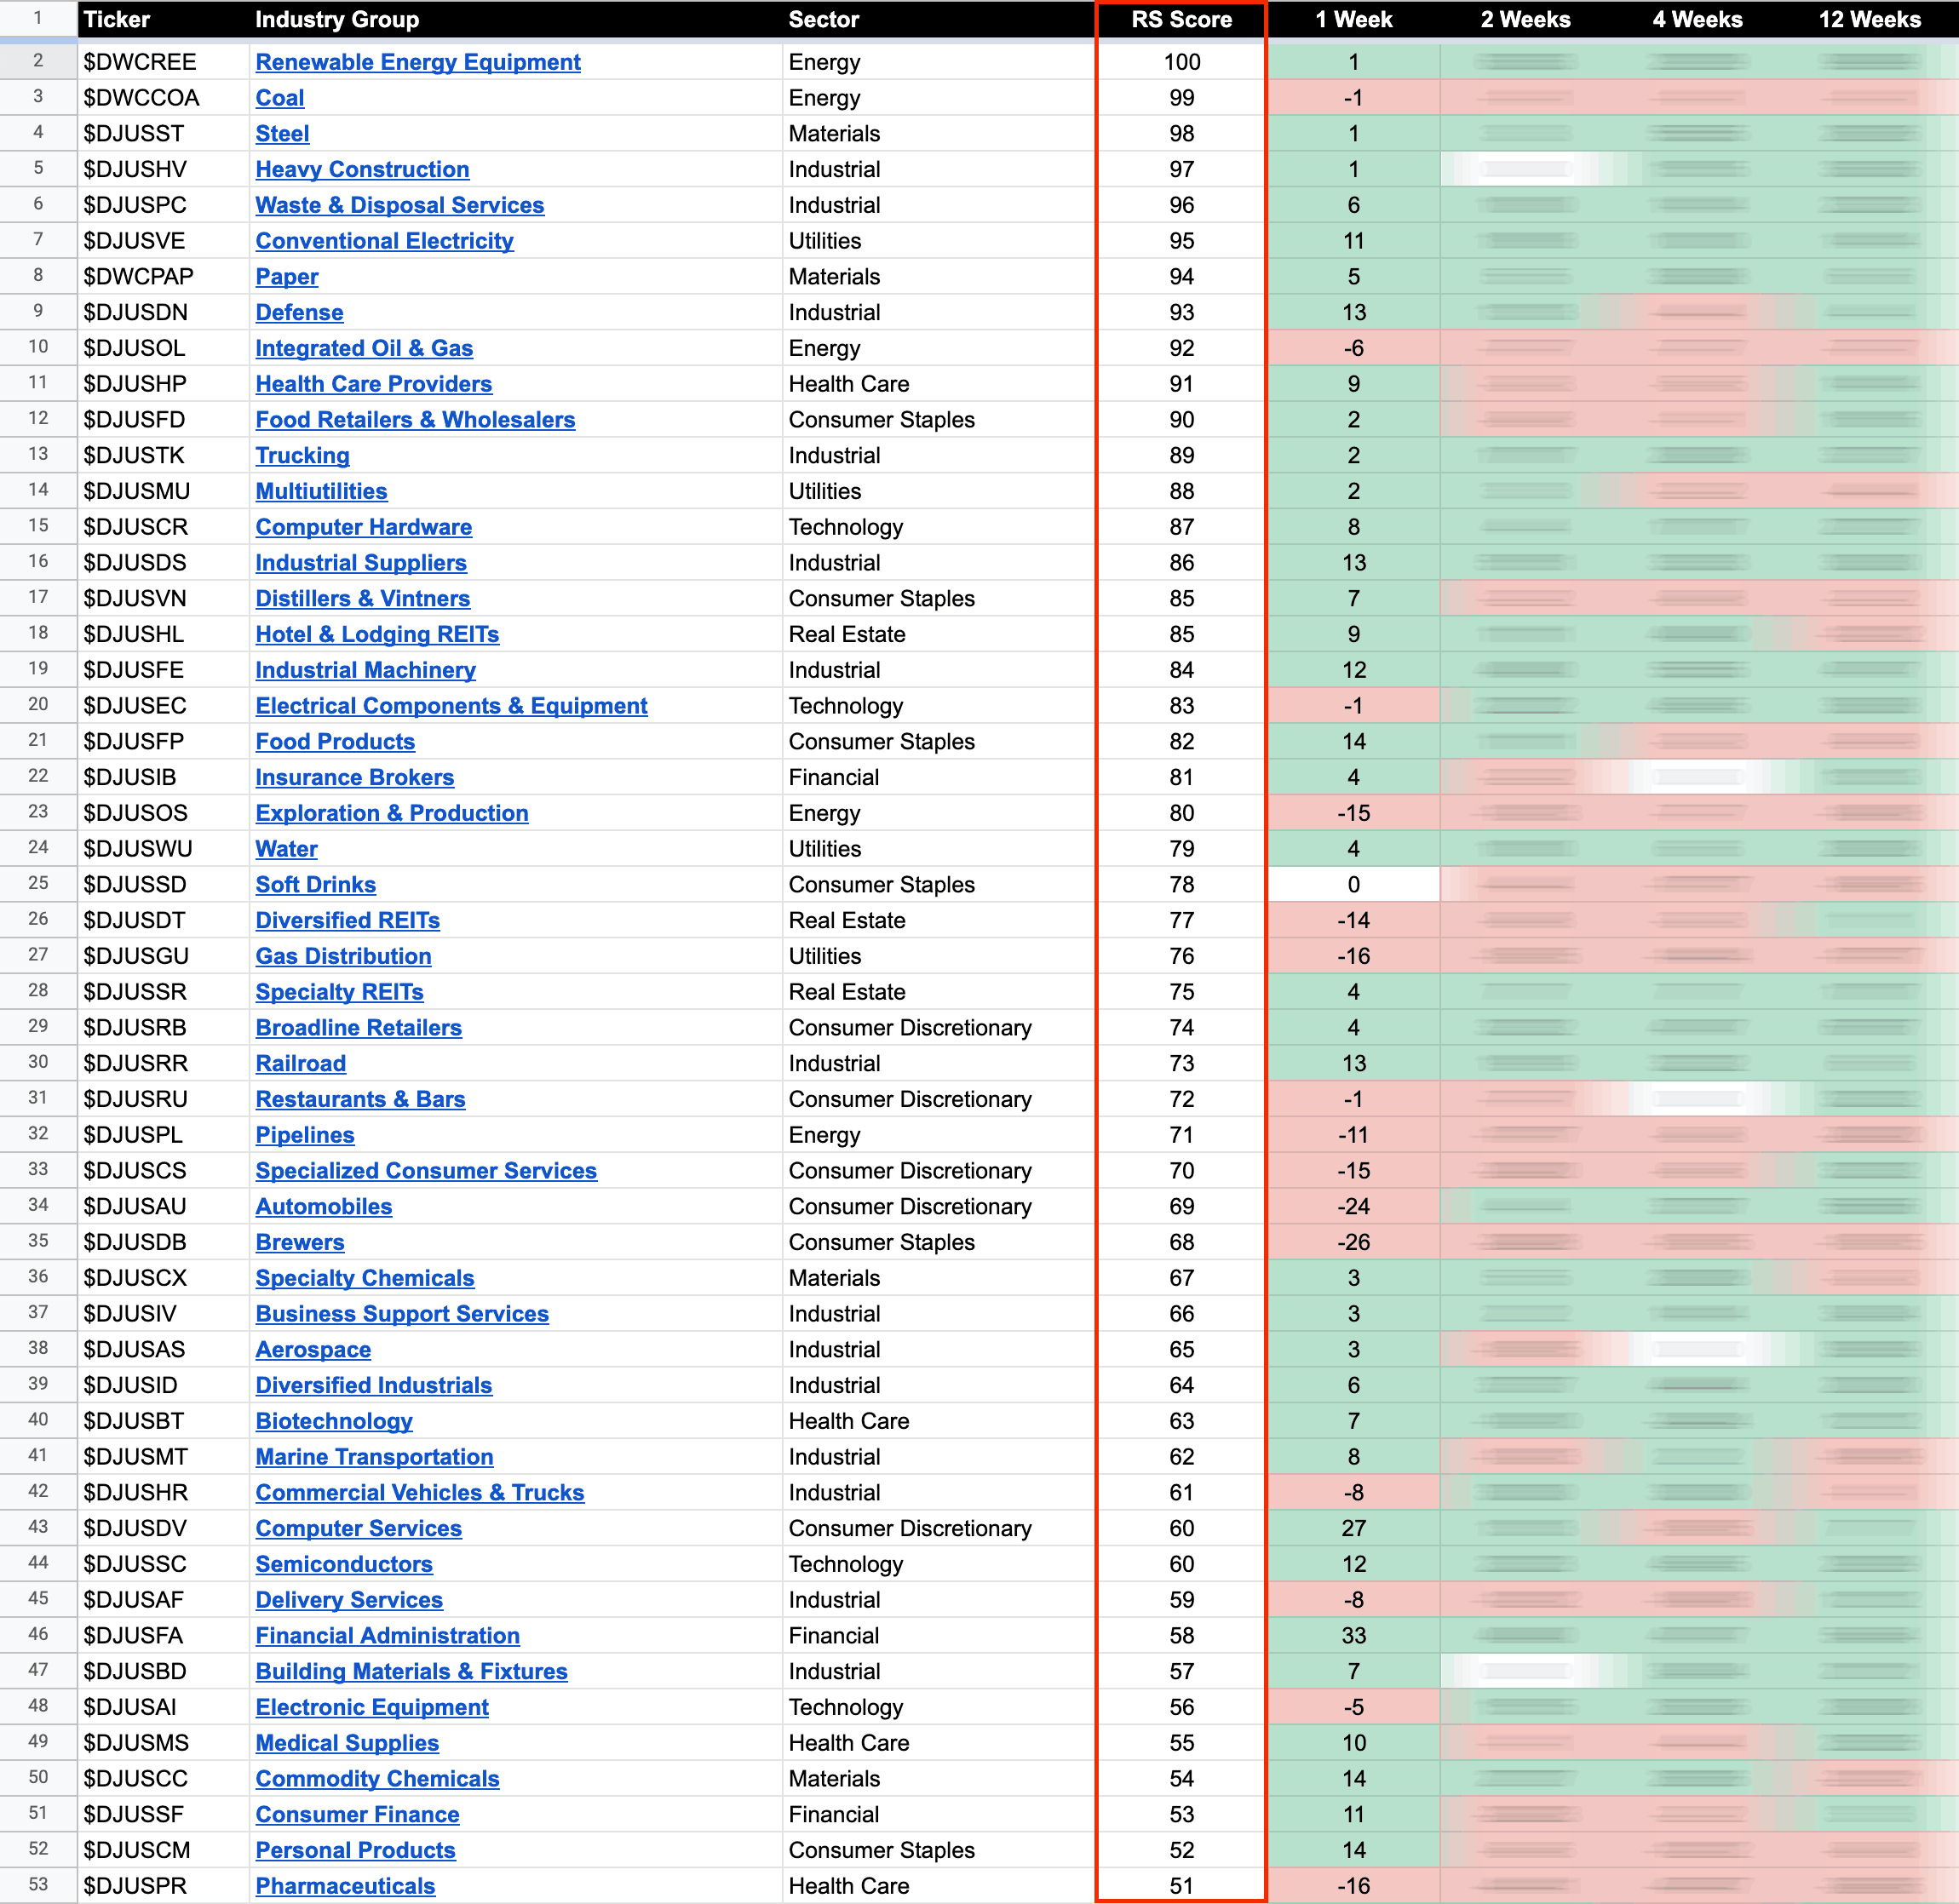
US Industry Groups by Highest RS Score
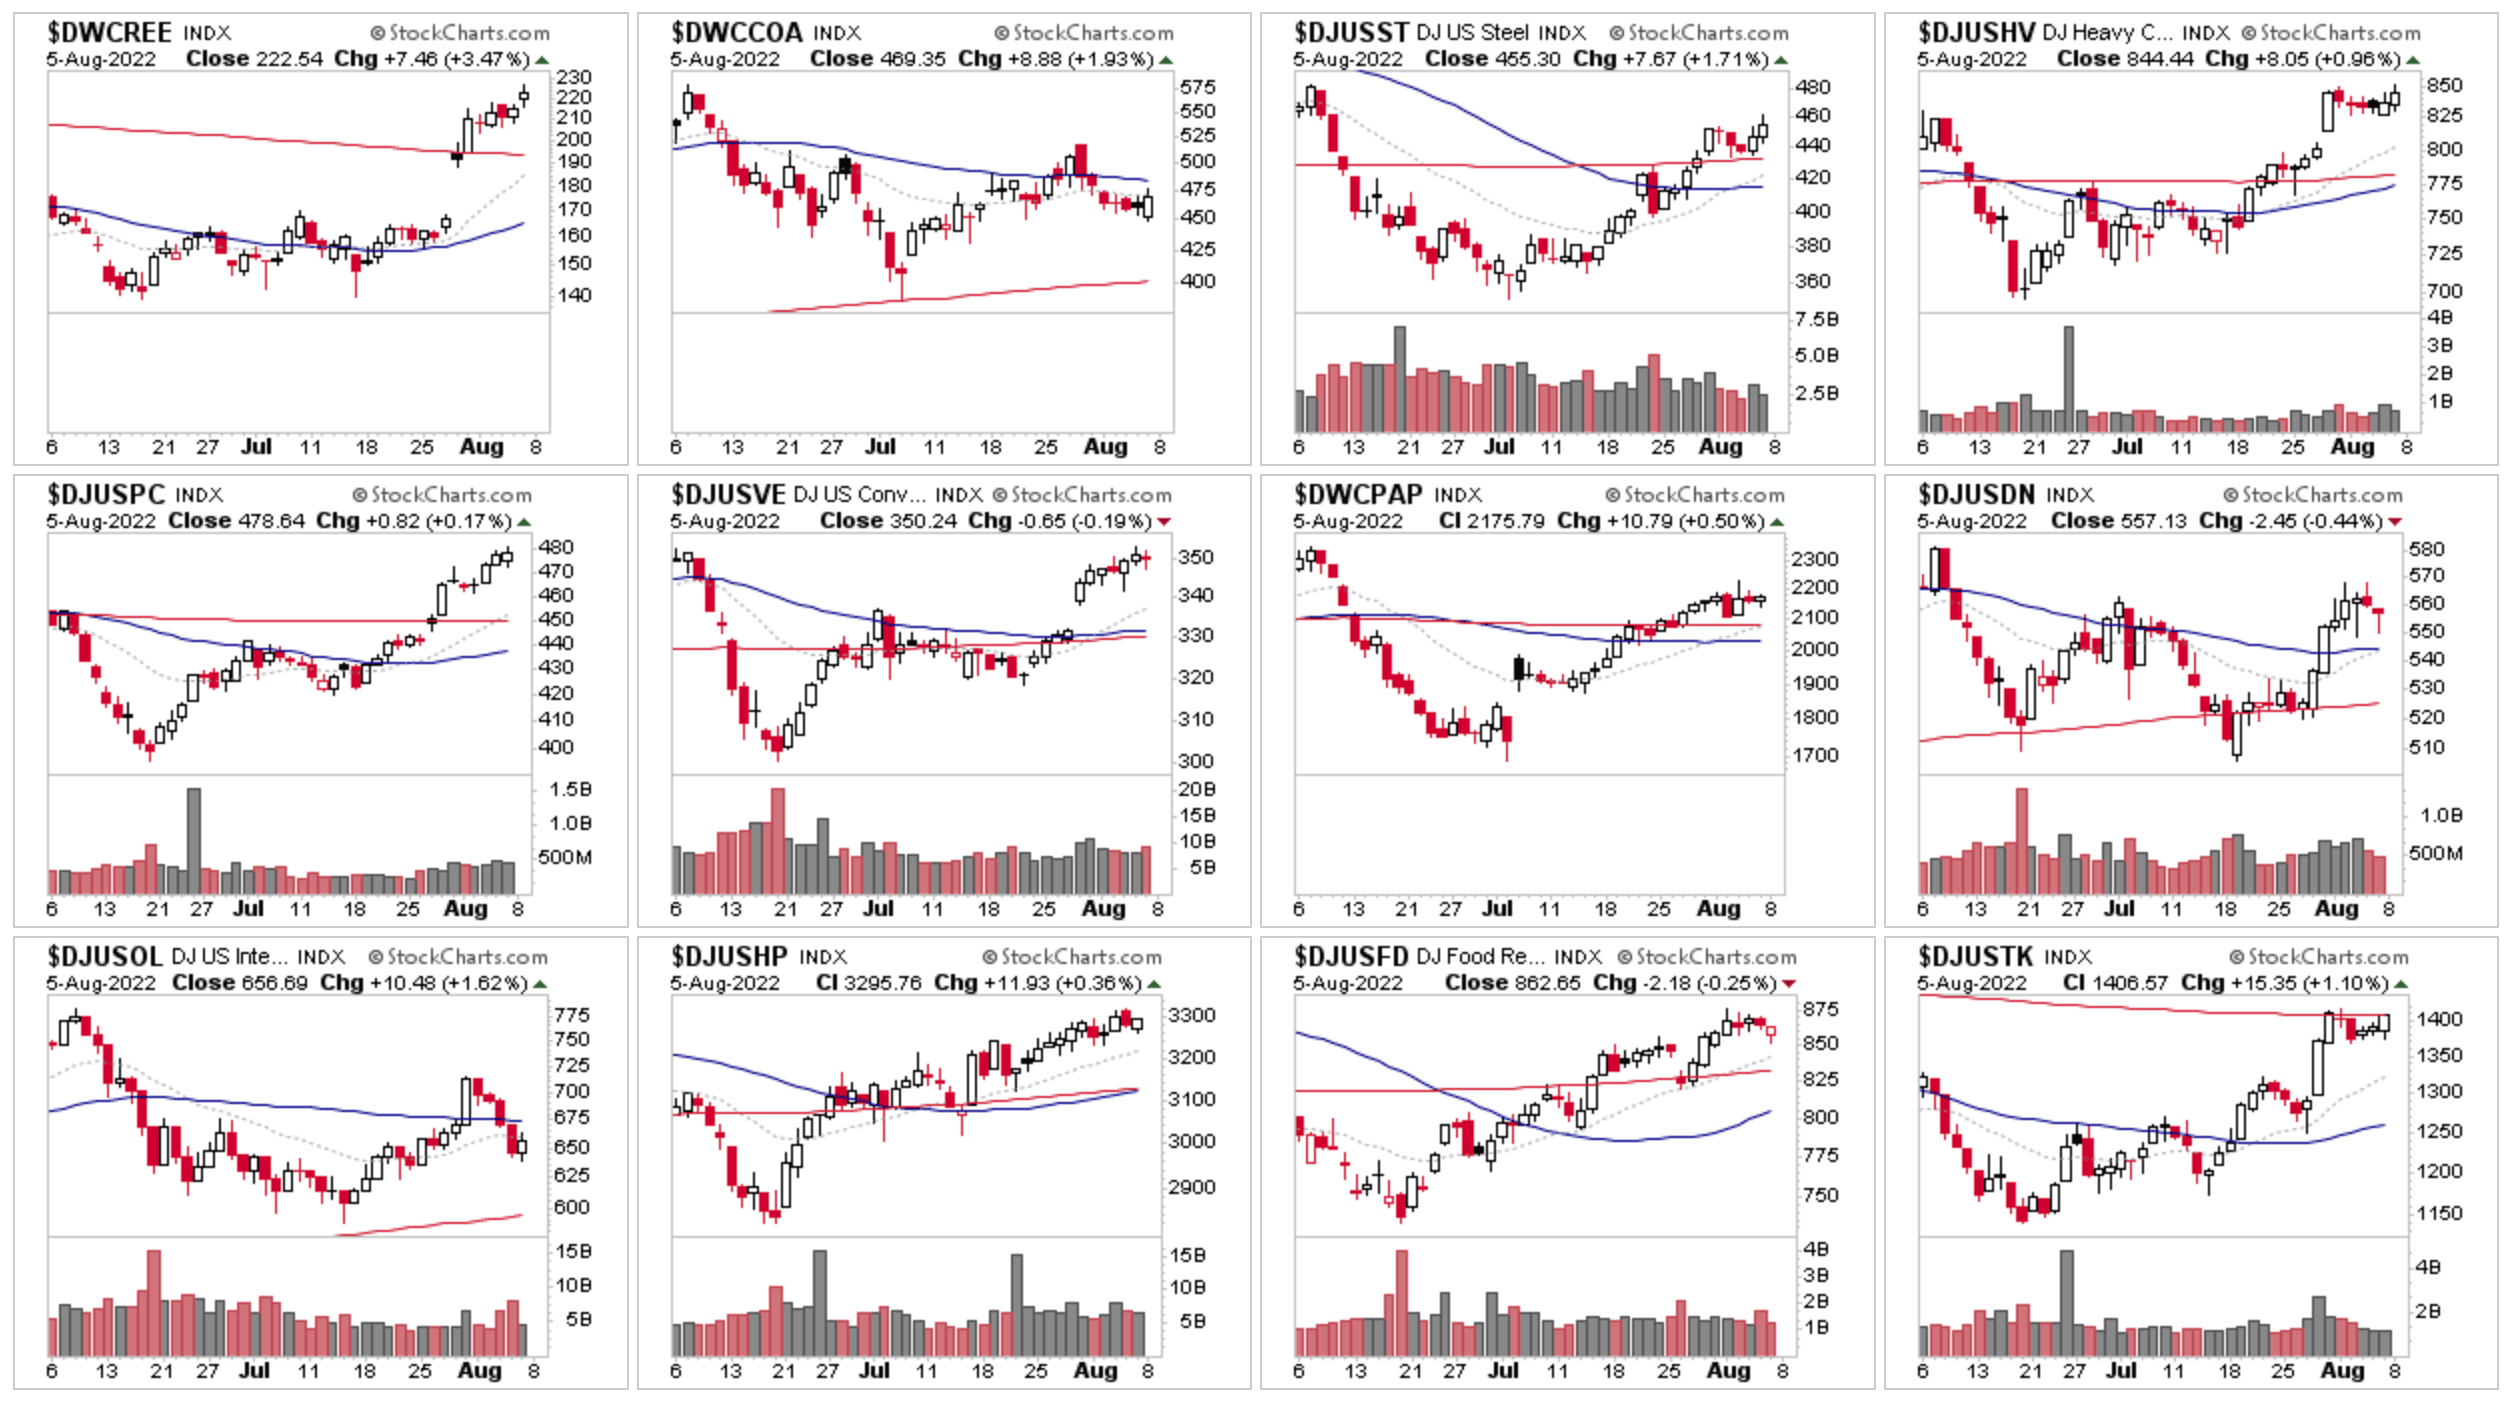
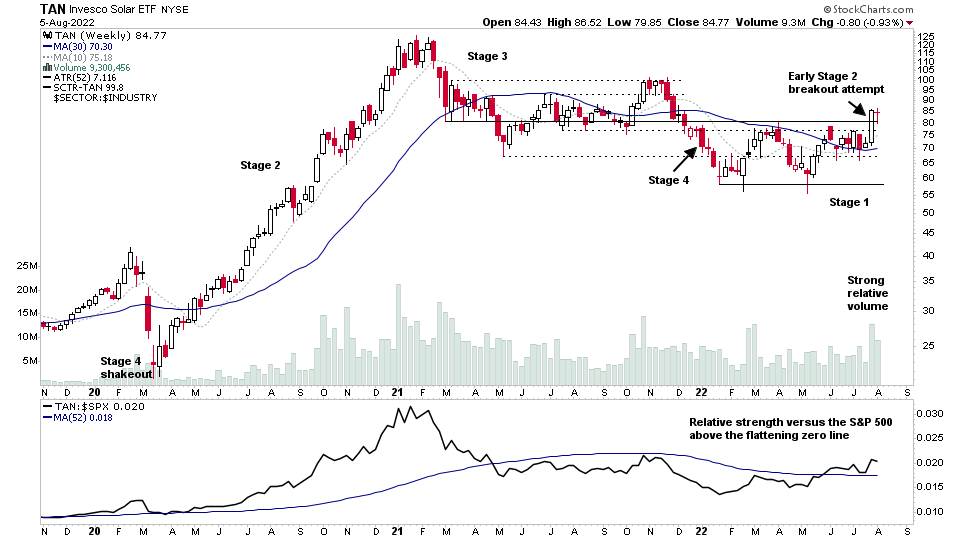
We've finally seen a change at the top of the RS table, with Coal dropping to 2nd and last weeks standout group Renewable Energy Equipment ($DWCREE) moving into the top spot following last weeks Stage 2 breakout in the group and tight consolidation this week above the breakout level and prior Stage 1 base structure. I highlighted the Invesco Solar ETF – TAN last week, which is a potential way to trade the group if you are not trading the individual stocks.
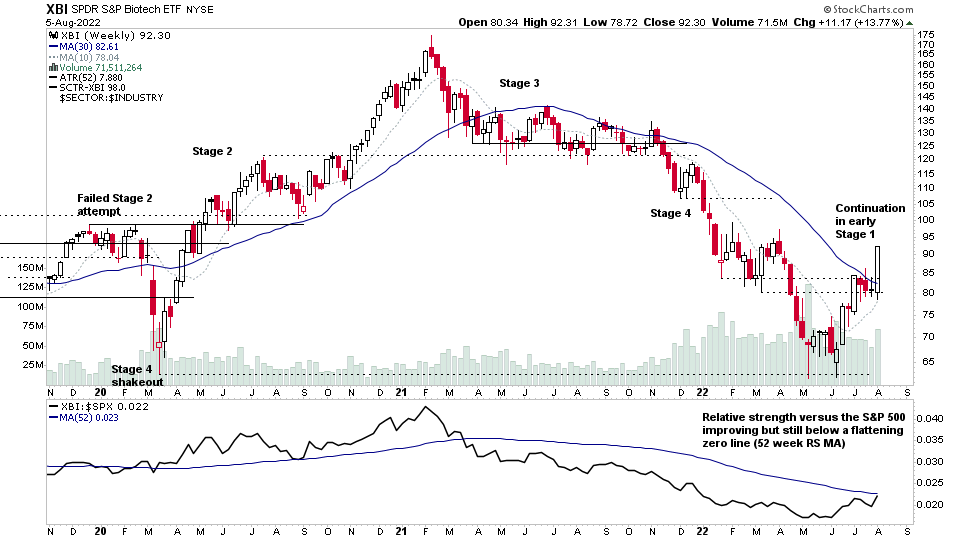
The Biotechnology group is another area of interest this week moving back up the RS rankings to 39th. See last nights post: Biotech and Solar Stocks Continue To Be In-Focus and the US Stocks Watchlist – 4 August 2022 for the charts and commentary of it's continuation in Stage 1.
Software Group
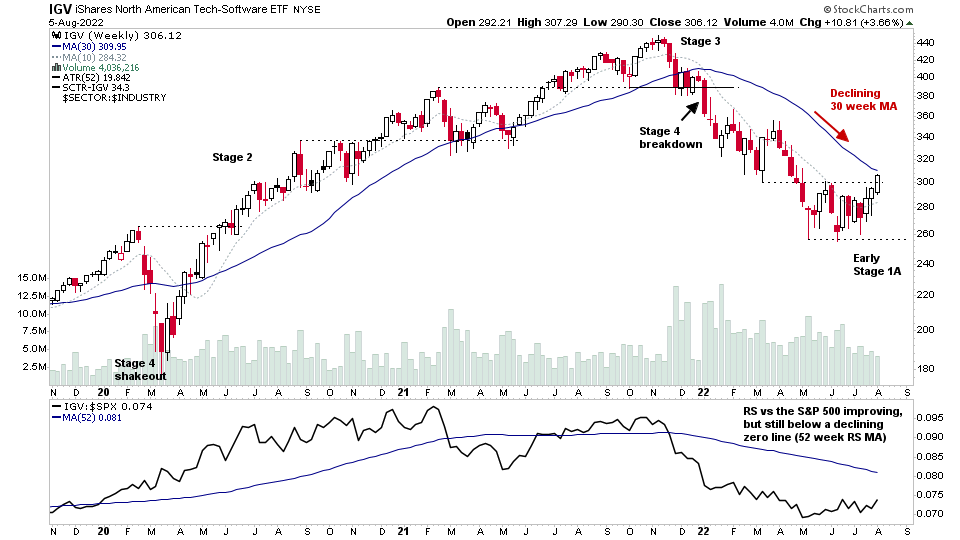
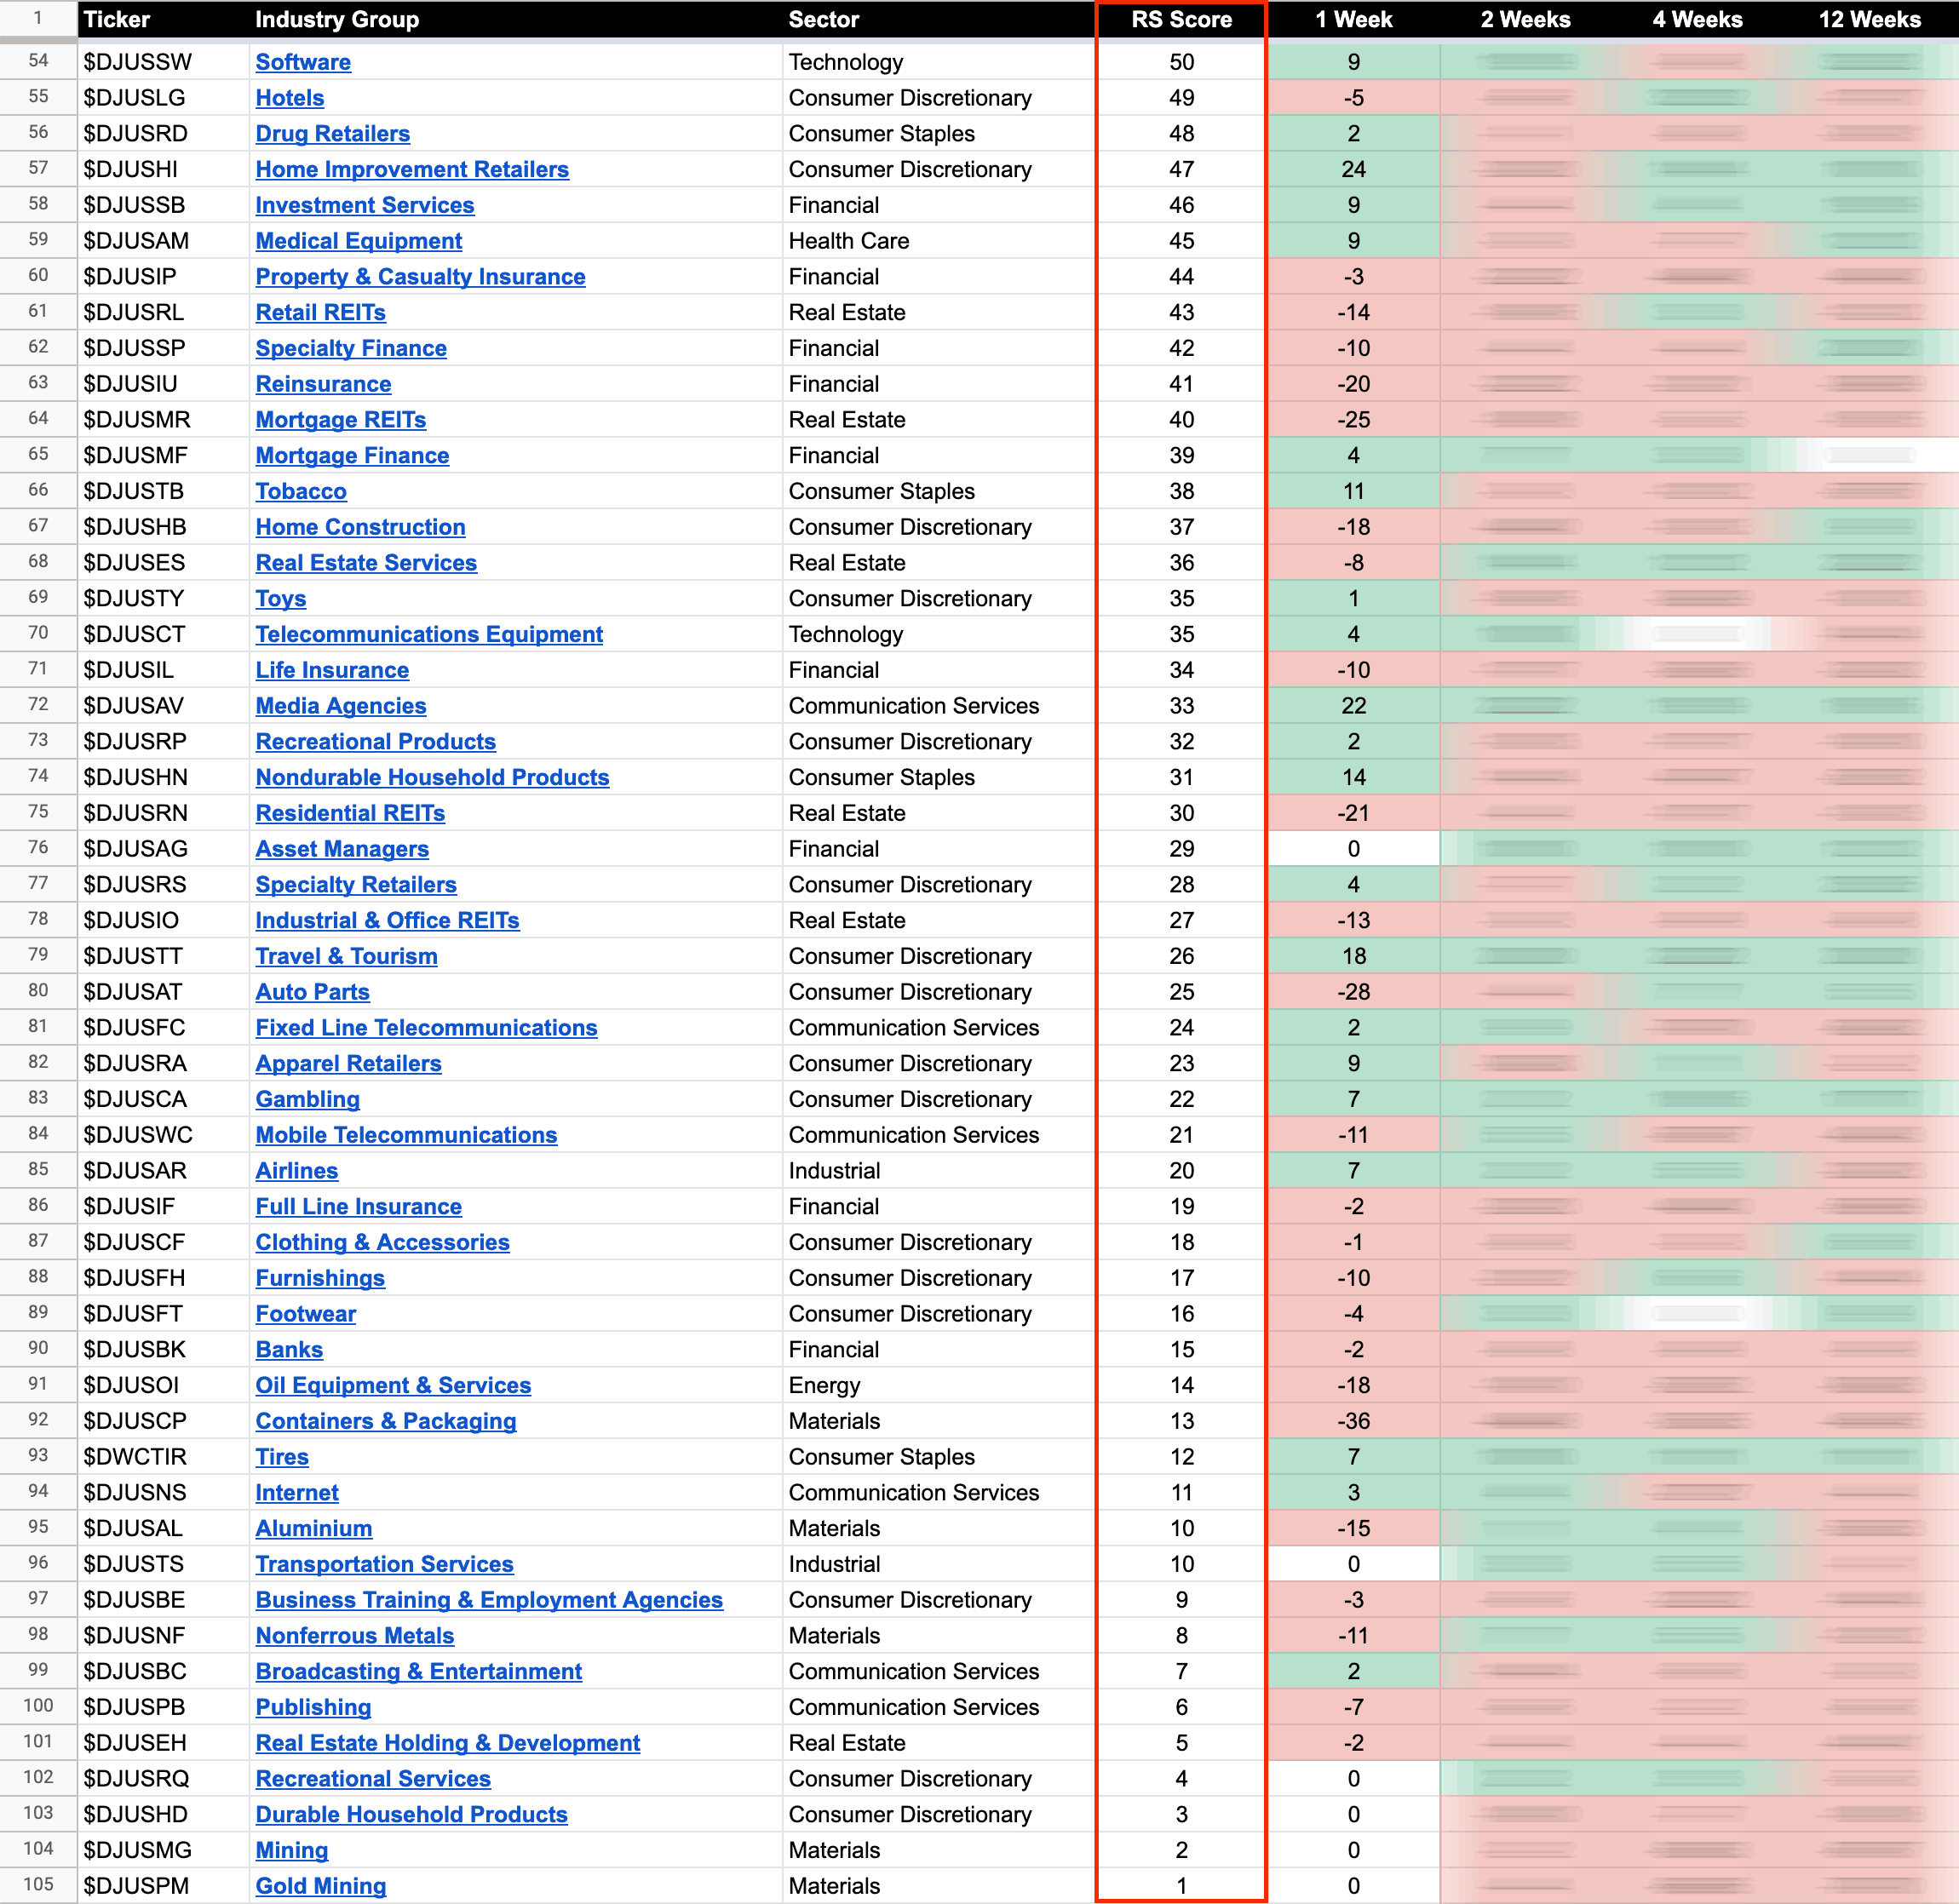
The group I wanted to highlight this week though, is very much off of most peoples radar, which is the Software group. As the majority of stocks in the group have had deep Stage 4 declines that have been much worse than some other areas of the market. But it is a very large group with well over 300 stocks, and new IPOs regularly. So you may have noticed it starting to creep back up the RS table over the last 3 months, with it rising 32 RS points to an SCTR score of 50 currently. Which puts it in 53rd position overall, so just under the mid point for the 104 US Industry Groups, and the group chart has started to potentially transition in the early part of Stage 1, which is known as Stage 1A.
IGV is one of the major ETFs that covers the group. So below is the markup of the weekly chart.
US Industry Groups by Weakest RS Score
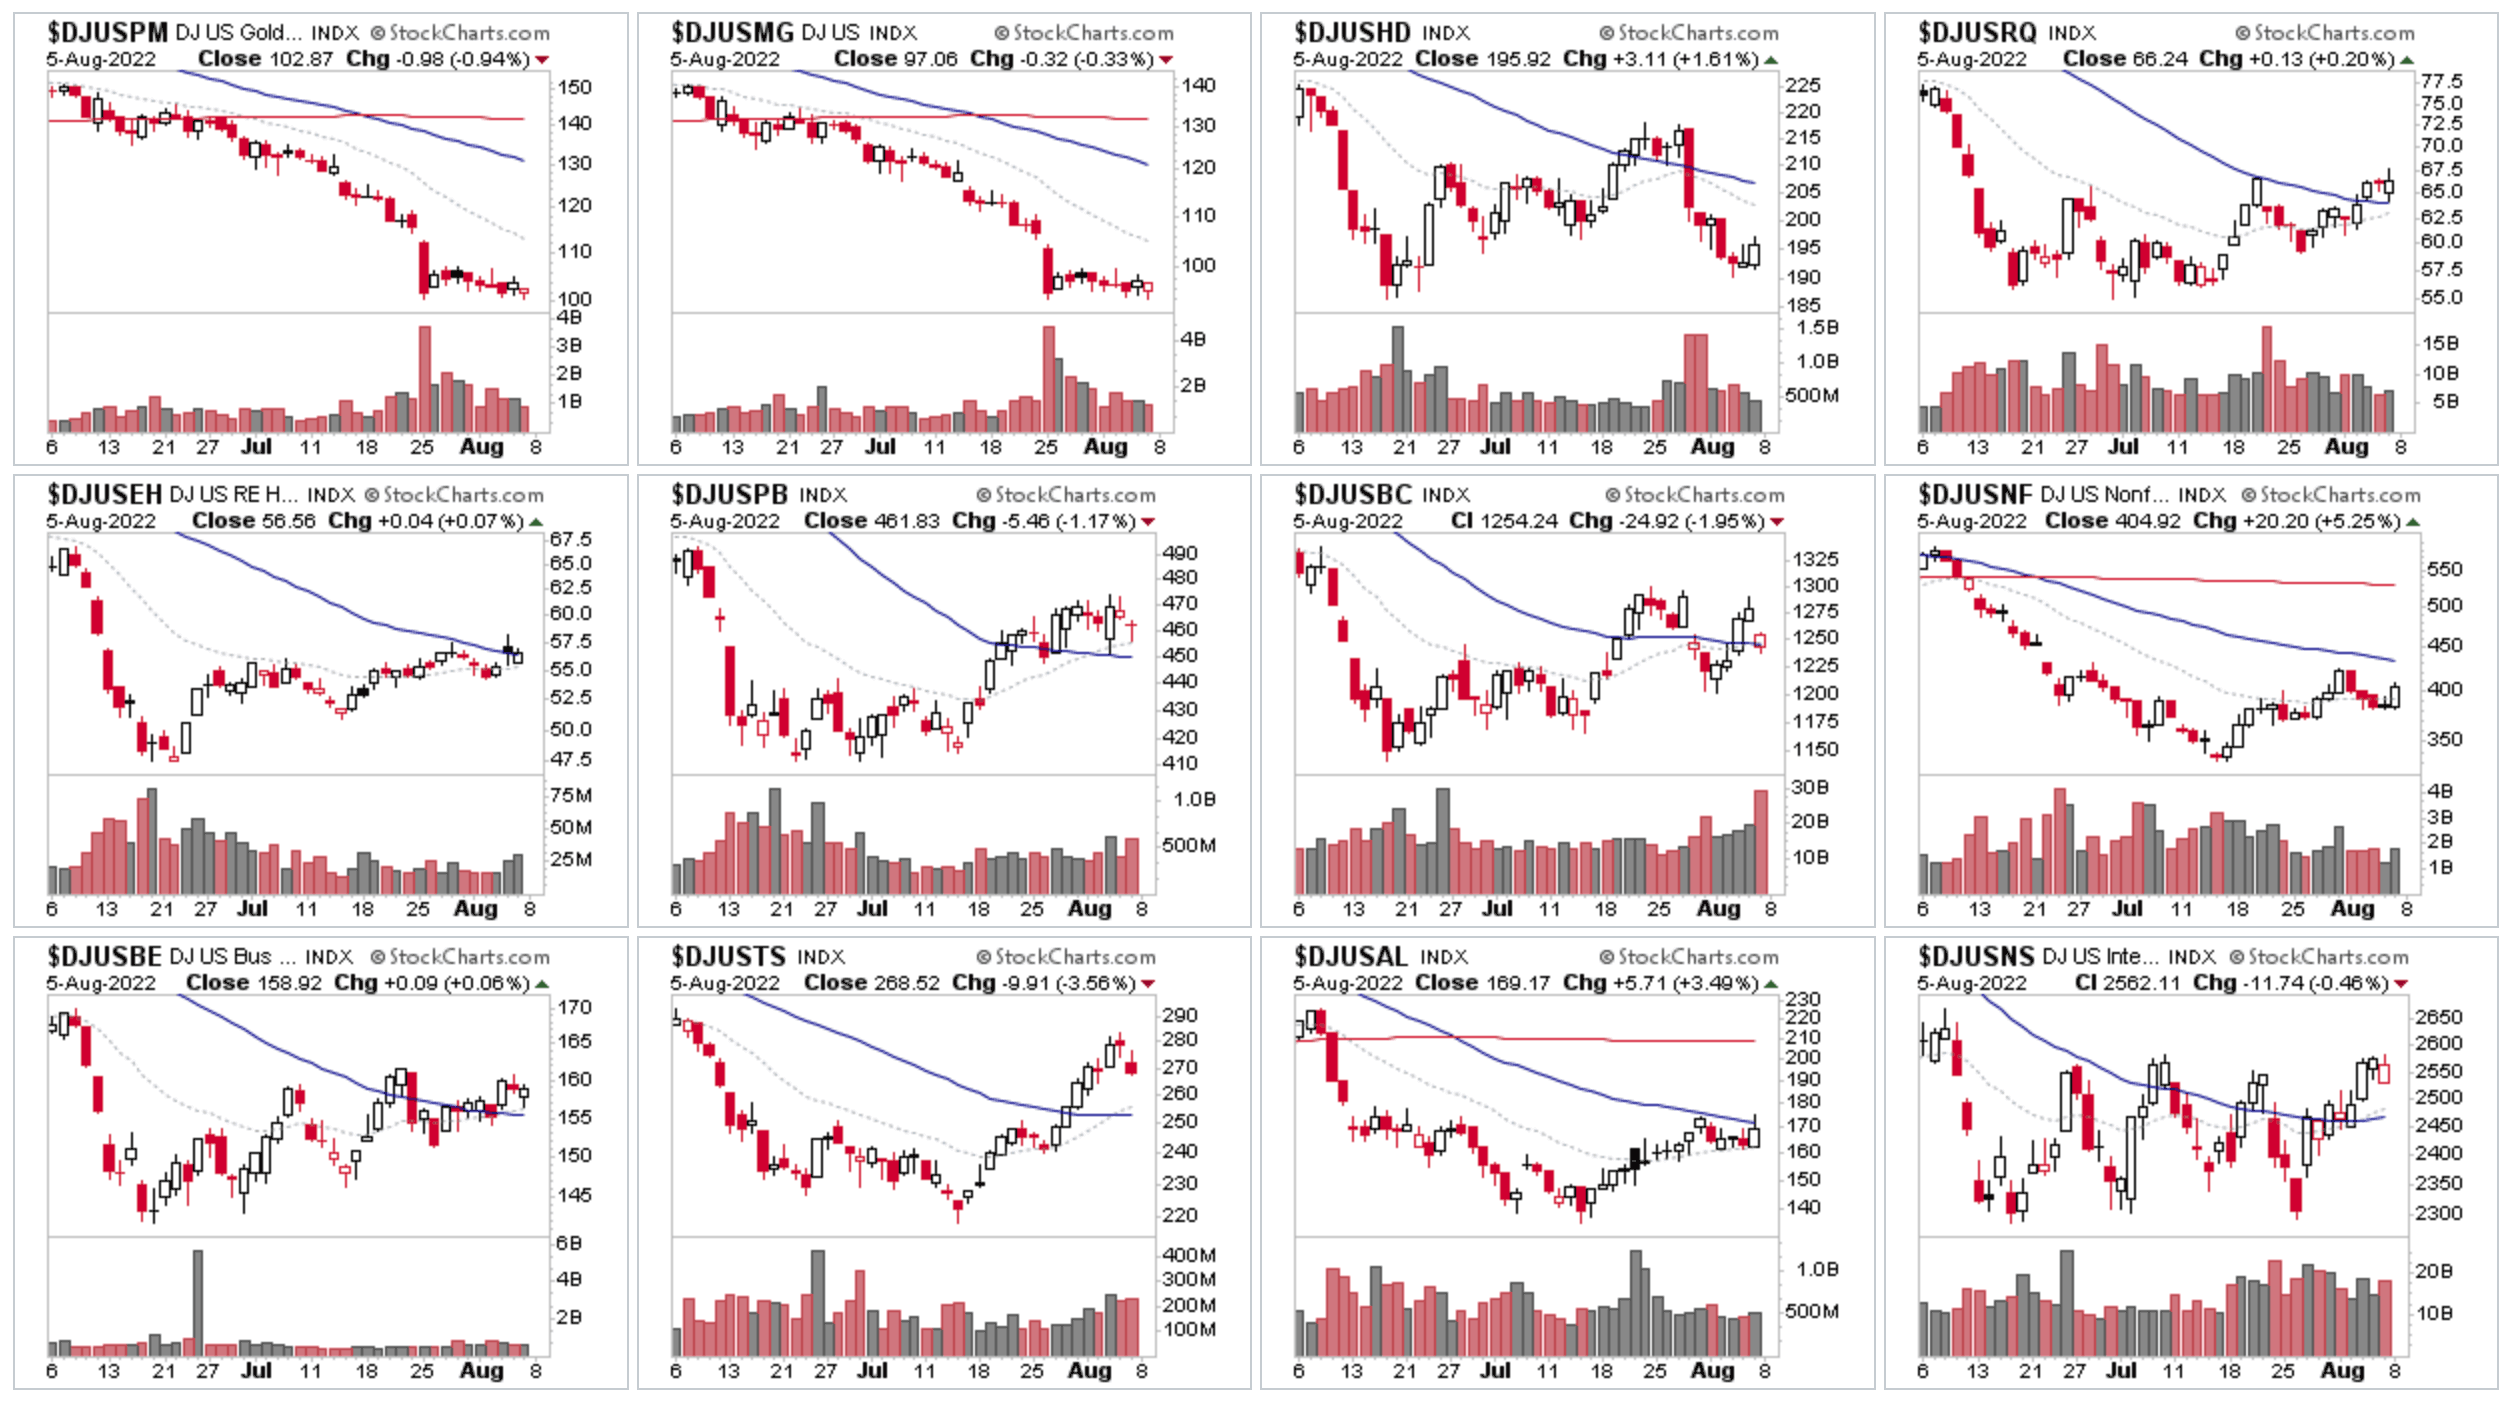
Gold Mining and Mining remain at the bottom of the RS rankings for a second week, even though gold futures moved back above their 50 day MA. But the gold stocks failed to make much progress.
The weakest percentage moves this week however were in the previously leading Oil groups, with Integrated Oil & Gas for example declining by -7.82% and continuing to edge down the RS rankings. Although, it still remains in 9th overall.
104 Dow Jones Industry Groups sorted by Relative Strength
The purpose of the Relative Strength (RS) tables is to track the short, medium and long-term RS changes of the individual groups to find the new leadership earlier than the crowd.
RS Score of 100 is the strongest, and 0 is the weakest.
In the Stage Analysis method we are looking to focus on the strongest groups, as what is strong, tends to stay strong for a long time. But we also want to find the improving / up and coming groups that are starting to rise up strongly through the RS table from the lower zone, in order to find the future leading stocks before they break out from a Stage 1 base and move into a Stage 2 advancing phase.
Each week I go through the most interesting groups on the move in more detail during the Stage Analysis Members weekend video – as Industry Group analysis is a key part of Stan Weinstein's Stage Analysis method.
Become a Stage Analysis Member:
To see more like this – US Stocks watchlist posts, detailed videos each weekend, use our unique Stage Analysis tools, such as the US Stocks & ETFs Screener, Charts, Market Breadth, Group Relative Strength and more...
Join Today
Disclaimer: For educational purpose only. Not investment advice. Seek professional advice from a financial advisor before making any investing decisions.