
Earnings Focus – Springs and Breakouts – 26 July 2022
The full post is available to view by members only. For immediate access:
There were a number of important mega cap stocks reporting today, as well some others from the watchlist. So below is a multiple timeframe analysis a few of the key stocks reporting today – GOOGL, MSFT, ENPH & CMG
GOOGL – Alphabet (Google)
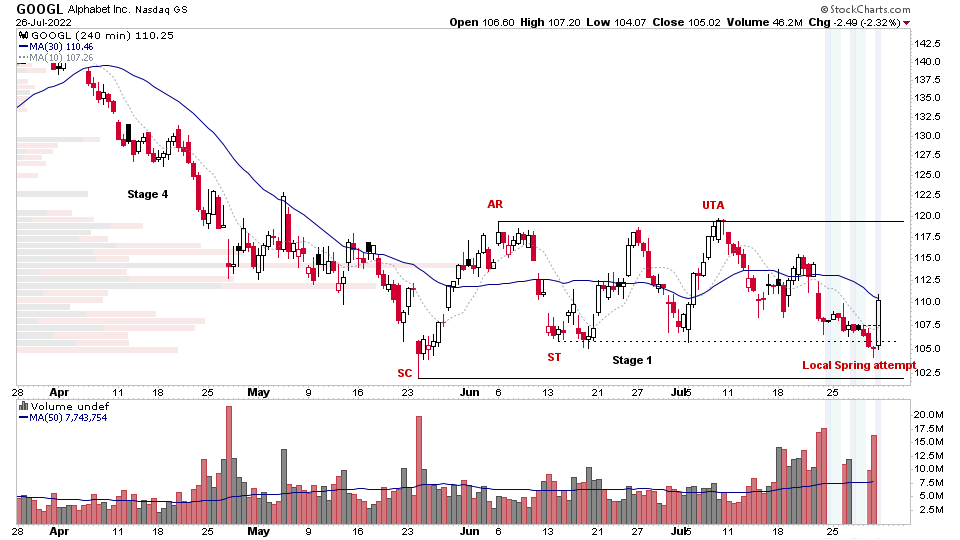
Starting with the lower intraday 4-hour chart, you can see an attempt to rally in the after-hours trade following the earnings results. But the price action has been to the upside, with a local Spring attempt forming what looks to be a potential Phase C of the Stage 1 base on the 4-hour timeframe. But it remains under the high volume nodes and VPOC of the base structure. So will be watching to see how it reacts to those in Wednesdays session, as it will likely be targeted by the shorts into the short-term MAs initially. So I'll be watching to see if the demand can absorb the supply.
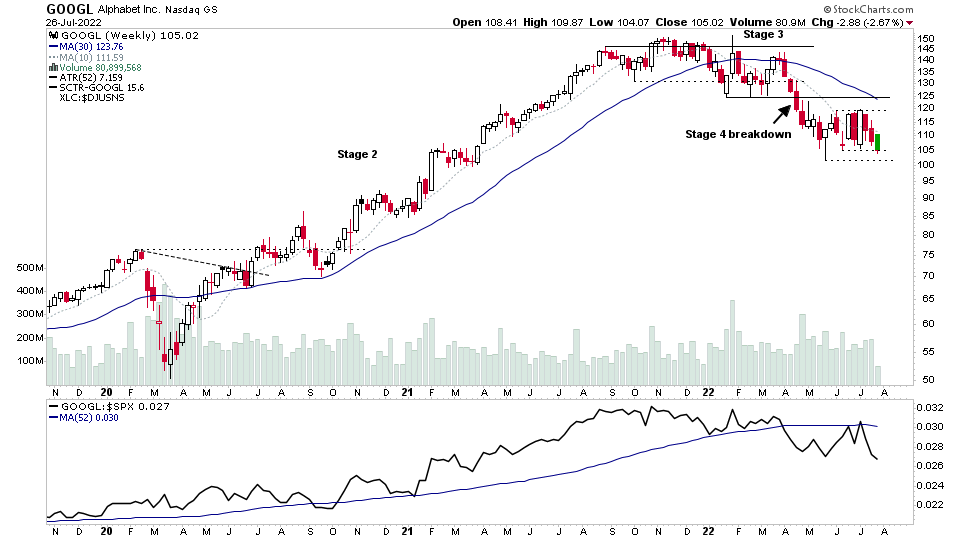
The weekly chart (shown below) remains in a Stage 4 declining phase, below a still declining 30 week MA (123.76) and 10 week MA (111.59). So, it has a lot of work to do to recover into Stage 1 still.
MSFT - Microsoft
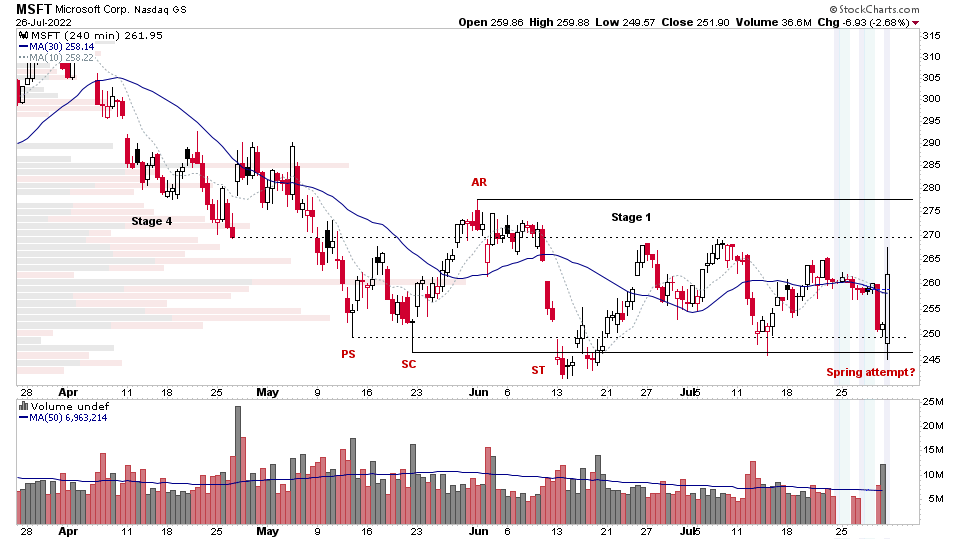
Microsoft initially traded lower following earnings results, but then made a strong reversal move a few hours later, following the earnings call. So if we again start with the lower intraday 4-hour chart (shown above), you can see a well defined Stage 1 base structure on that timeframe since May, with classic Wyckoff structural attributes, and the initial after-hours bar made a Spring attempt, with a slight undercut of the range, which I've marked from both the Preliminary Support (PS) and the Selling Climax (SC).
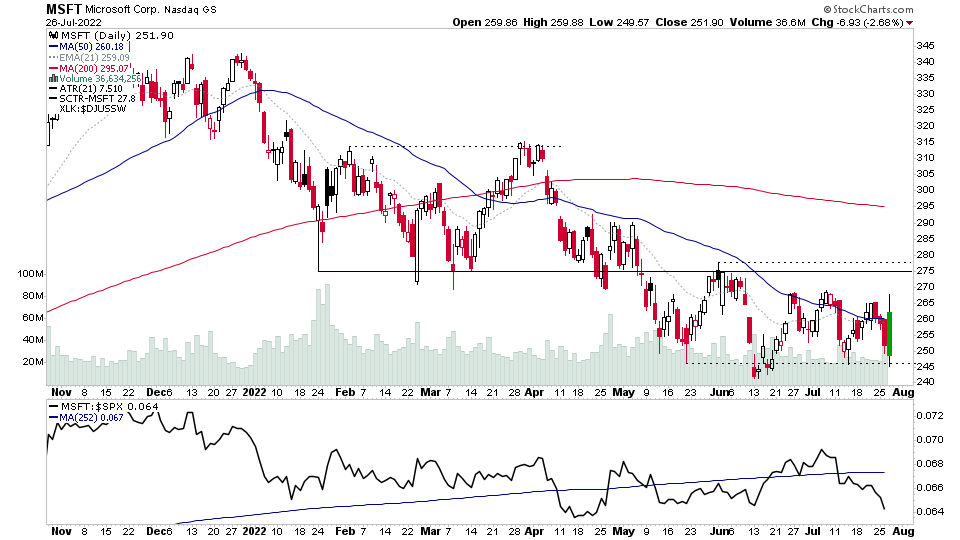
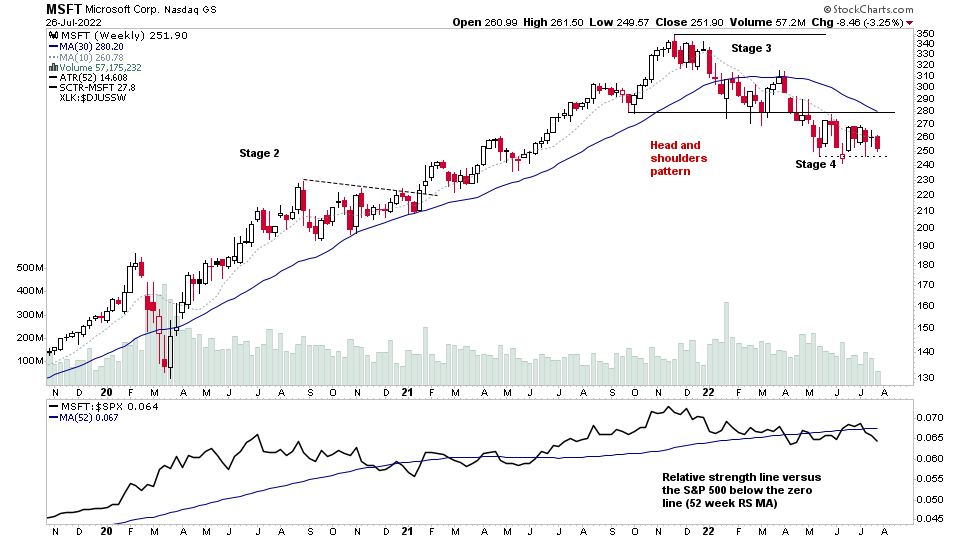
Microsoft is also in the Stage 4 declining phase on the weekly chart (shown below) with a still declining 30 week MA (280.20) and 10 week MA (260.78), and so the Spring attempt is attempting to push above the 50 day MA / 10 week MA and could potentially form a significant gap up bar, if it can follow through tomorrow. But the proximity to the 50 day MA could make it a target for the shorts initially. So it is at a pivotal point, and as with GOOGL, I'll be watching to see how well any supply that comes in is absorbed.
ENPH – Enphase Energy
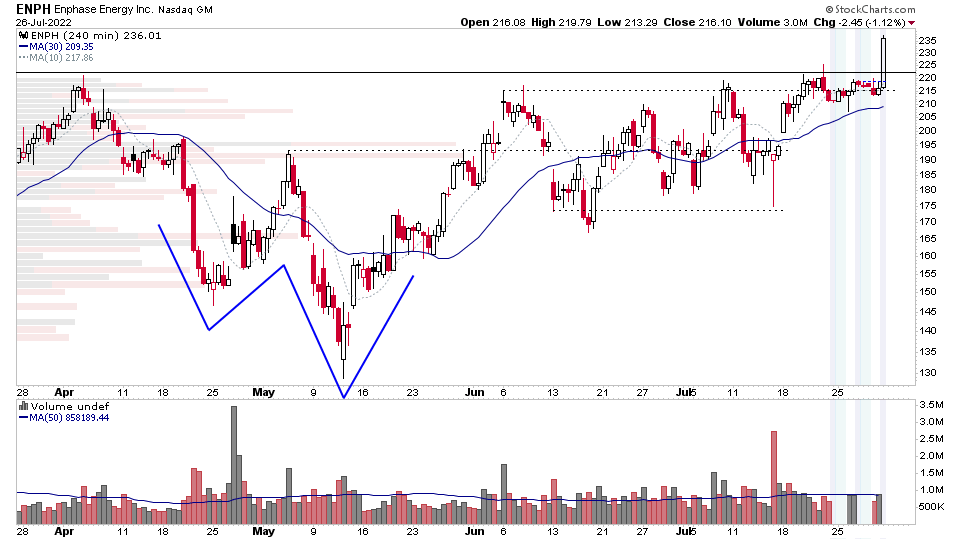
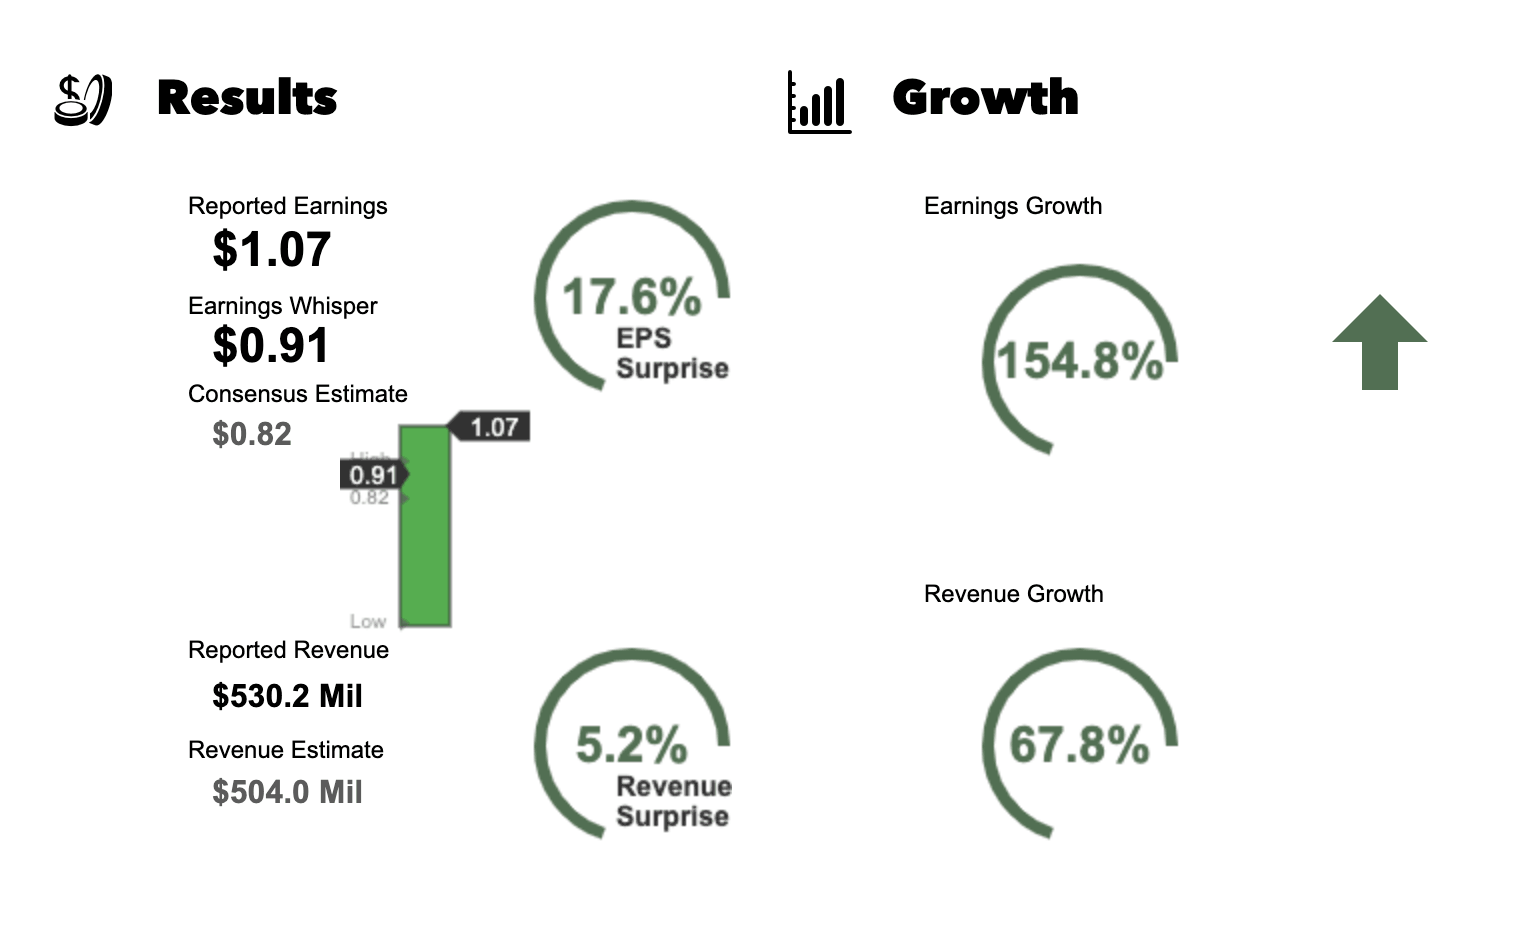
Enphase Energy (ENPH) reported strong earnings results and broke out immediately in the after hours trade, moving over +9%.
On the lower 4-hour time frame multiple sub structures are visible with a double bottom pattern back in April/May to a tighter rectangular base in the upper range in June/July with it tightening considerably over the last week, just under the major resistance, and so has formed a broader Volatility Contraction Pattern (VCP) pattern since the start of the year, with the moving averages all in the right order.
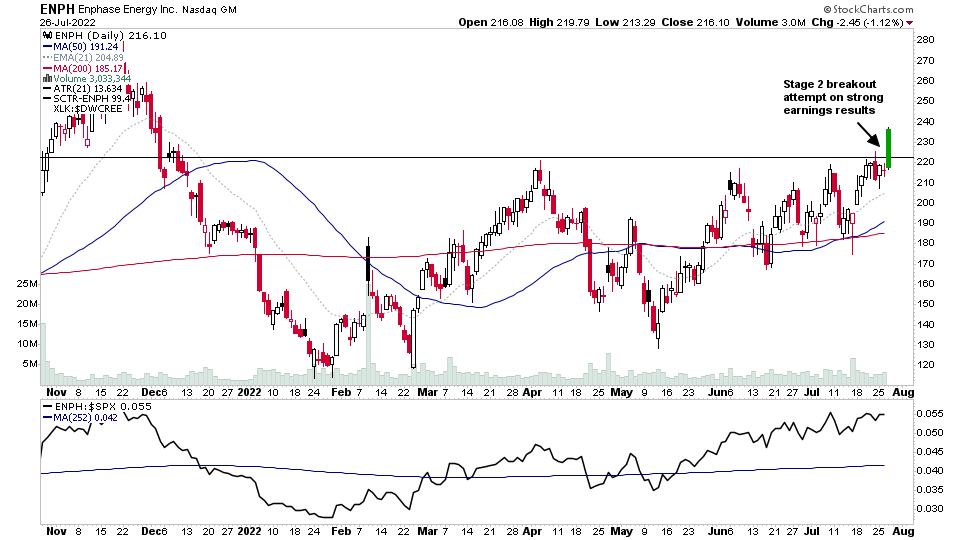
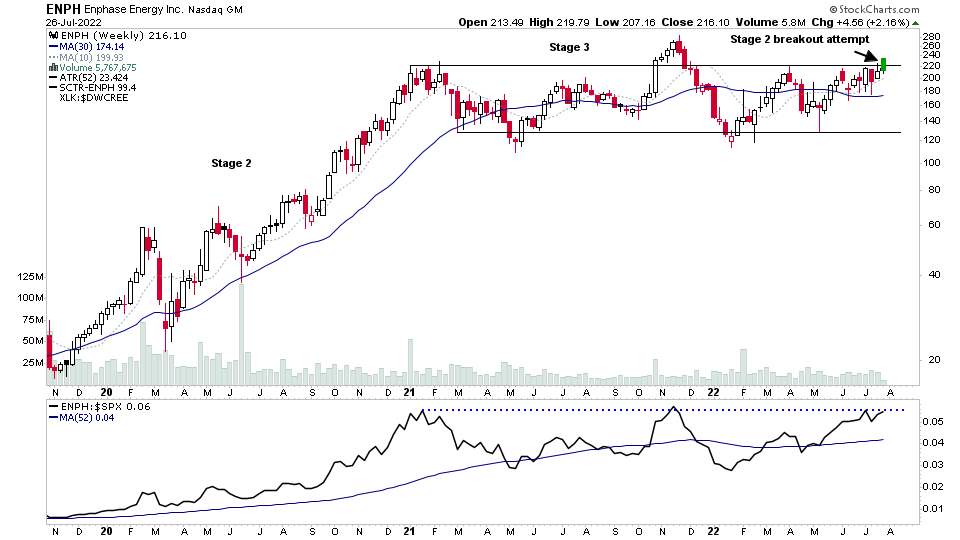
Hence if you move up the timeframes to the daily and weekly charts, the move is a potential Stage 2 breakout attempt from a much larger year and half base structure. Which it originally attempted to breakout from in October 2021, but failed and turned into a UTAD (Upthrust After Distribution) pattern. So it has built up a large cause, which projects the price targets of a potential Stage 2 advance to much higher levels.
CMG – Chipotle Mexican Grill
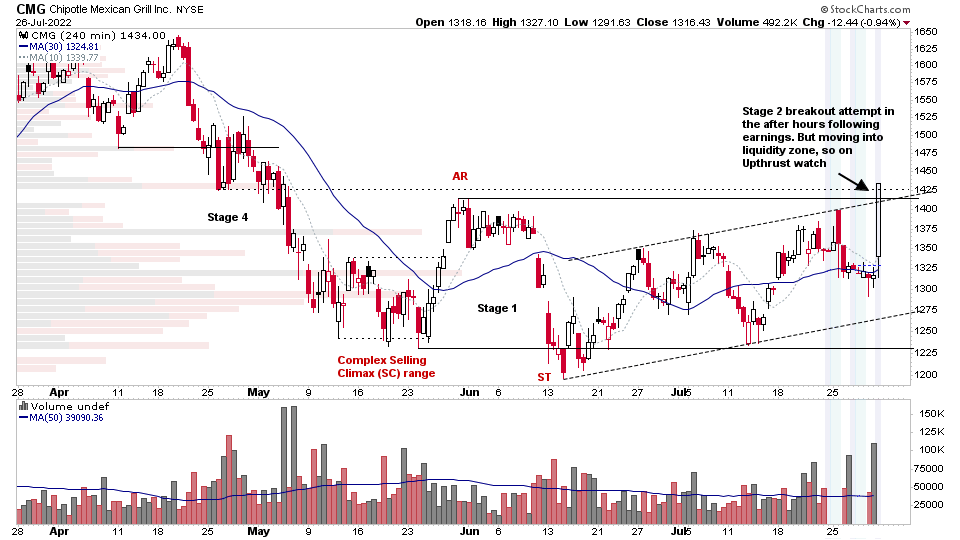
Chipotle has been forming a broader base since 3 weeks into its Stage 4 breakdown, back in January 2022. However, zooming into the shorter-term structure that has formed since May (using the 4-hour chart) a rising channel can be seen within the base which has formed a number of higher lows. And the earnings results have formed a significant bar, which is attempting to breakout into Stage 2 on that lower timeframe.
However, it's not yet clear of the Stage 1 range, and so as with any breakout attempt, there's always the possibility of supply pushing it back into the range, as the breakout point is a liquidity zone. So there's always the possibility of it turning into an Upthrust, and hence you need to alert to any developing signs in the price and volume action.
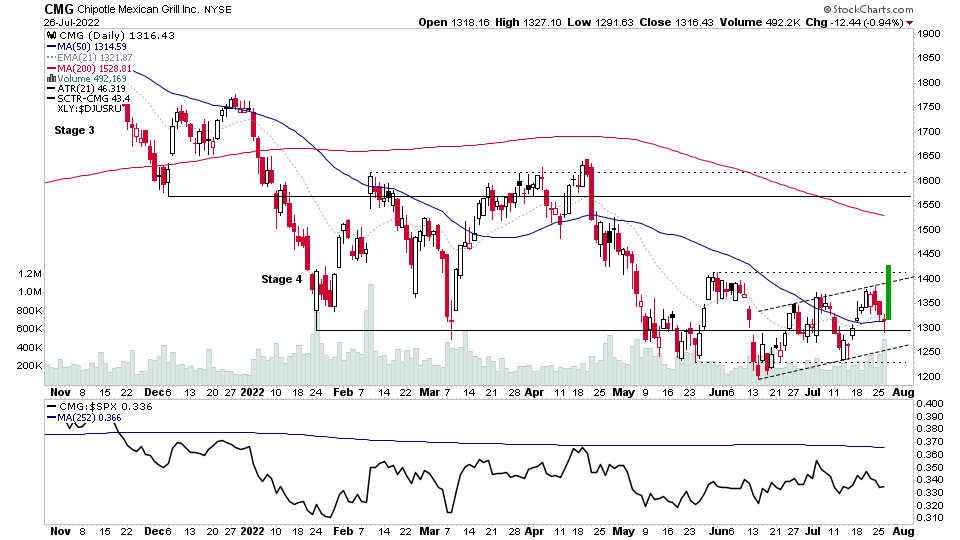
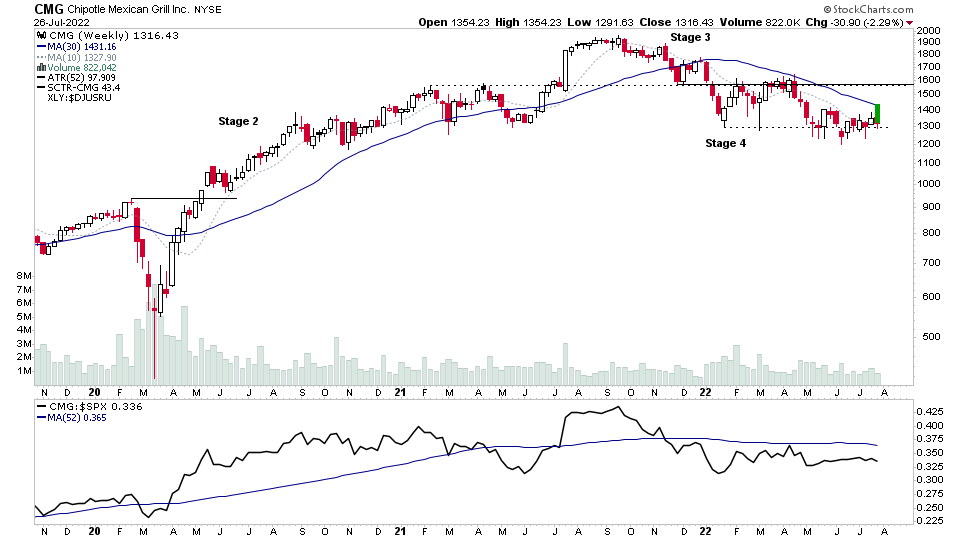
Moving up the timeframes. CMG is now strongly above its 50 day MA and testing the 30 week MA, and hence the 7 month base that's formed in early Stage 4, could start to transition to being Stage 1 if there is follow through in the coming days / weeks.
Become a Stage Analysis Member:
To see more like this – US Stocks watchlist posts, detailed videos each weekend, use our unique Stage Analysis tools, such as the US Stocks & ETFs Screener, Charts, Market Breadth, Group Relative Strength and more...
Join Today
Disclaimer: For educational purpose only. Not investment advice. Seek professional advice from a financial advisor before making any investing decisions.