
Market Breadth: Percentage of Stocks Above their 50 Day, 150 Day & 200 Day Moving Averages Combined
The full post is available to view by members only. For immediate access:
31.40% (+8.03% 1wk)
Status: Tentative Positive Environment in Stage 4 zone
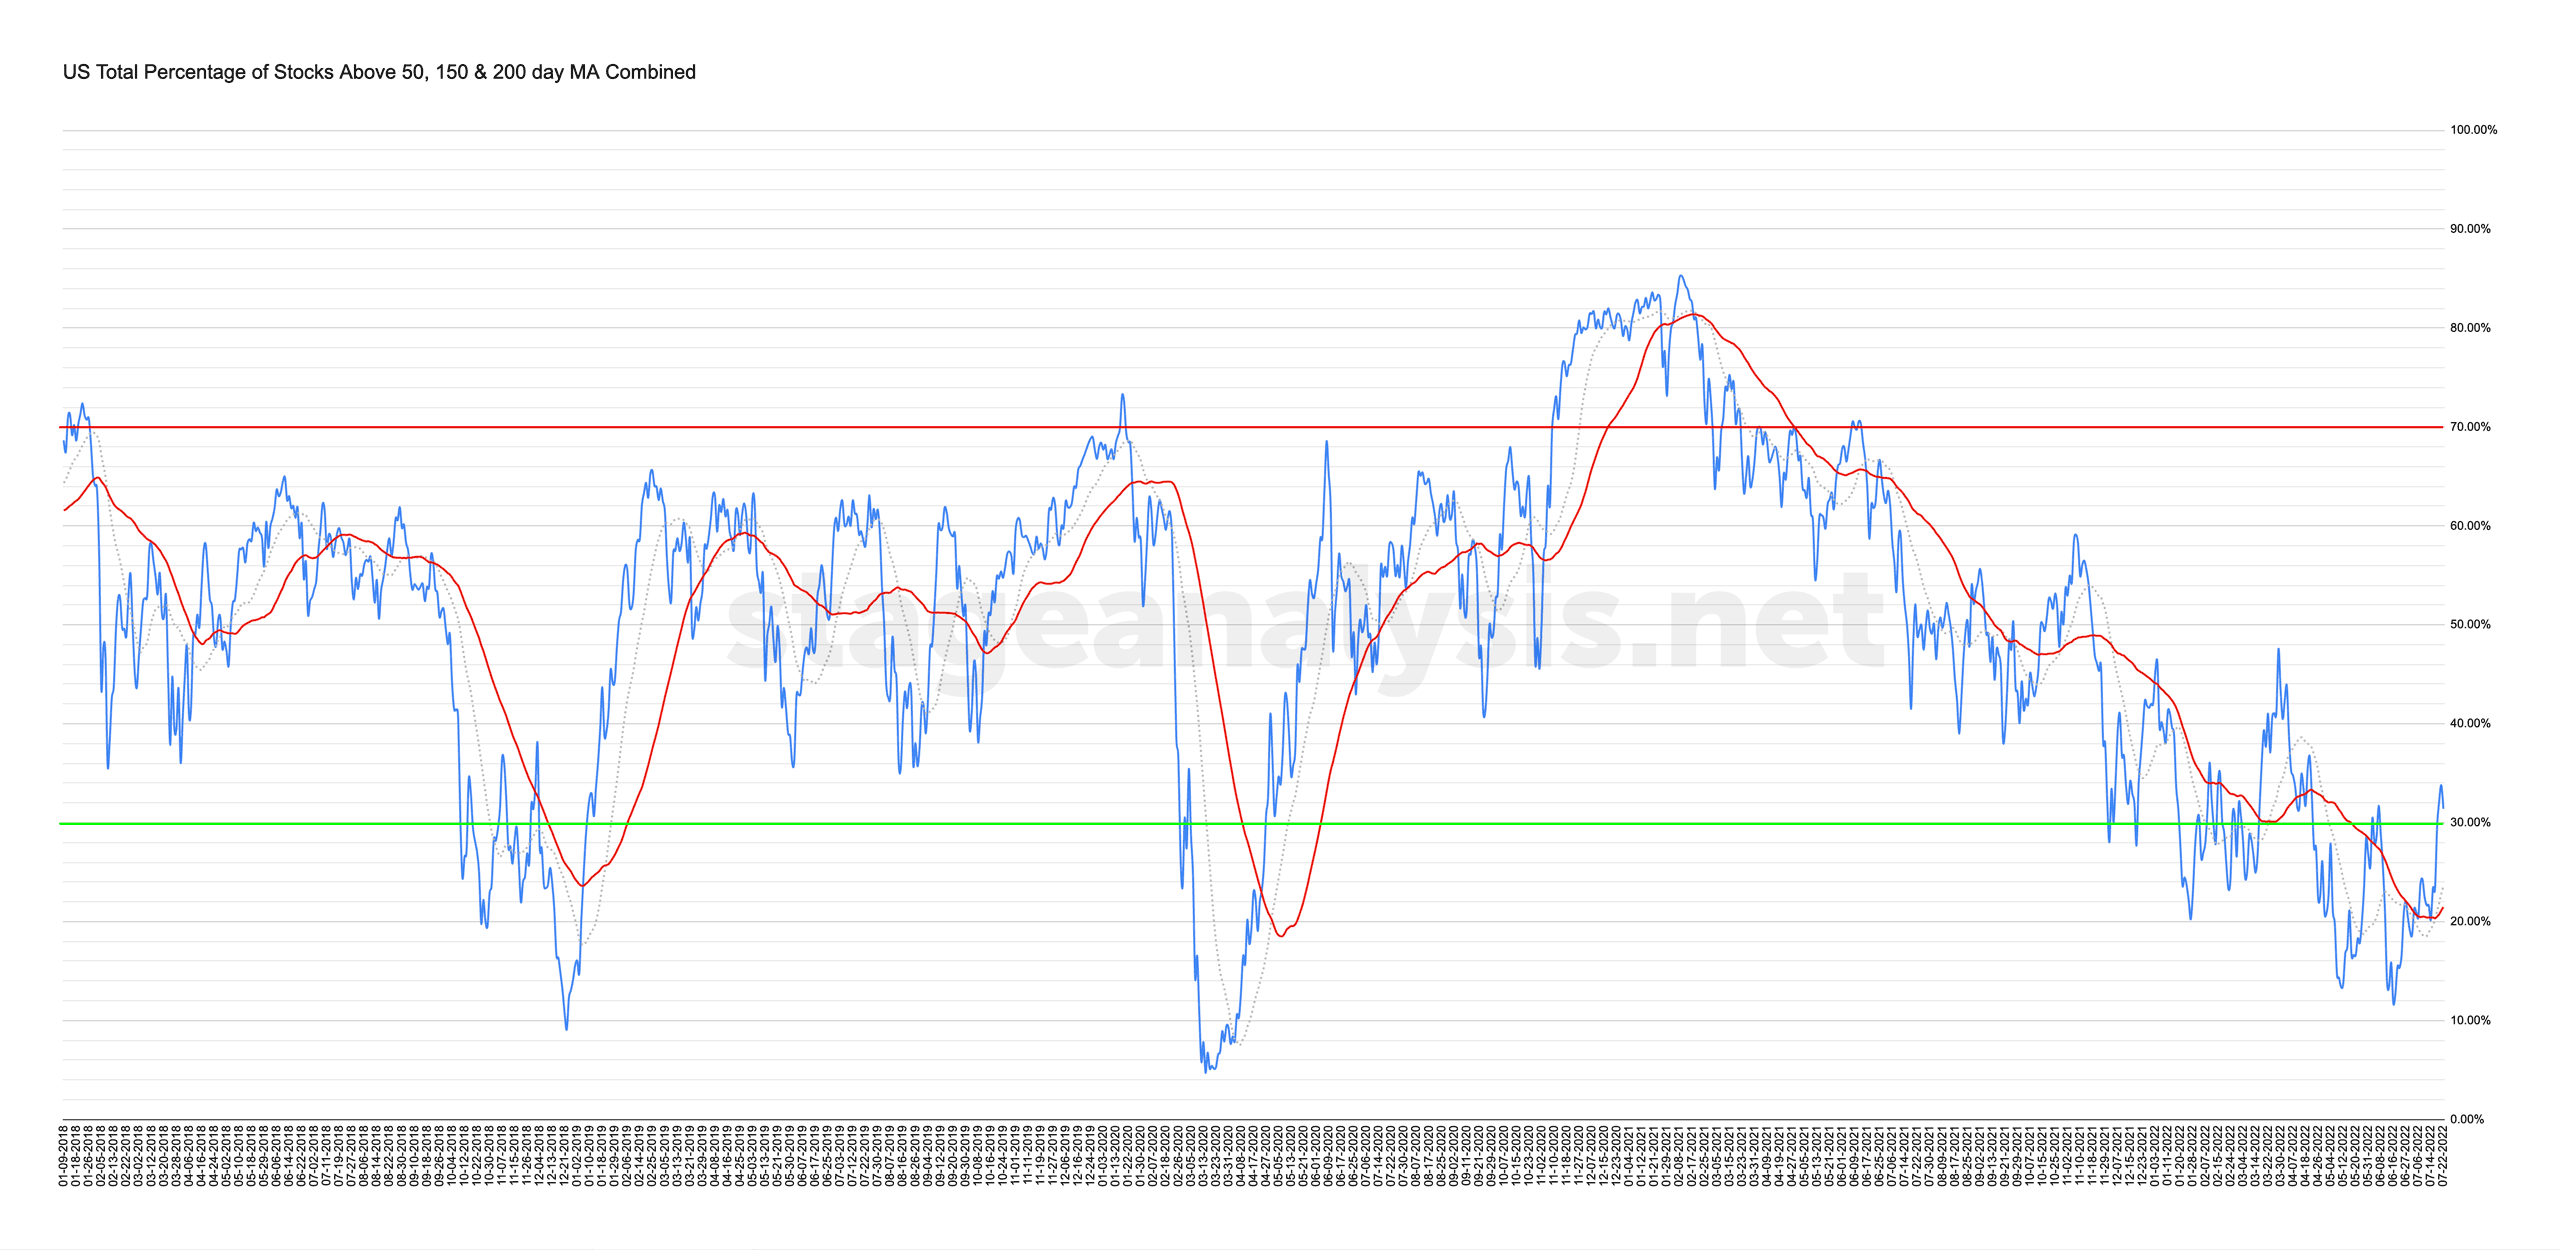
The US Total Percentage of Stocks Above their 50 Day, 150 Day & 200 Day Moving Averages had a strong week, closing +8.03% higher than the previous week, and +9.94% above its own 50 day MA, which caused a double top breakout on Wednesday above the previous nearest high (31.71% from the 7th June), and then closed out the week slightly lower at 31.40%.
So a potential breadth thrust, and strength that hasn't been seen since the March short-term counter-trend rally, with the combined average managing to move more than +10% above its own 50 day MA.
Hence, the status has made a further incremental change, with the neutral part being dropped, and so it is now on a Tentative Positive Environment, with emphasis still on the tentative part, as at just over 30%, it still remains in the Stage 4 zone (below 40%), and so the rally attempt should be considered guilty until proven innocent, until there is further confirmation, via a continued expanding breadth trend that can hold above the 50 day MA on the above chart.
With the continued incremental improvements in the combined moving average breadth, the focus at this stage continues to be looking for signs of any emerging group themes with early leaders in stocks in either late Stage 1 / early Stage 2. So that we can track them and then be ready if they move into potential entry zones in the method/s – which is Phase C to D in late Stage 1 or the early Stage 2 entry points at the Stage 2 breakout or initial Backup (BU) to test the breakout validity.
I'll discuss all of the combined moving average breadth charts from the full post in detail during the Stage Analysis Members weekend video – which is scheduled for later on Sunday afternoon EST.
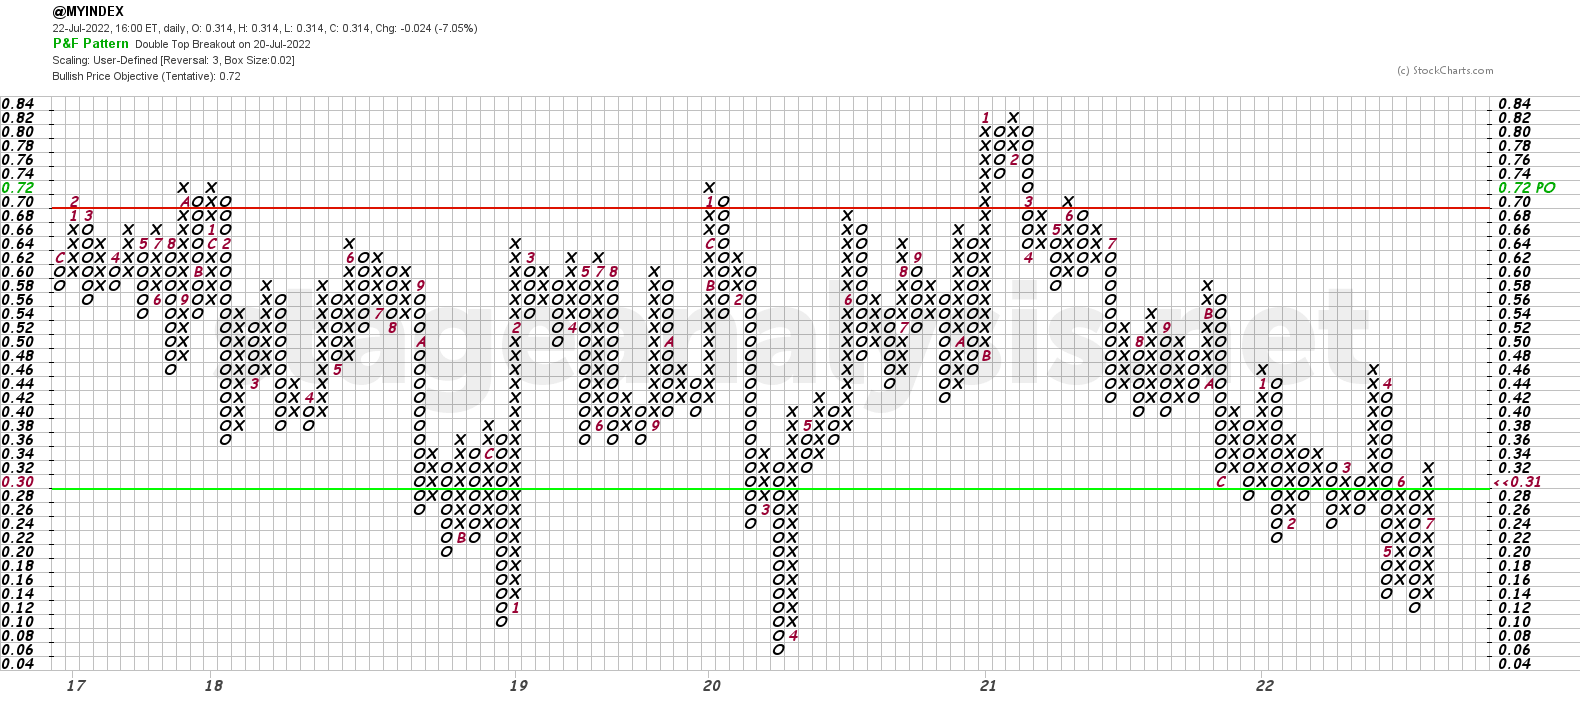
The Point and Figure chart added a further 4 Xs to its current column this week. Making a double top breakout on Wednesday above the 32% level that I've mentioned in previous posts, and hence changed status from Bull Alert to Bull Confirmed status. Which is the first time it's managed it since March, and with a prolonged visit to the lower zone, it's considered one of the strongest points on the chart to generate the Bull Confirmed P&F signal. Although, that doesn't mean it can't still fail. But, it should definitely make you start to look for developing areas of strength to track, to see if they are forming constructive setups from strong bases, and how early leaders are behaving.
To learn more about the different Point & Figure statuses that are used with examples. View the article on the Bullish Percent Index
Become a Stage Analysis Member:
To see more like this – US Stocks watchlist posts, detailed videos each weekend, use our unique Stage Analysis tools, such as the US Stocks & ETFs Screener, Charts, Market Breadth, Group Relative Strength and more...
Join Today
Disclaimer: For educational purpose only. Not investment advice. Seek professional advice from a financial advisor before making any investing decisions.