
Market Breadth: Percentage of Stocks Above their 50 Day, 150 Day & 200 Day Moving Averages Combined
The full post is available to view by members only. For immediate access:
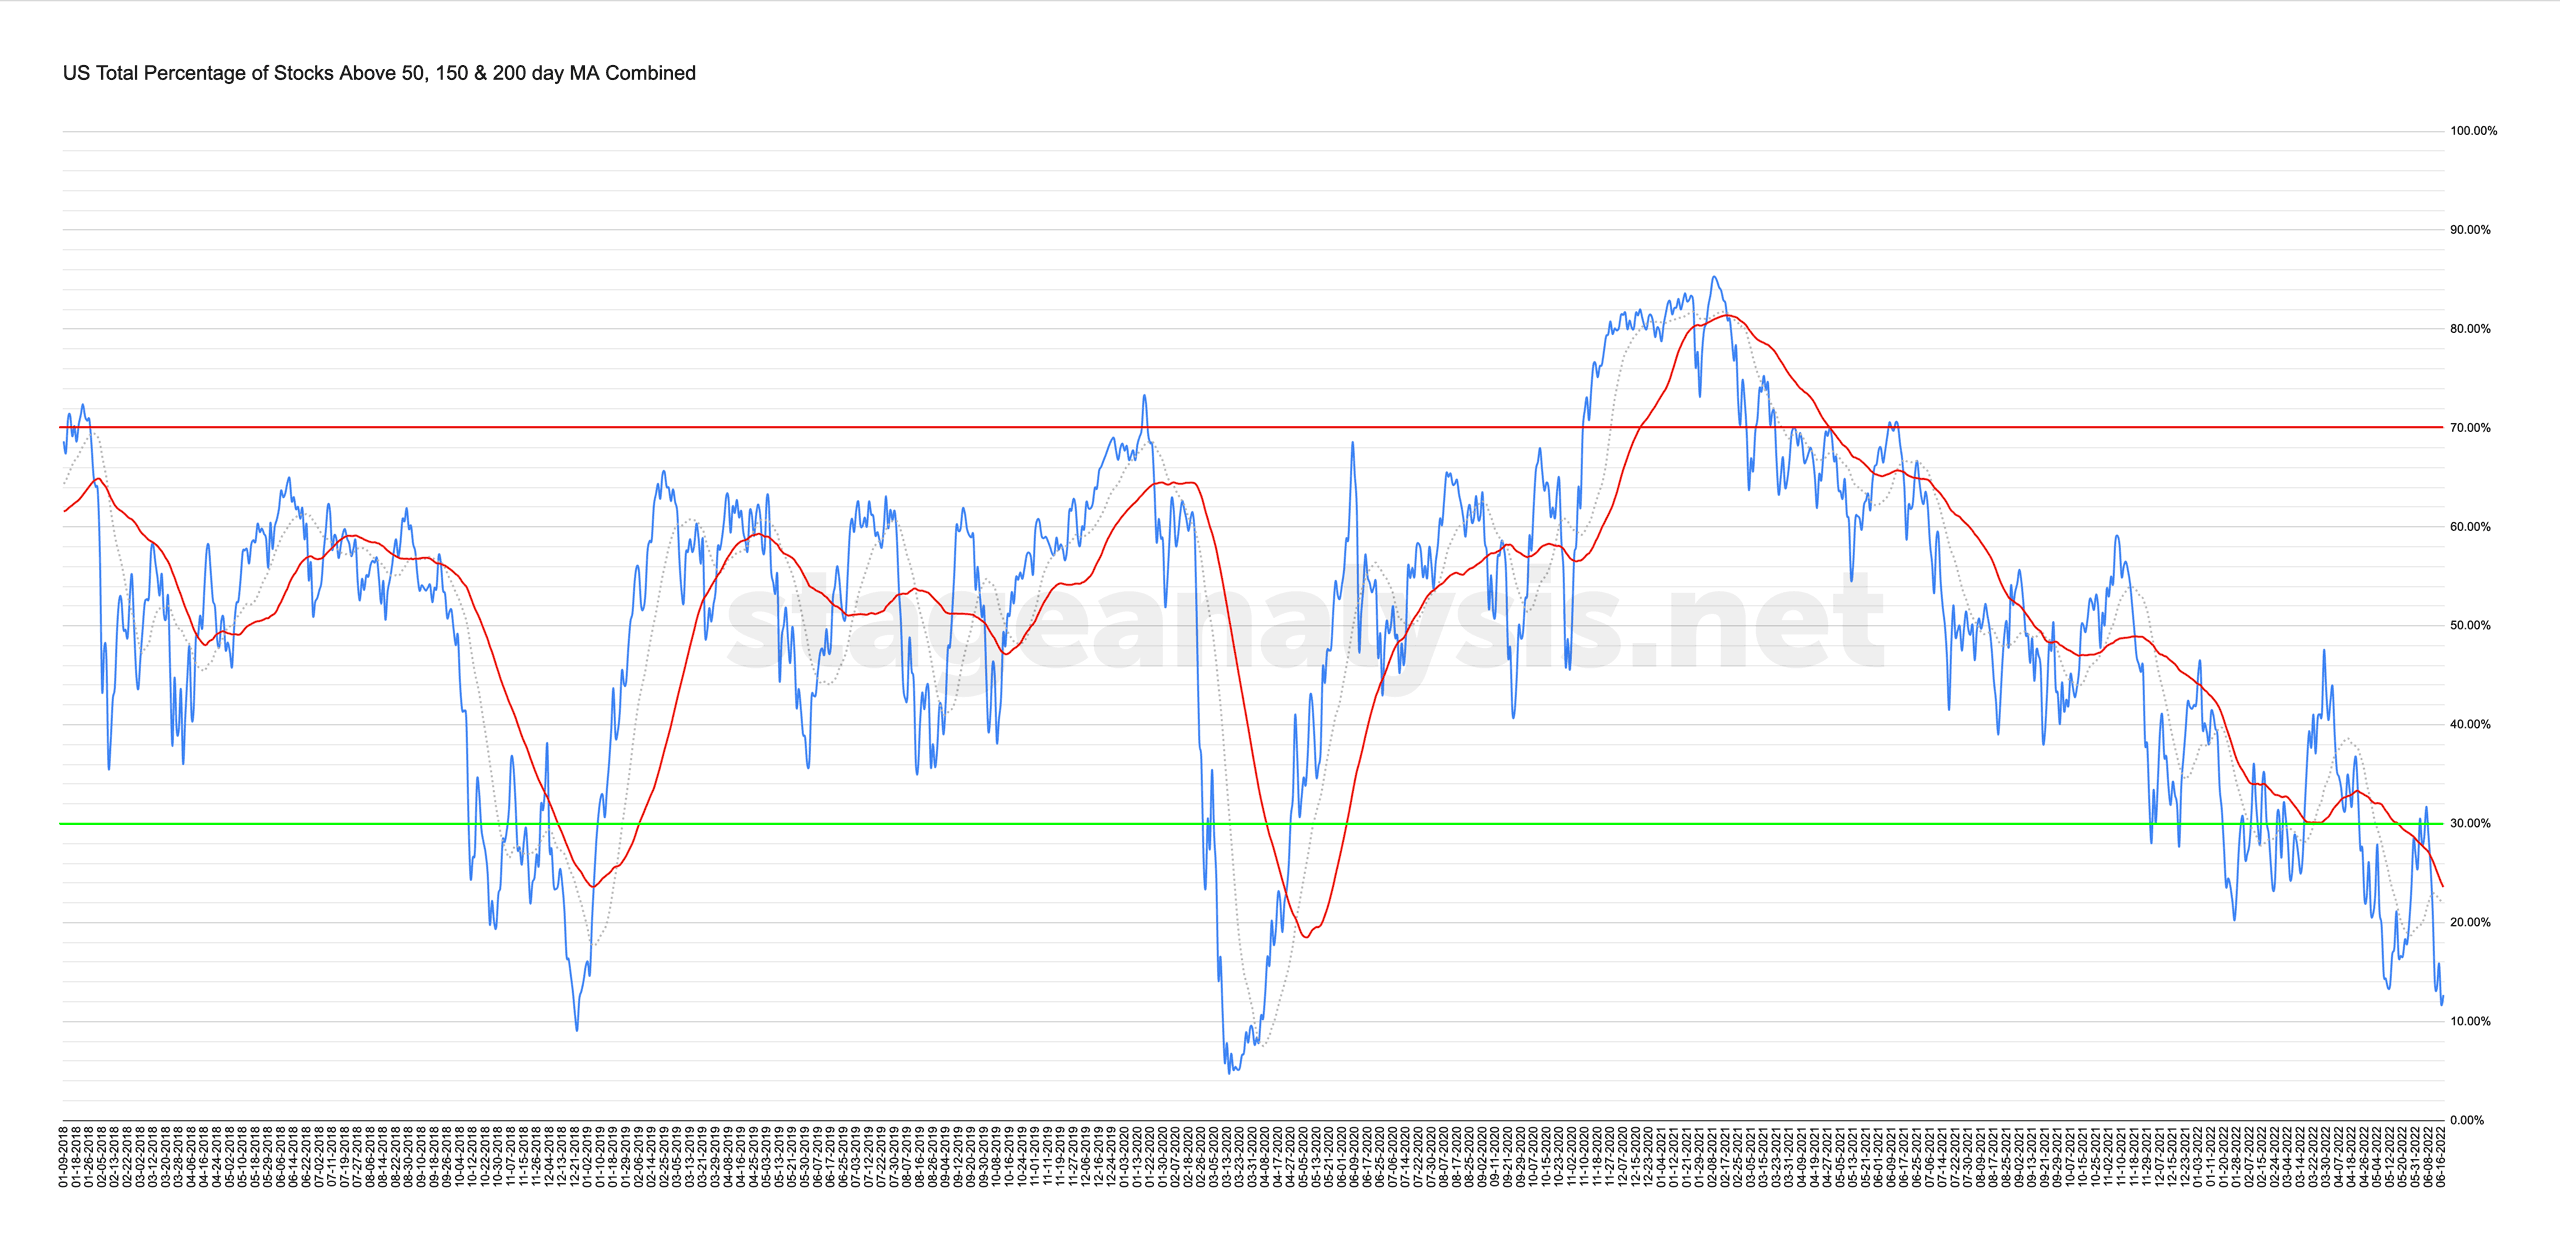
12.68% (-8.44% 1wk)
Status: Very Difficult Environment in Stage 4 zone
The US Total Percentage of Stocks Above their 50 Day, 150 Day & 200 Day Moving Averages Combined chart declined a further -8.44% this week to close at 12.68%, which is its lowest level of the year and also since the last Stage 4 decline in March 2020, and is now approaching the equivalent levels of the 2018 Stage 4 decline lows from late December 2018.
So it remains on Very Difficult Environment status for another week in the Stage 4 zone.
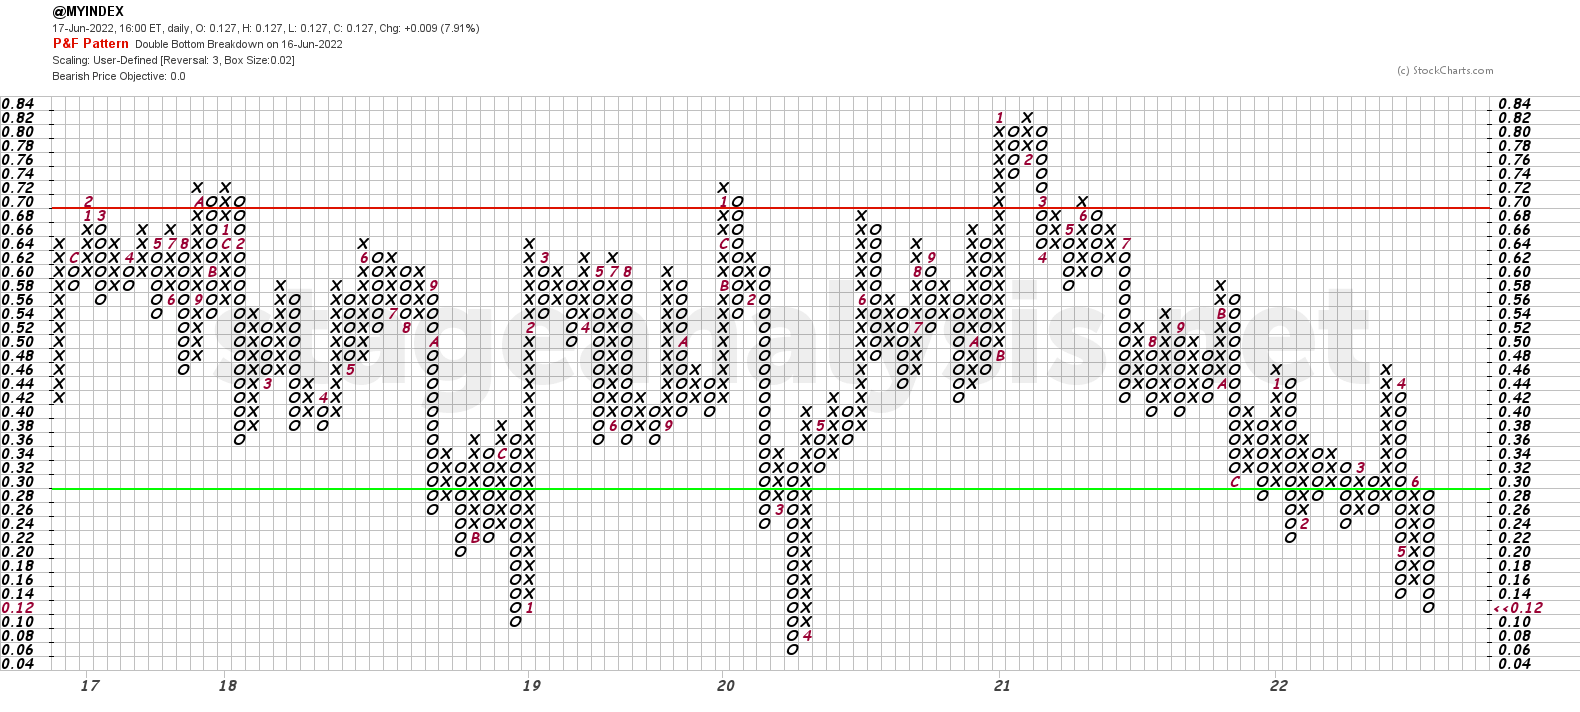
The Point and Figure chart continued to decline in the same column of Os, adding a further 5 boxes of Os to the column. Which now means it needs to move another +20% to revert back to Bull Confirmed status again. But a reversal back above the 18% level from the current point would trigger the next Bull Alert if it doesn't add any further Os to the current column.
Current status: Bear Confirmed
To learn more about the P&F statuses and how they are used read the Bullish Percent article.
Become a Stage Analysis Member:
To see more like this – US Stocks watchlist posts, detailed videos each weekend, use our unique Stage Analysis tools, such as the US Stocks & ETFs Screener, Charts, Market Breadth, Group Relative Strength and more...
Join Today
Disclaimer: For educational purpose only. Not investment advice. Seek professional advice from a financial advisor before making any investing decisions.