
Stock Market Studies: How the Market Bottoms – 40 Years of Stage 4 Lows in the Nasdaq Composite
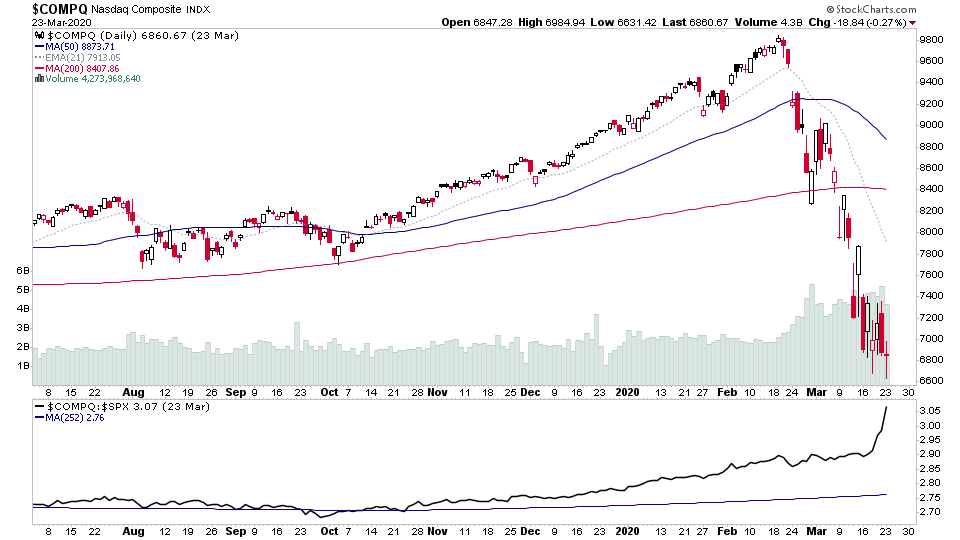
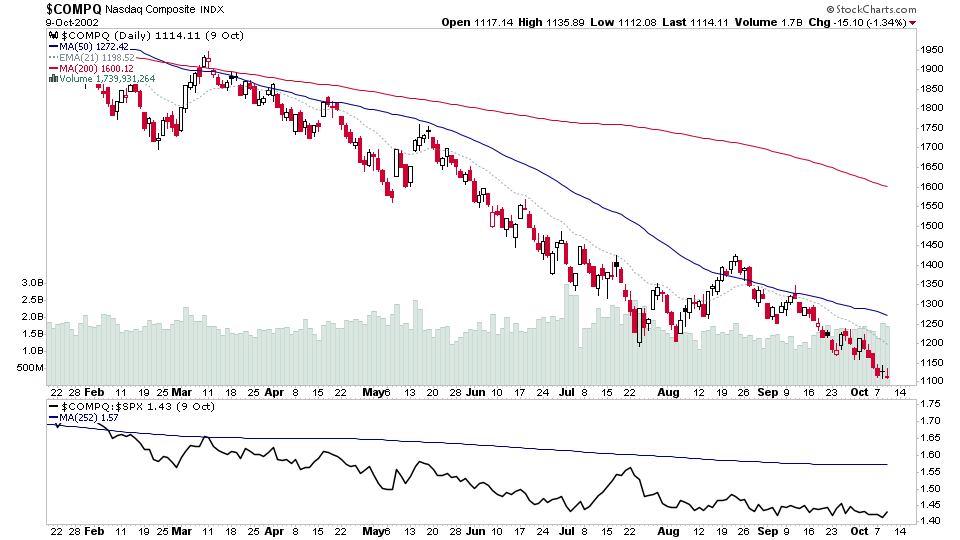
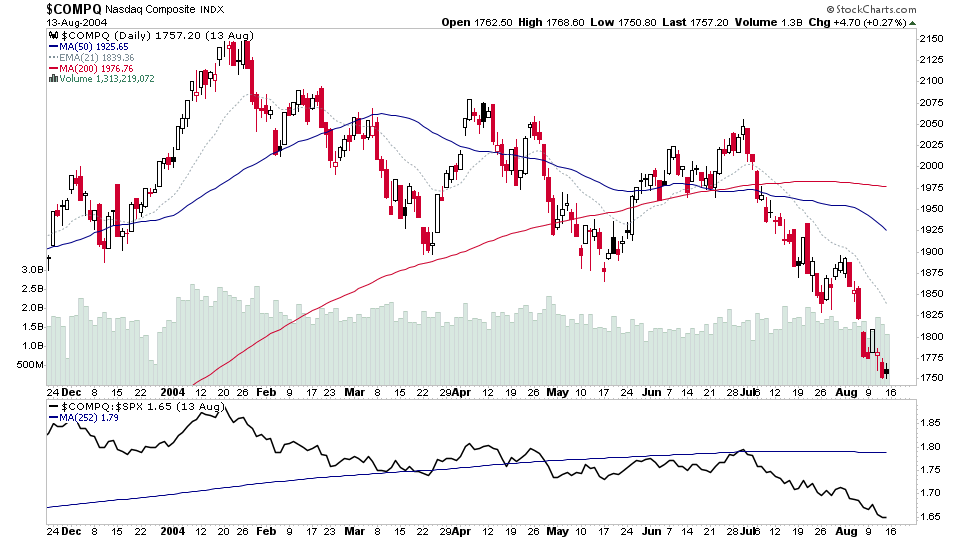
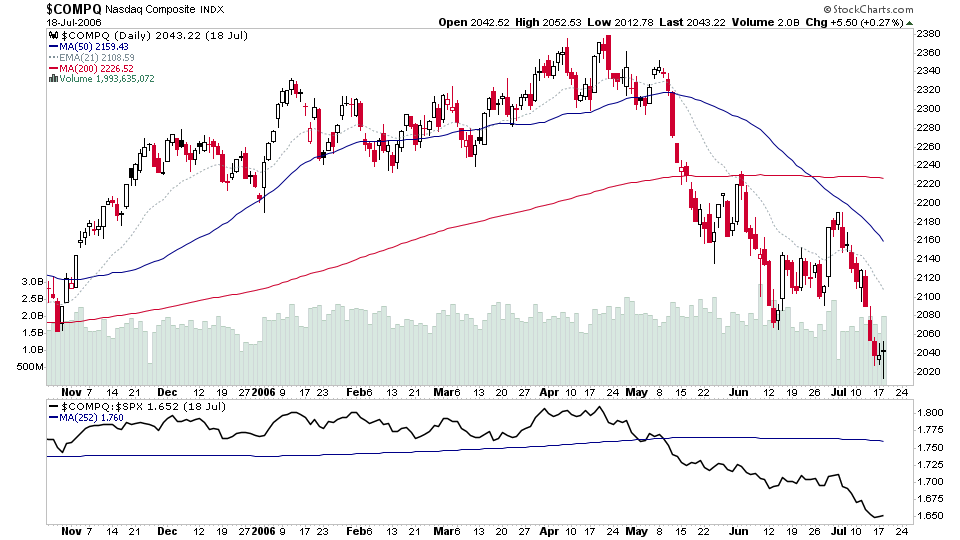
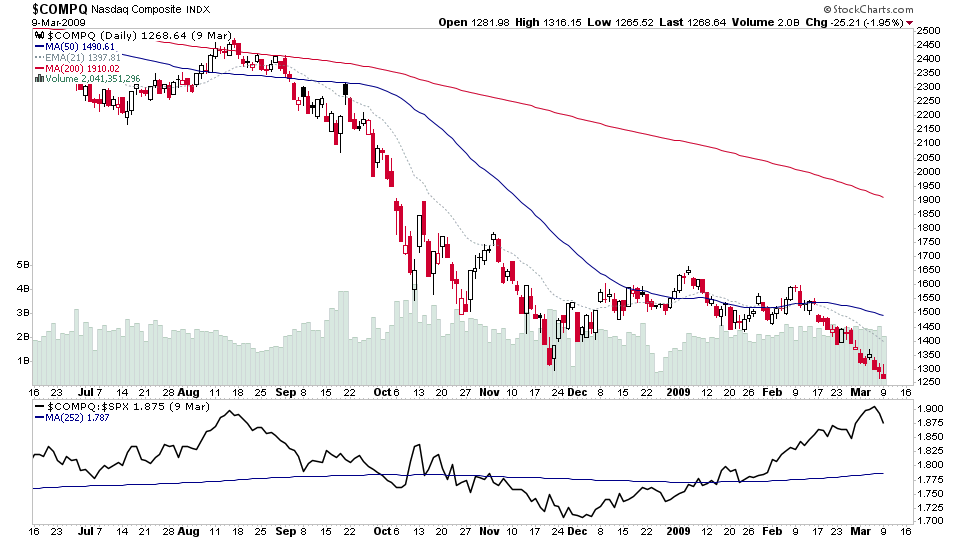
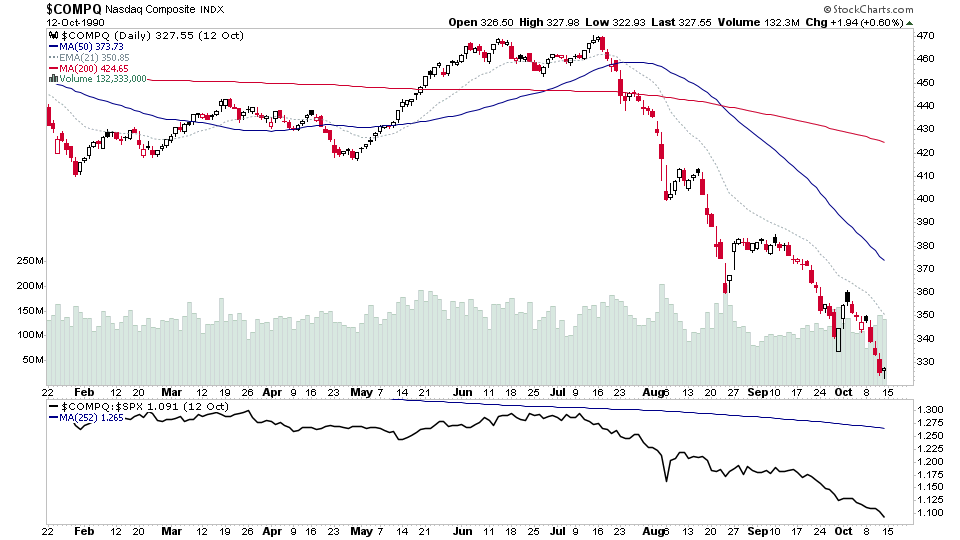
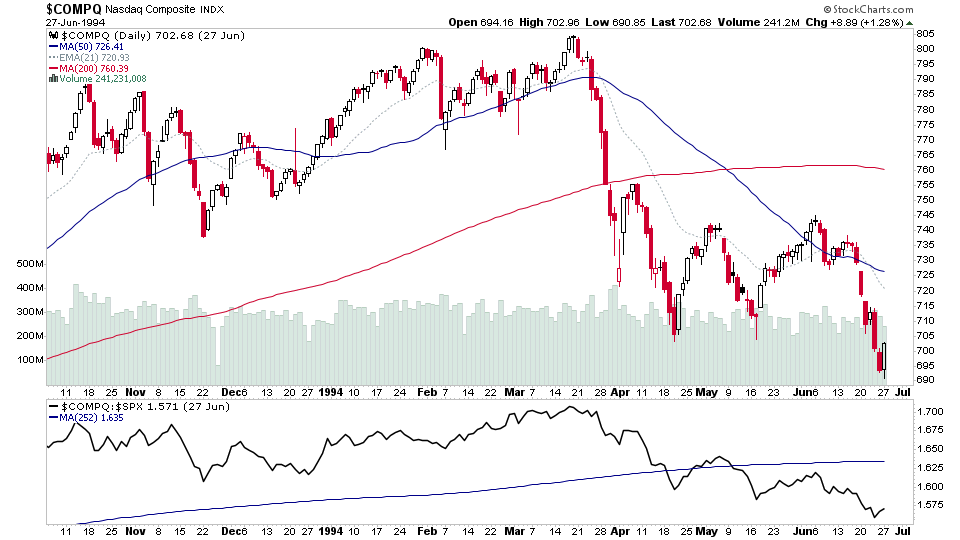
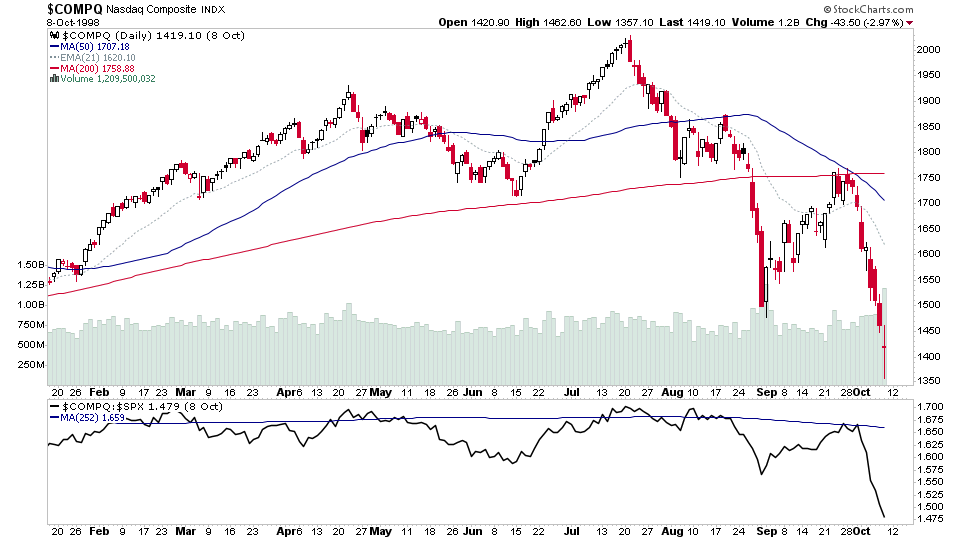
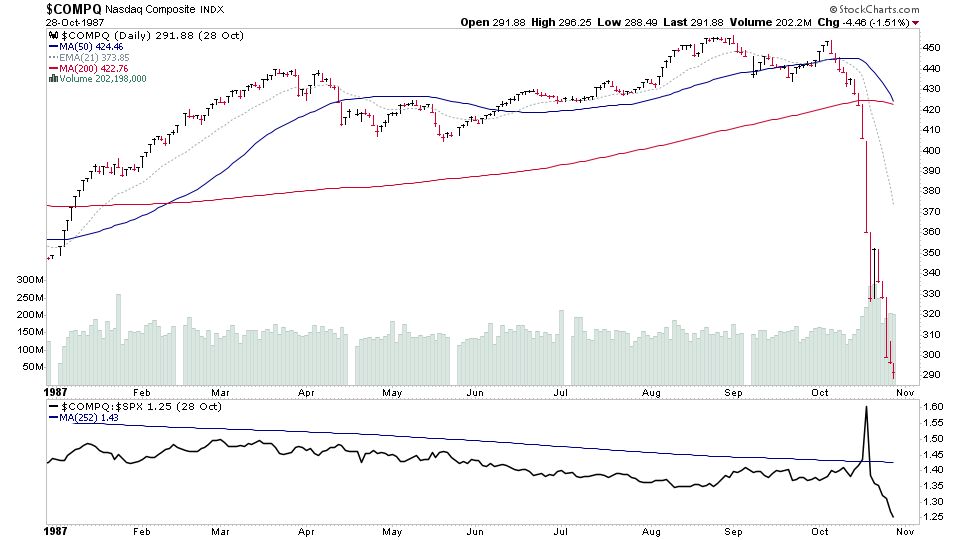
Continuing our study of significant bear markets (Stage 4 declines). I thought it would be interesting to look at a snapshot of all the major lows on the daily charts, without what happened next, to help remove any preconceptions of what we think a low should be with the actual data from the past Stage 4 lows. As many online and in the media suggest that we need to see capitulation before the bear market can end. But the charts say otherwise, as capitulation is not how most have ended, and that type of thinking suggests recency bias, which may be due to the rapid declines of the last two Stage 4 bear markets in 2020 and late 2018. So study the charts for yourself to help to remove any bias you may have.
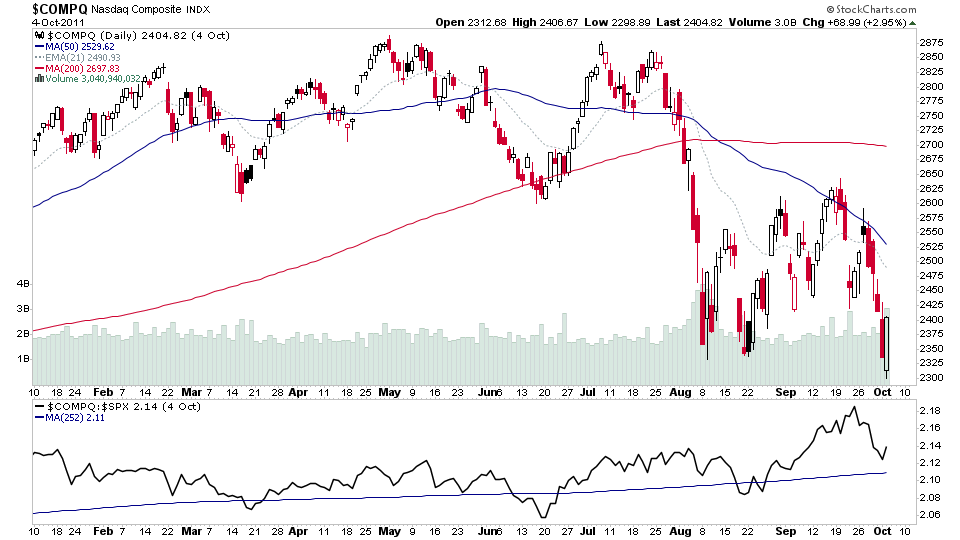
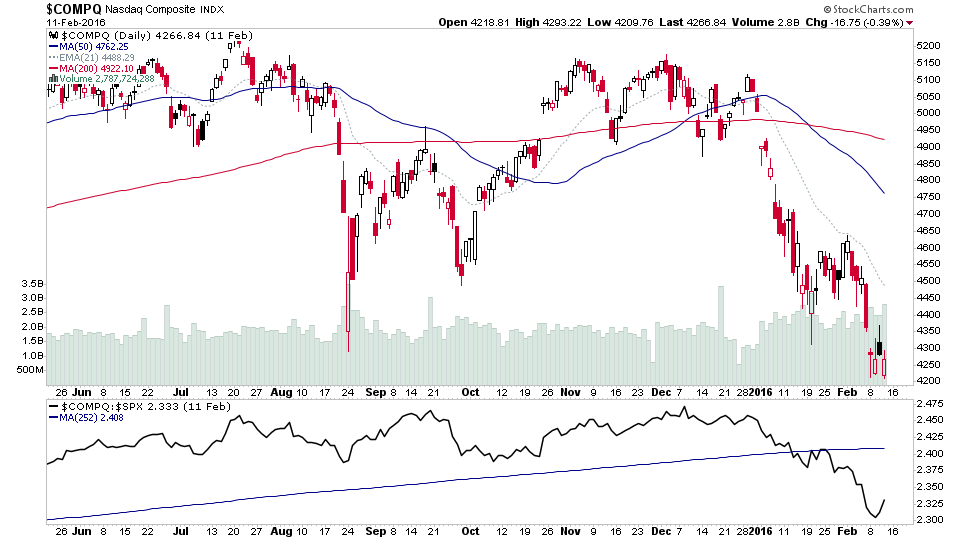
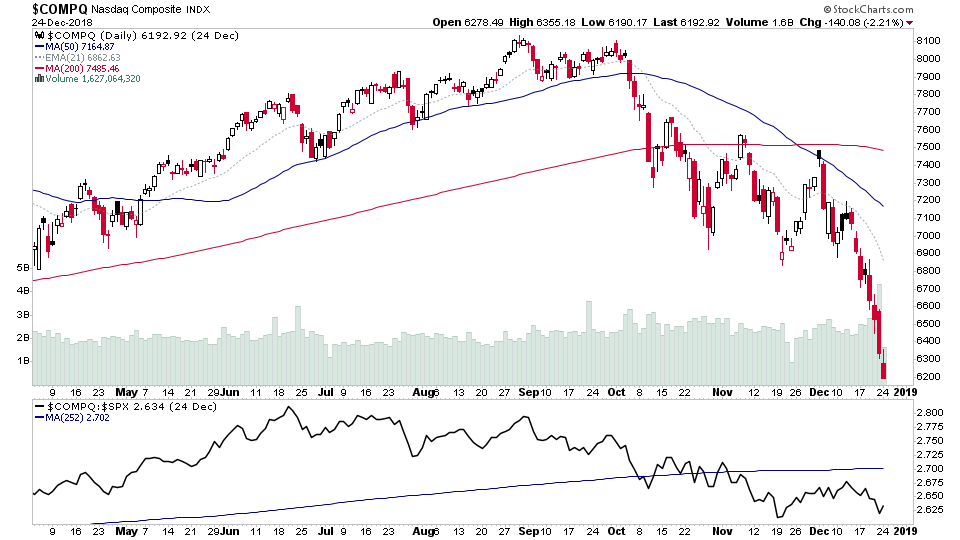
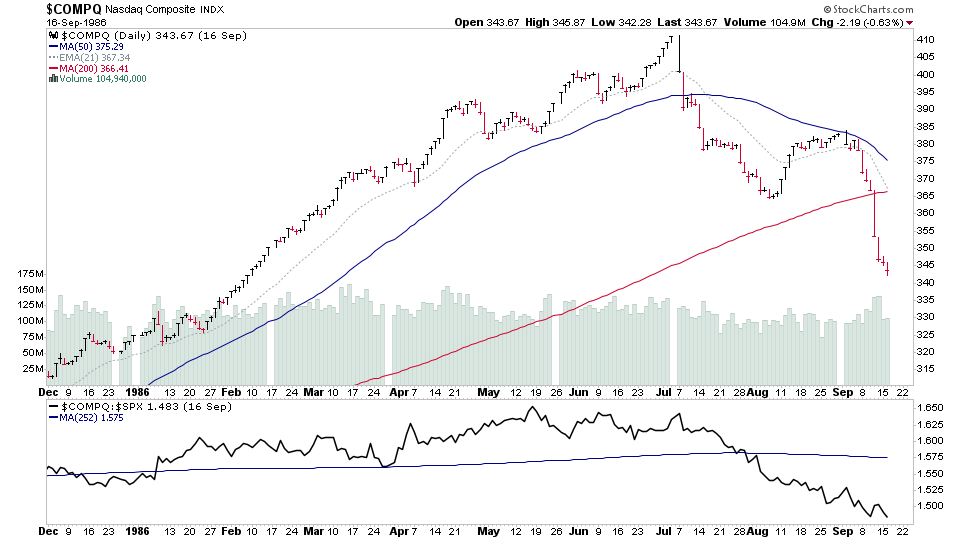
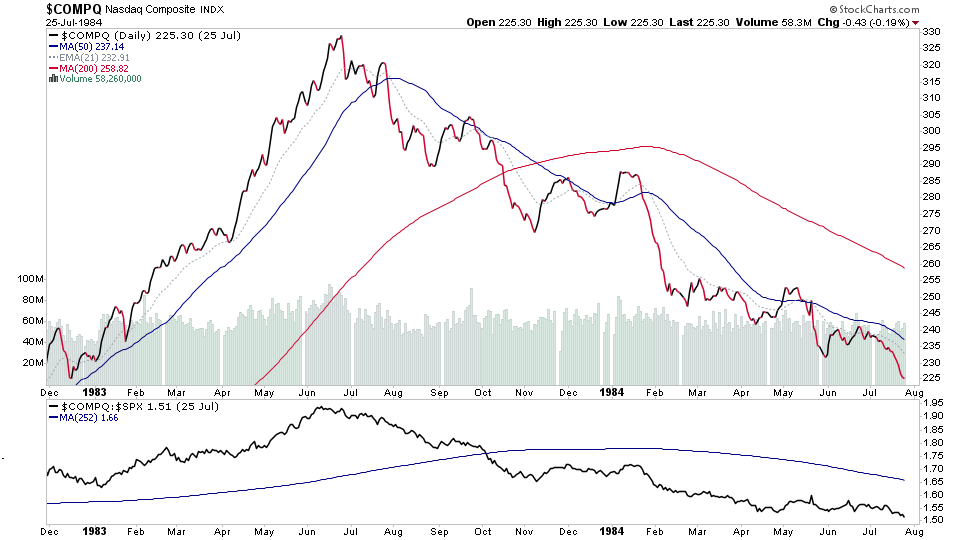
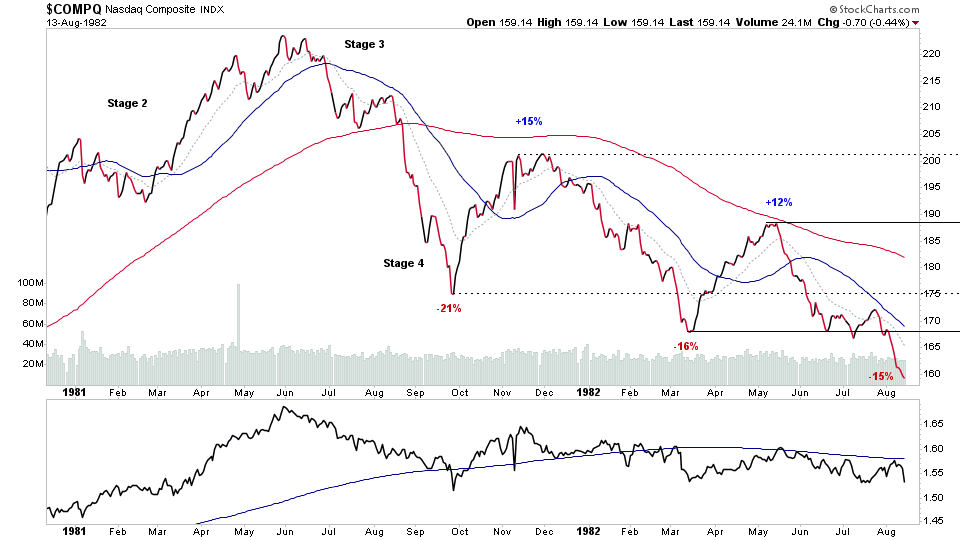
Below it the daily charts of the Nasdaq Composite from the last 40 years.
2020
2010-2019
2000-2009
1990-1999
1980-1989
Become a Stage Analysis Member:
To see more like this – US Stocks watchlist posts, detailed videos each weekend, use our unique Stage Analysis tools, such as the US Stocks & ETFs Screener, Charts, Market Breadth, Group Relative Strength and more...
Join Today
Disclaimer: For educational purpose only. Not investment advice. Seek professional advice from a financial advisor before making any investing decisions.