
US Stocks Industry Groups Relative Strength Rankings
The full post is available to view by members only. For immediate access:
US Industry Groups by Highest RS Score
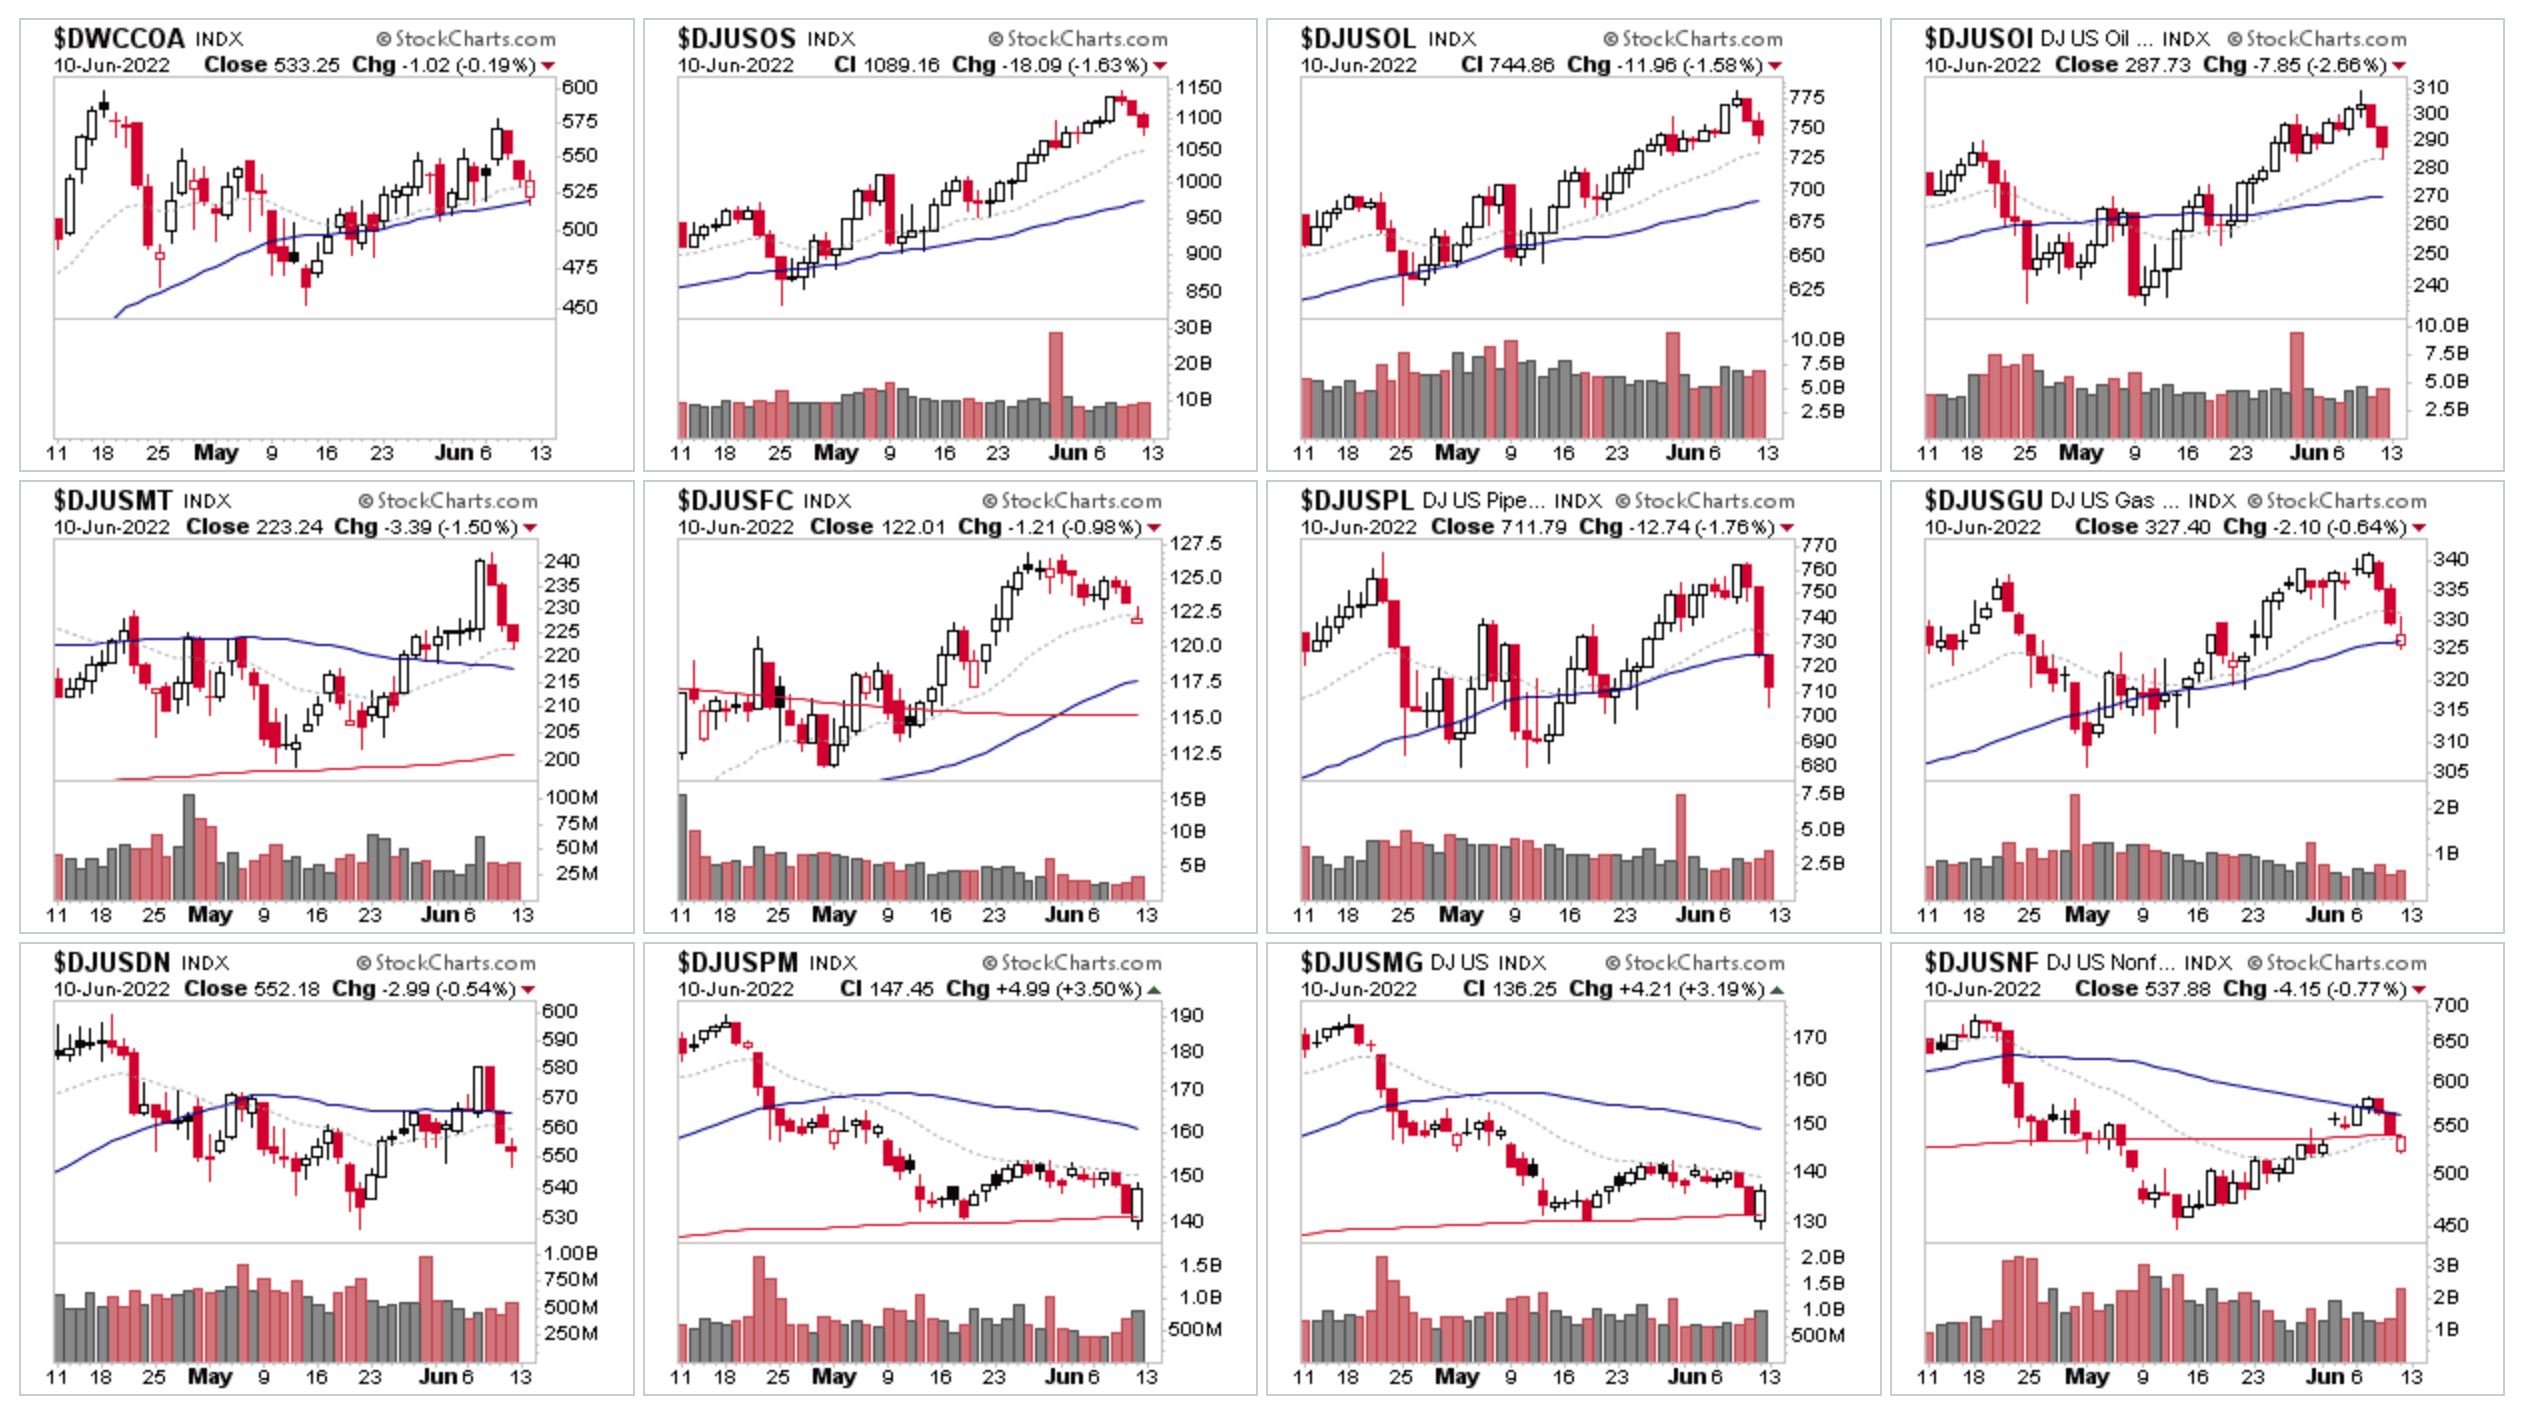
Above is the top 12 industry groups thumbnail charts by Relative Strength (RS) score, of which almost all saw declines this week, except for the leading group Coal, which managed to scrape a minor gain of 0.08%. Although most of the top groups declines were relatively smaller than the rest of the market. So they continued to show stronger RS for the most part.
Of note this week in the strong RS groups was Marine Transportation, which actually moved up by two places. But many of its leading Stage 2 stocks took heavy hits through the week, with a clear negative change of behaviour. So signs of early Stage 3 behaviour appearing in many in the group (see yesterdays post for examples)
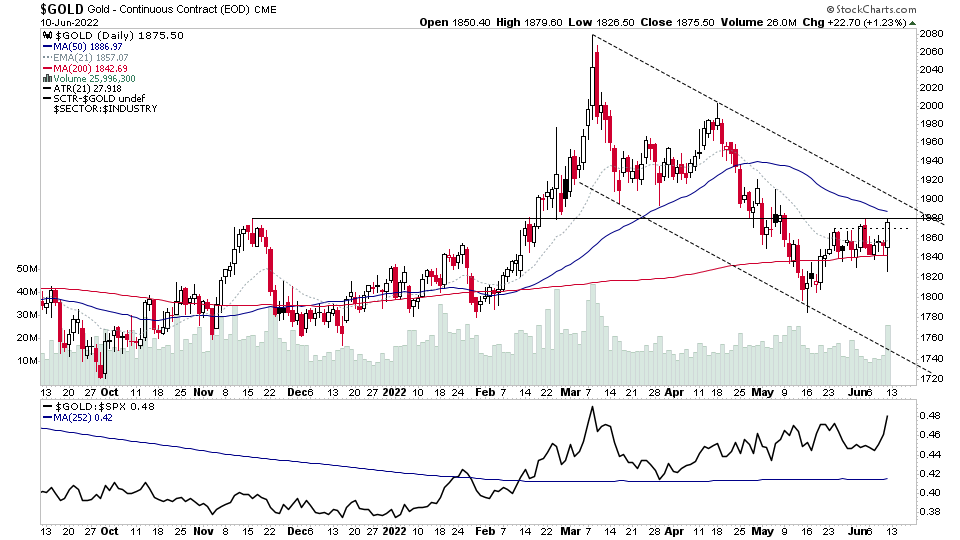
Another area that came back onto the radar today was the Gold Mining Group, moving up strongly to regain a place in the top 10 once more. I noted in the members twitter feed early in the day that there were multiple undercut and rally / spring type action moves appearing in the gold and silver miners. Which followed through strongly into the end of the day with a price bar in physical Gold that spanned the entire last three weeks of trading.
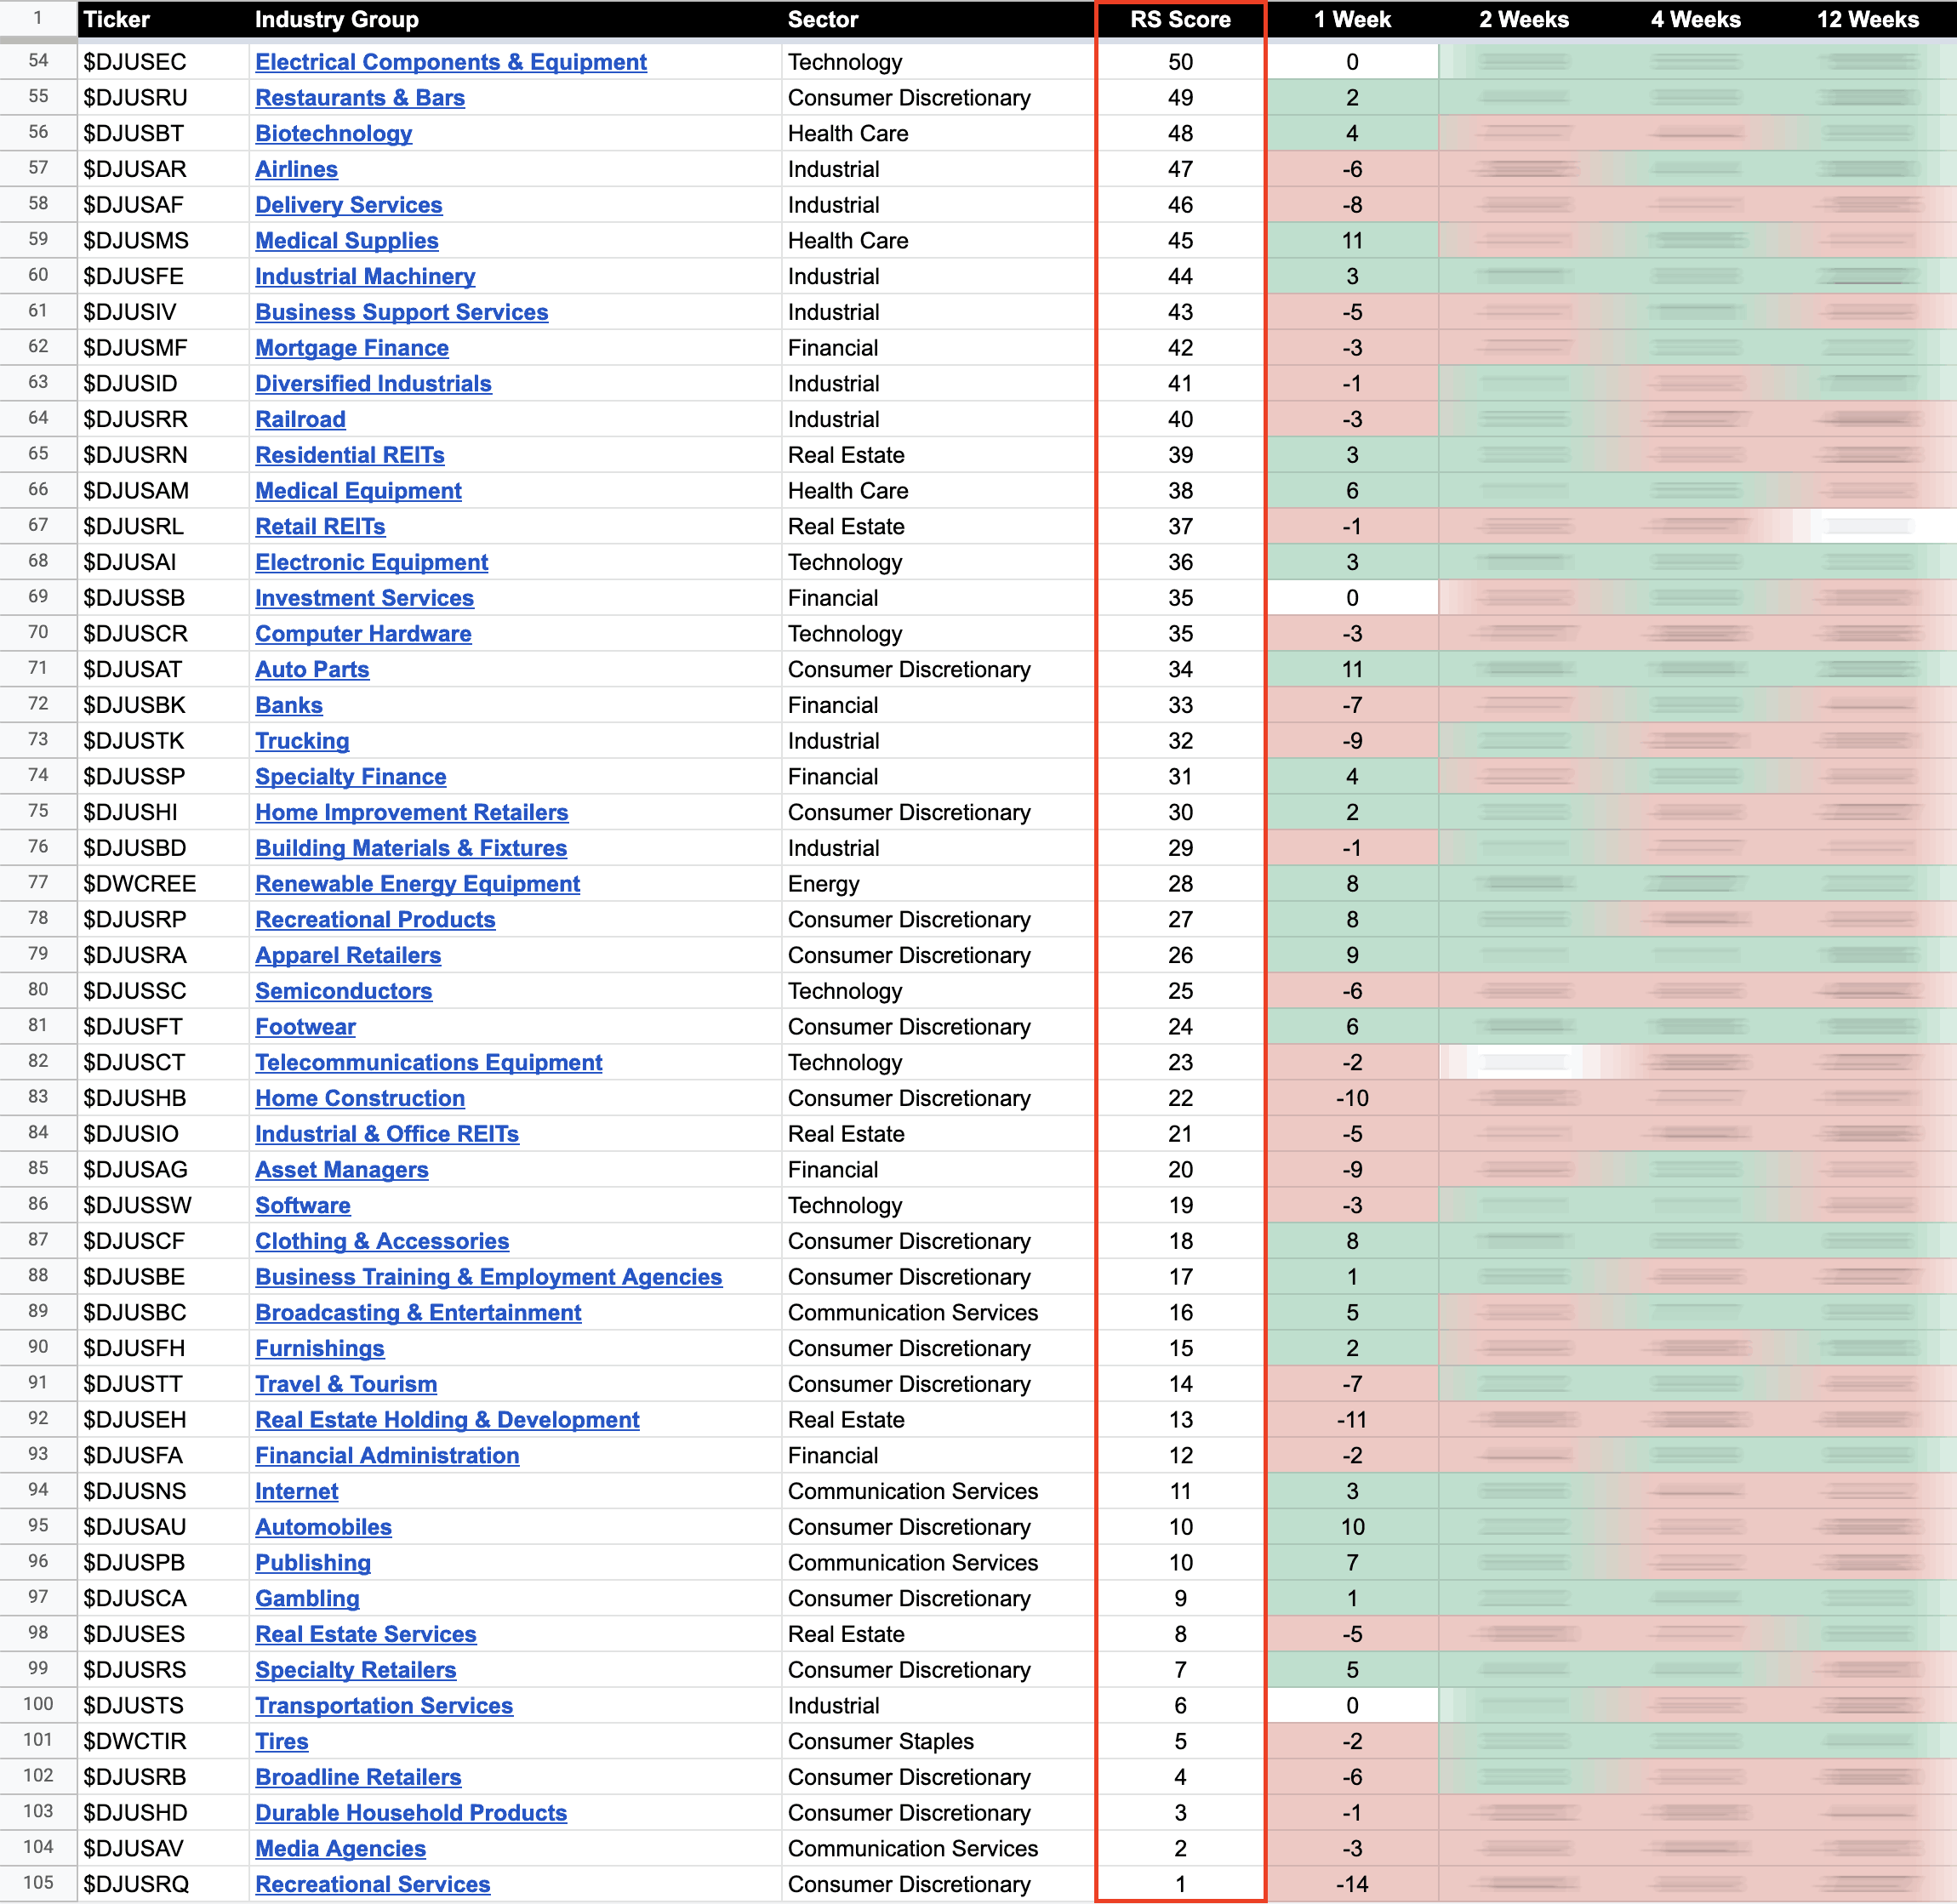
US Industry Groups by Weakest RS Score
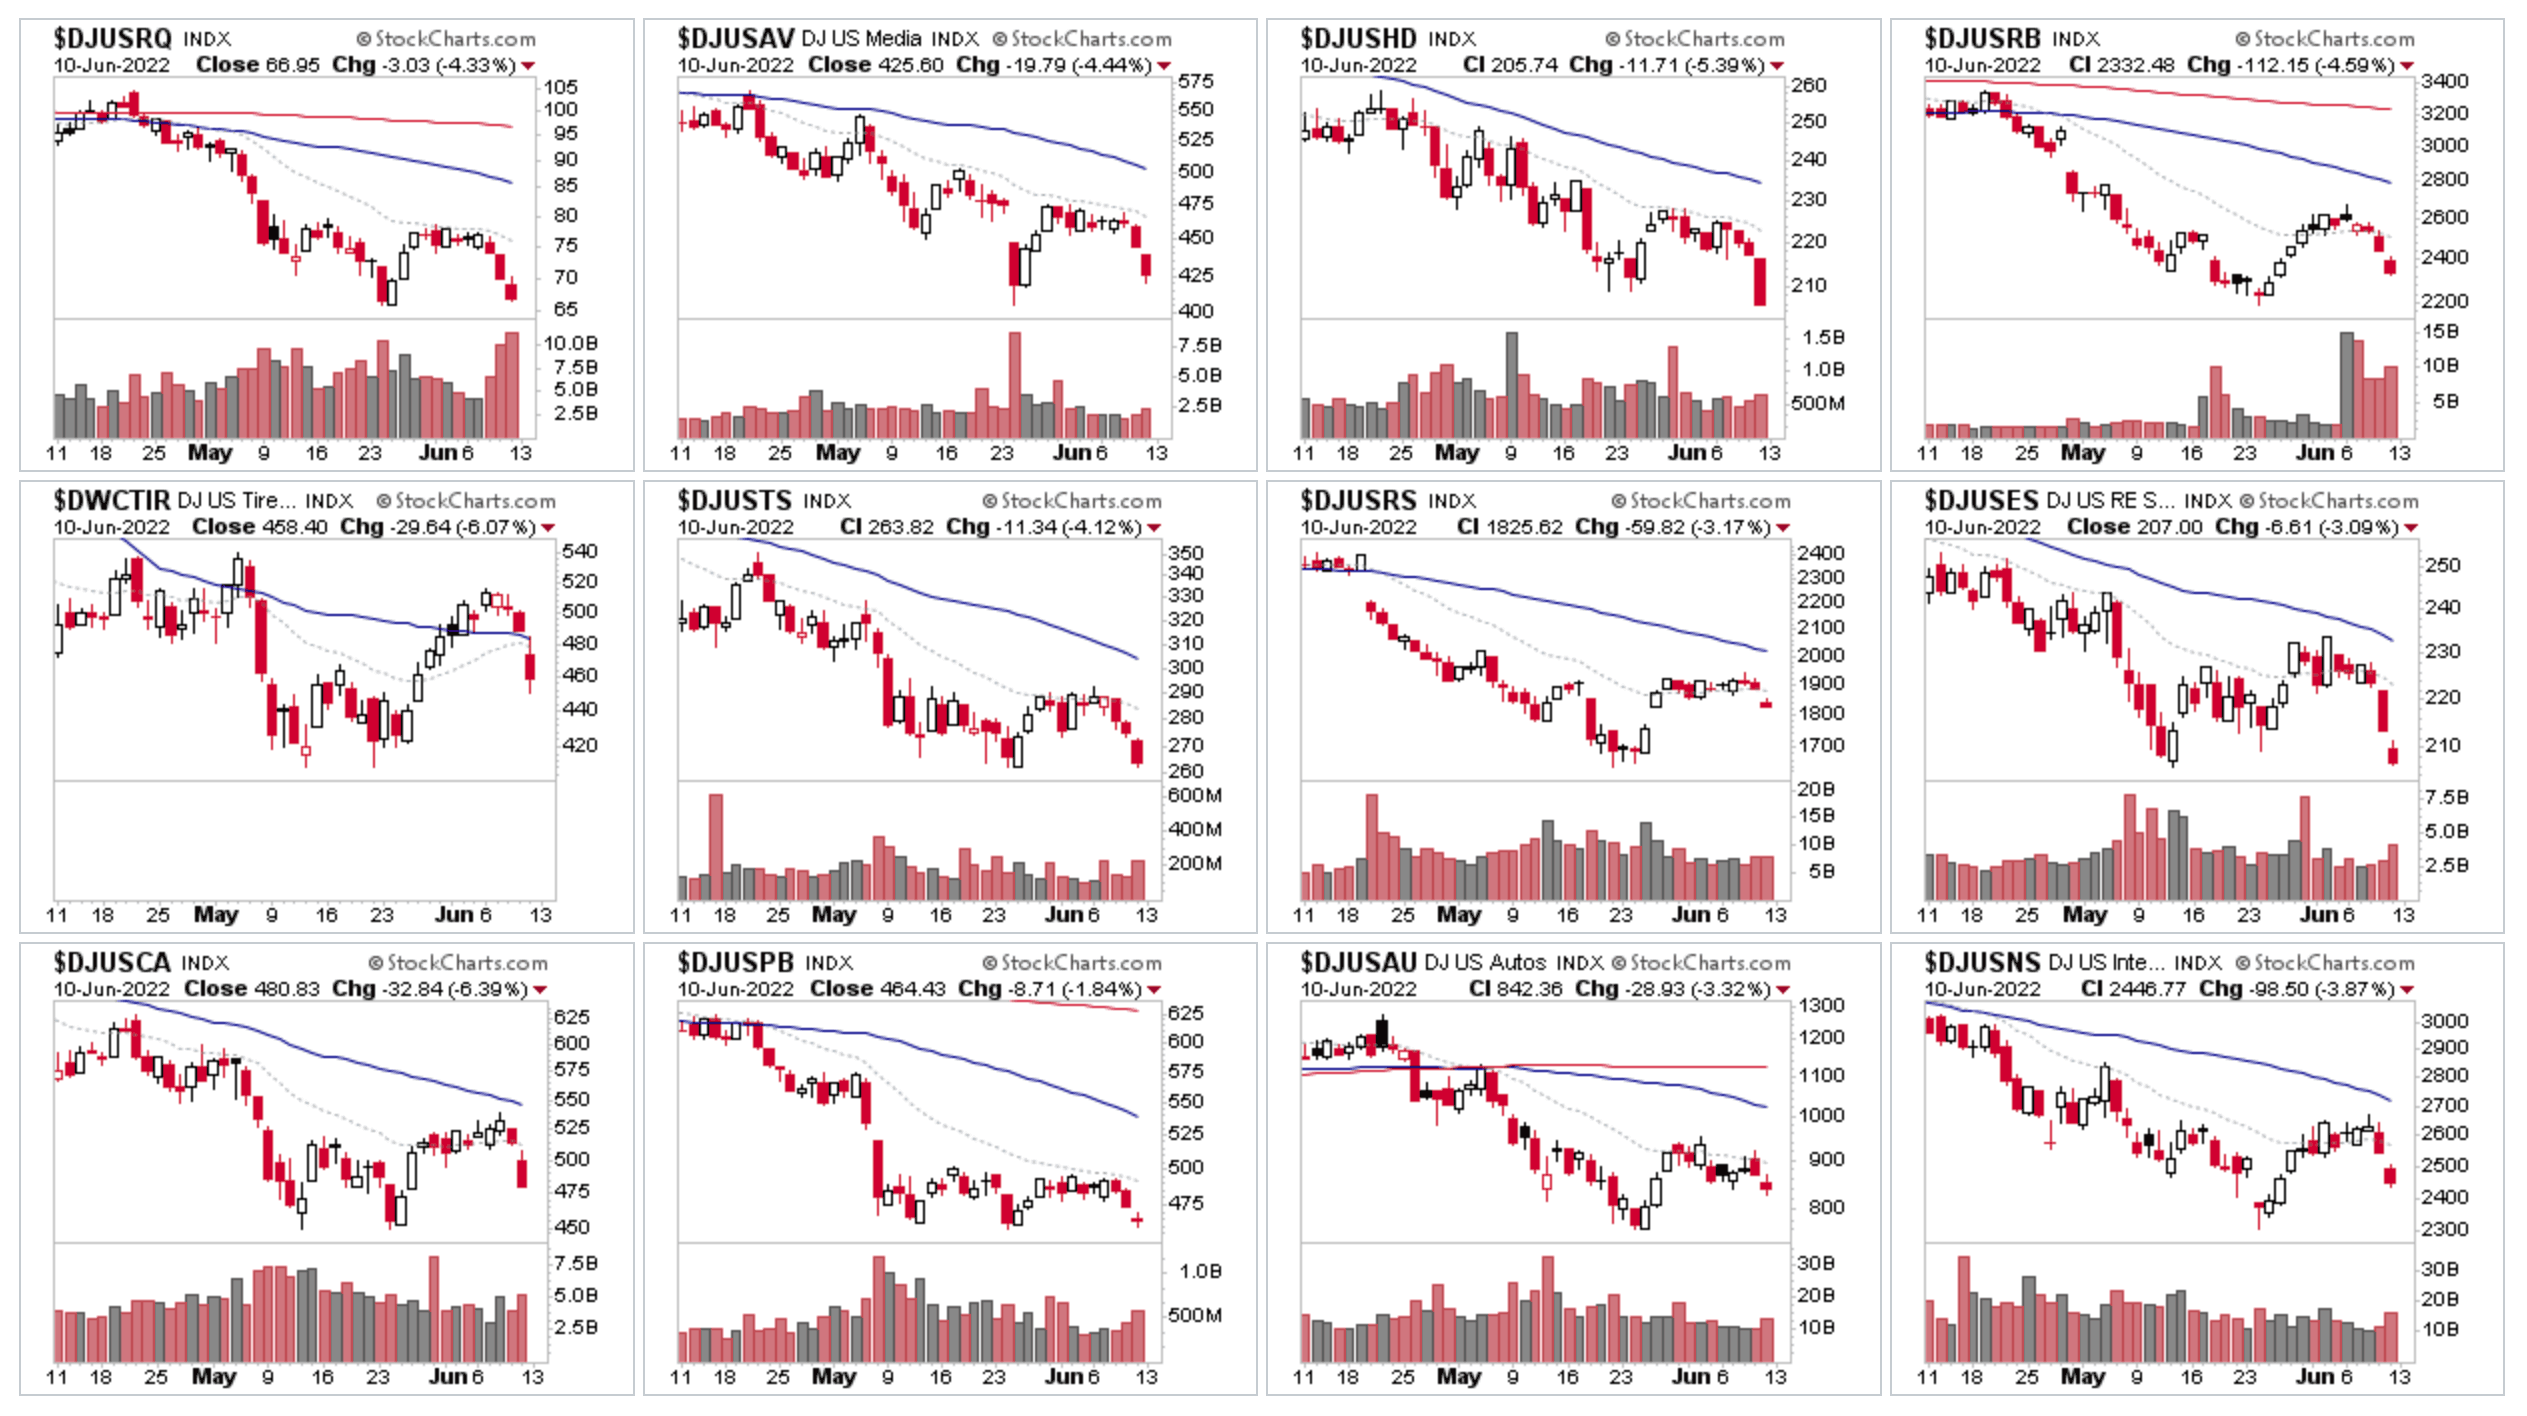
In the weakest RS groups there was some changes with Recreational Services dropping to the bottom of the RS table, and Consumer Discretionary groups now make up half of the bottom 12.
Of note was that although all the groups had strong declines. Only one of the bottom 12 actually closed at a new low – which was Durable Household Products, and so the majority remain within developing base structures in Stage 4.
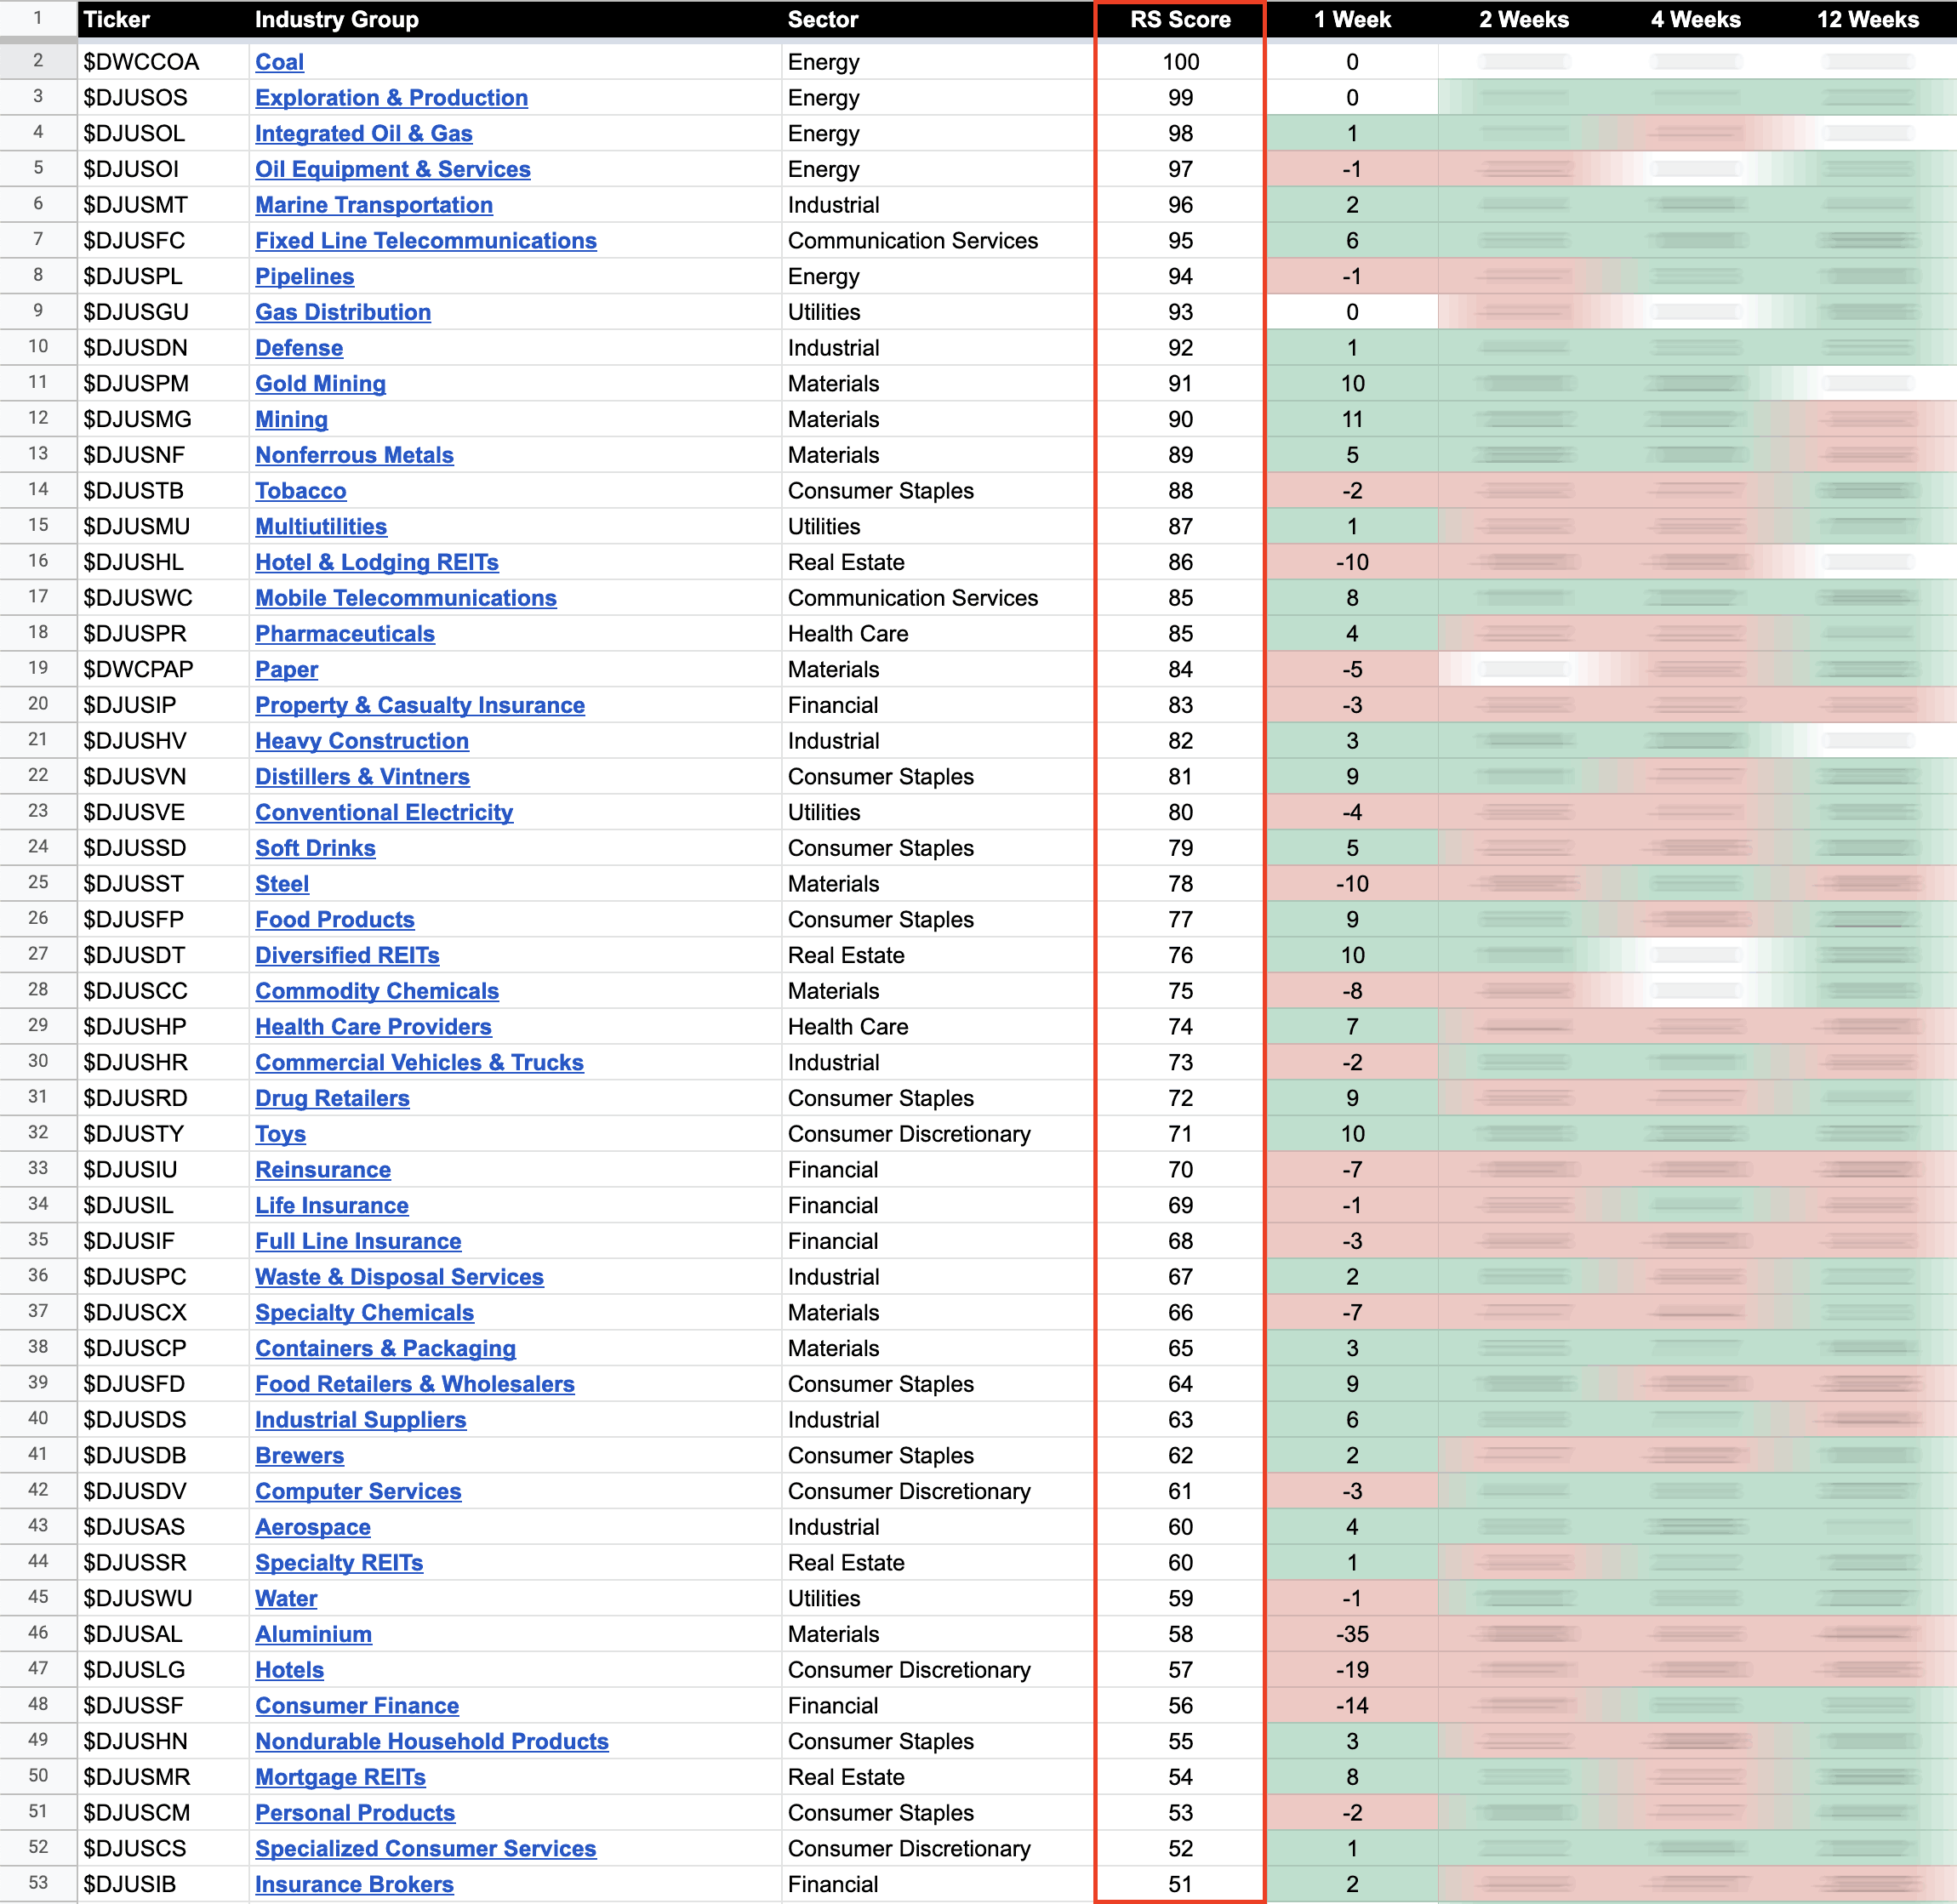
104 Dow Jones Industry Groups sorted by Relative Strength
The purpose of the Relative Strength (RS) tables is to track the short, medium and long term RS changes of the individual groups to find the new leadership earlier than the crowd.
RS Score of 100 is the strongest, and 0 is the weakest.
In the Stage Analysis method we are looking to focus on the strongest groups, as what is strong, tends to stay strong for a long time. But we also want to find the improving / up and coming groups that are starting to rise up strongly through the RS table from the lower zone, in order to find the future leading stocks before they breakout from a Stage 1 base and move into a Stage 2 advancing phase.
Each week I go through the most interesting groups on the move in more detail during the Stage Analysis Members weekend video – as Industry Group analysis is a key part of Stan Weinstein's Stage Analysis method.
Become a Stage Analysis Member:
To see more like this – US Stocks watchlist posts, detailed videos each weekend, use our unique Stage Analysis tools, such as the US Stocks & ETFs Screener, Charts, Market Breadth, Group Relative Strength and more...
Join Today
Disclaimer: For educational purpose only. Not investment advice. Seek professional advice from a financial advisor before making any investing decisions.