
Market Breadth Indicators Signal Weakness and Multiple Breakouts in the Gold & Silver Mining Sector
Quick Links:
- Timing the US Stock Market Using the Market Breadth Indicators – Introduction (0:00)
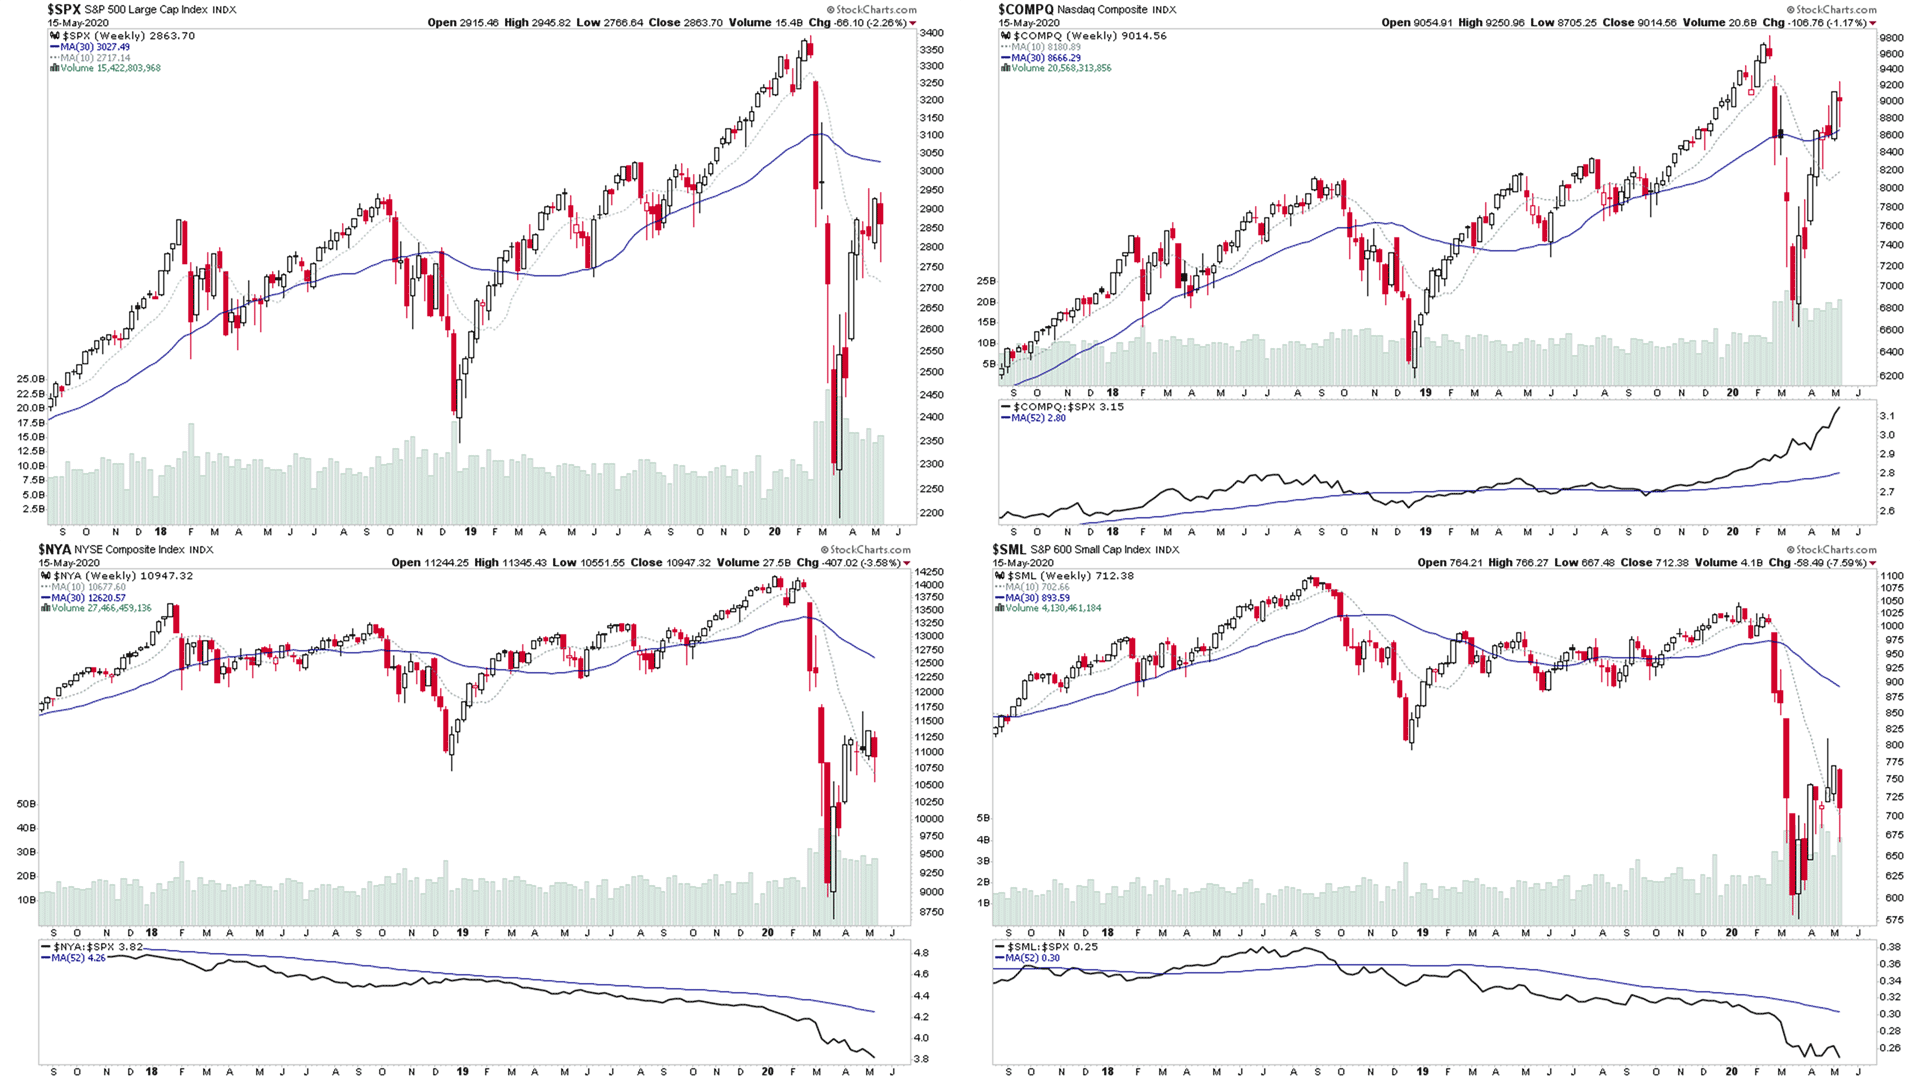
- Major Market Indexes – S&P 500, Nasdaq, NYSE & S&P 600 Small Caps (1:05)
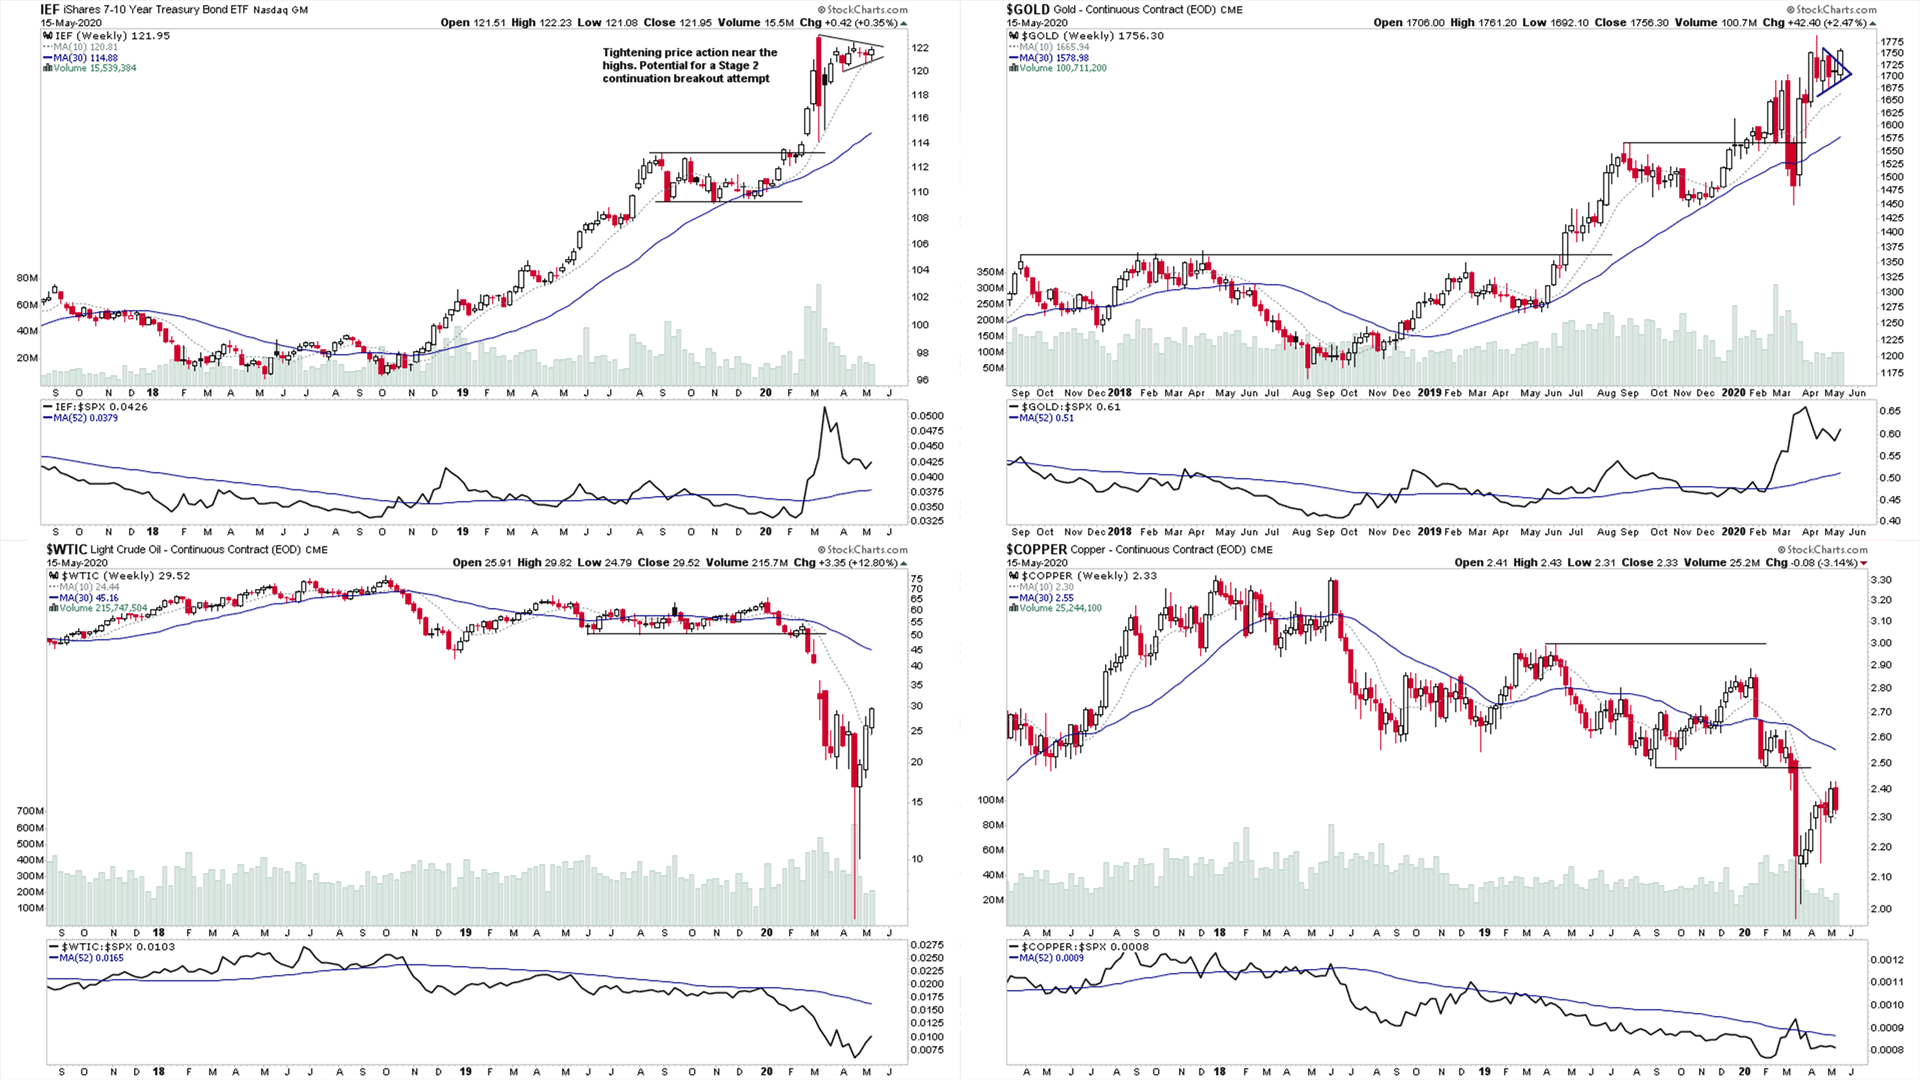
- US Treasuries & Commodities – 7-10 Year US Treasuries, Gold, Crude Oil & Copper (3:48)
- Sector Breadth: Percentage of Stocks Above Their 150 Day Moving Average – Relative Strength Table (5:57)
- Sector Breadth: Percentage of Stocks Above Their 150 Day Moving Average – Overview Diagram (8:04)
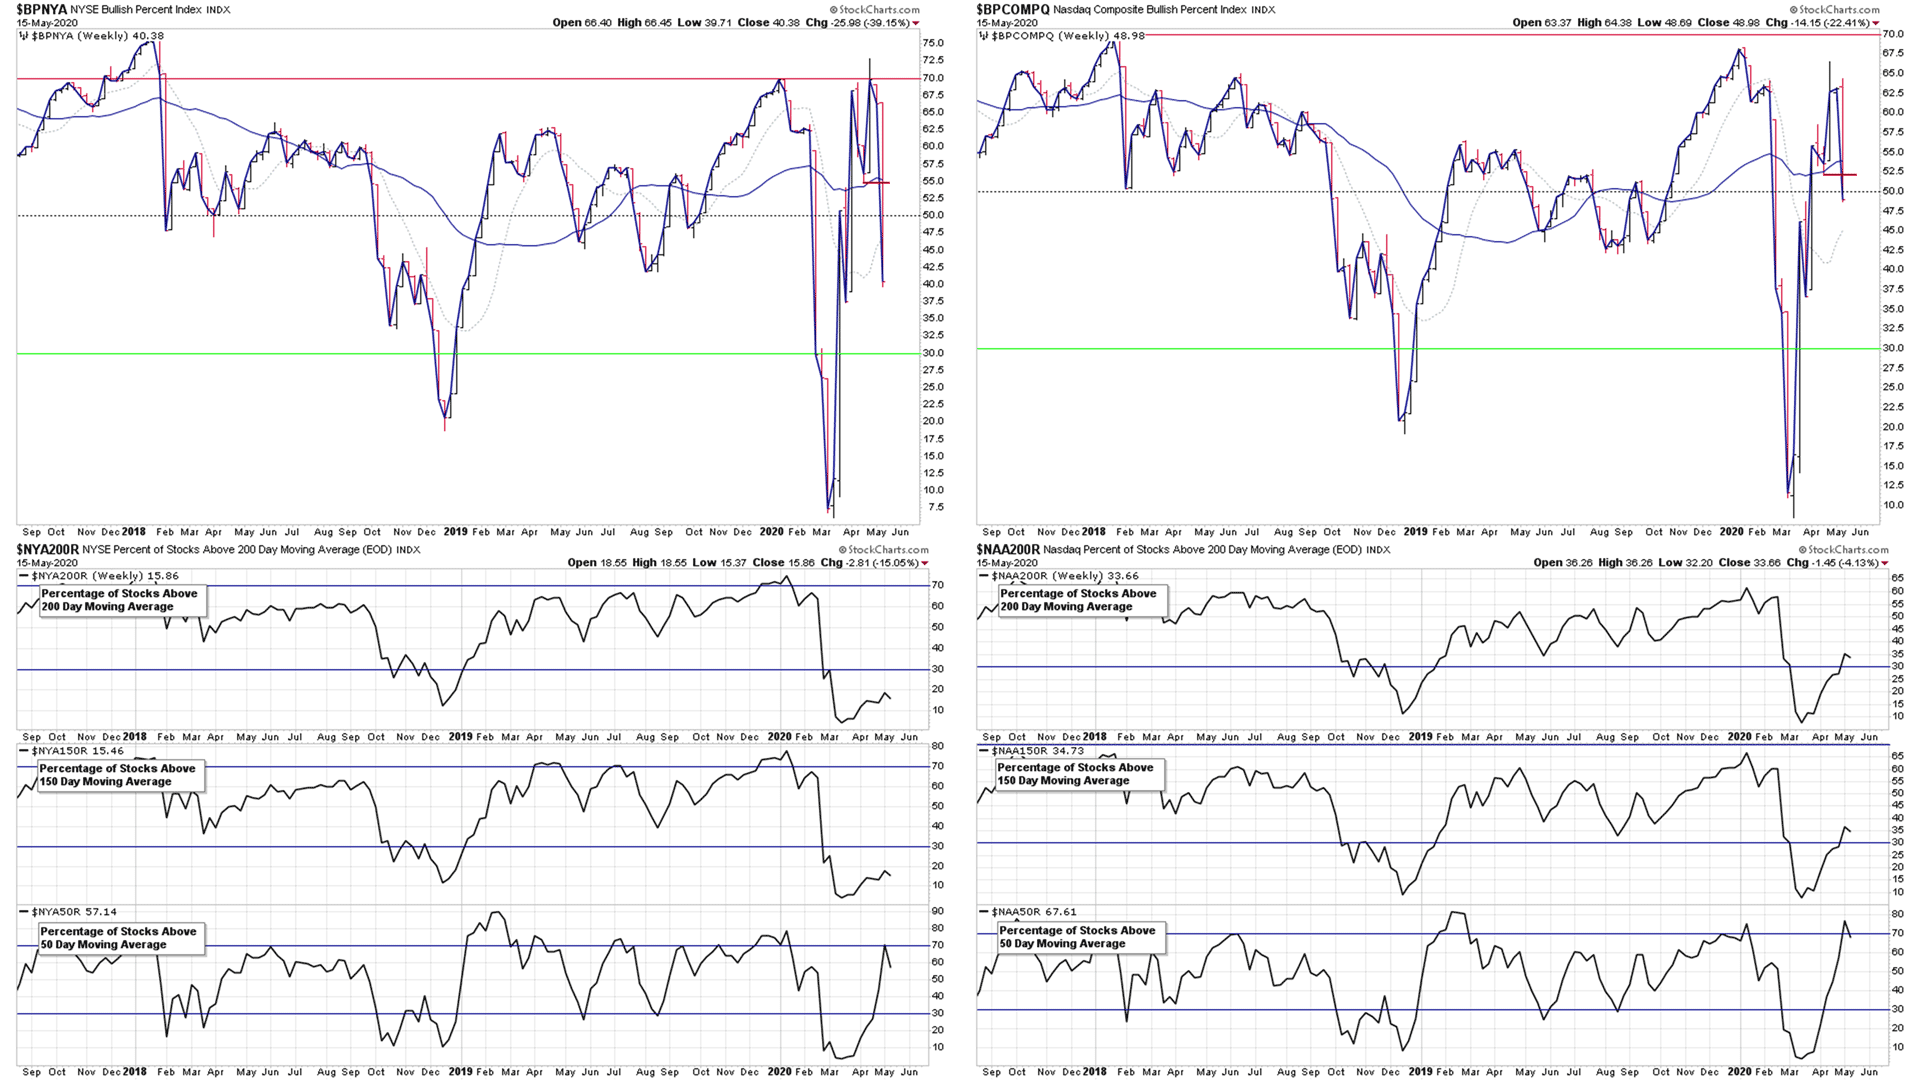
- NYSE Bullish Percent Index & Percentage of Stocks Above Their 200, 150 & 50 Day Moving Averages Charts (9:35)
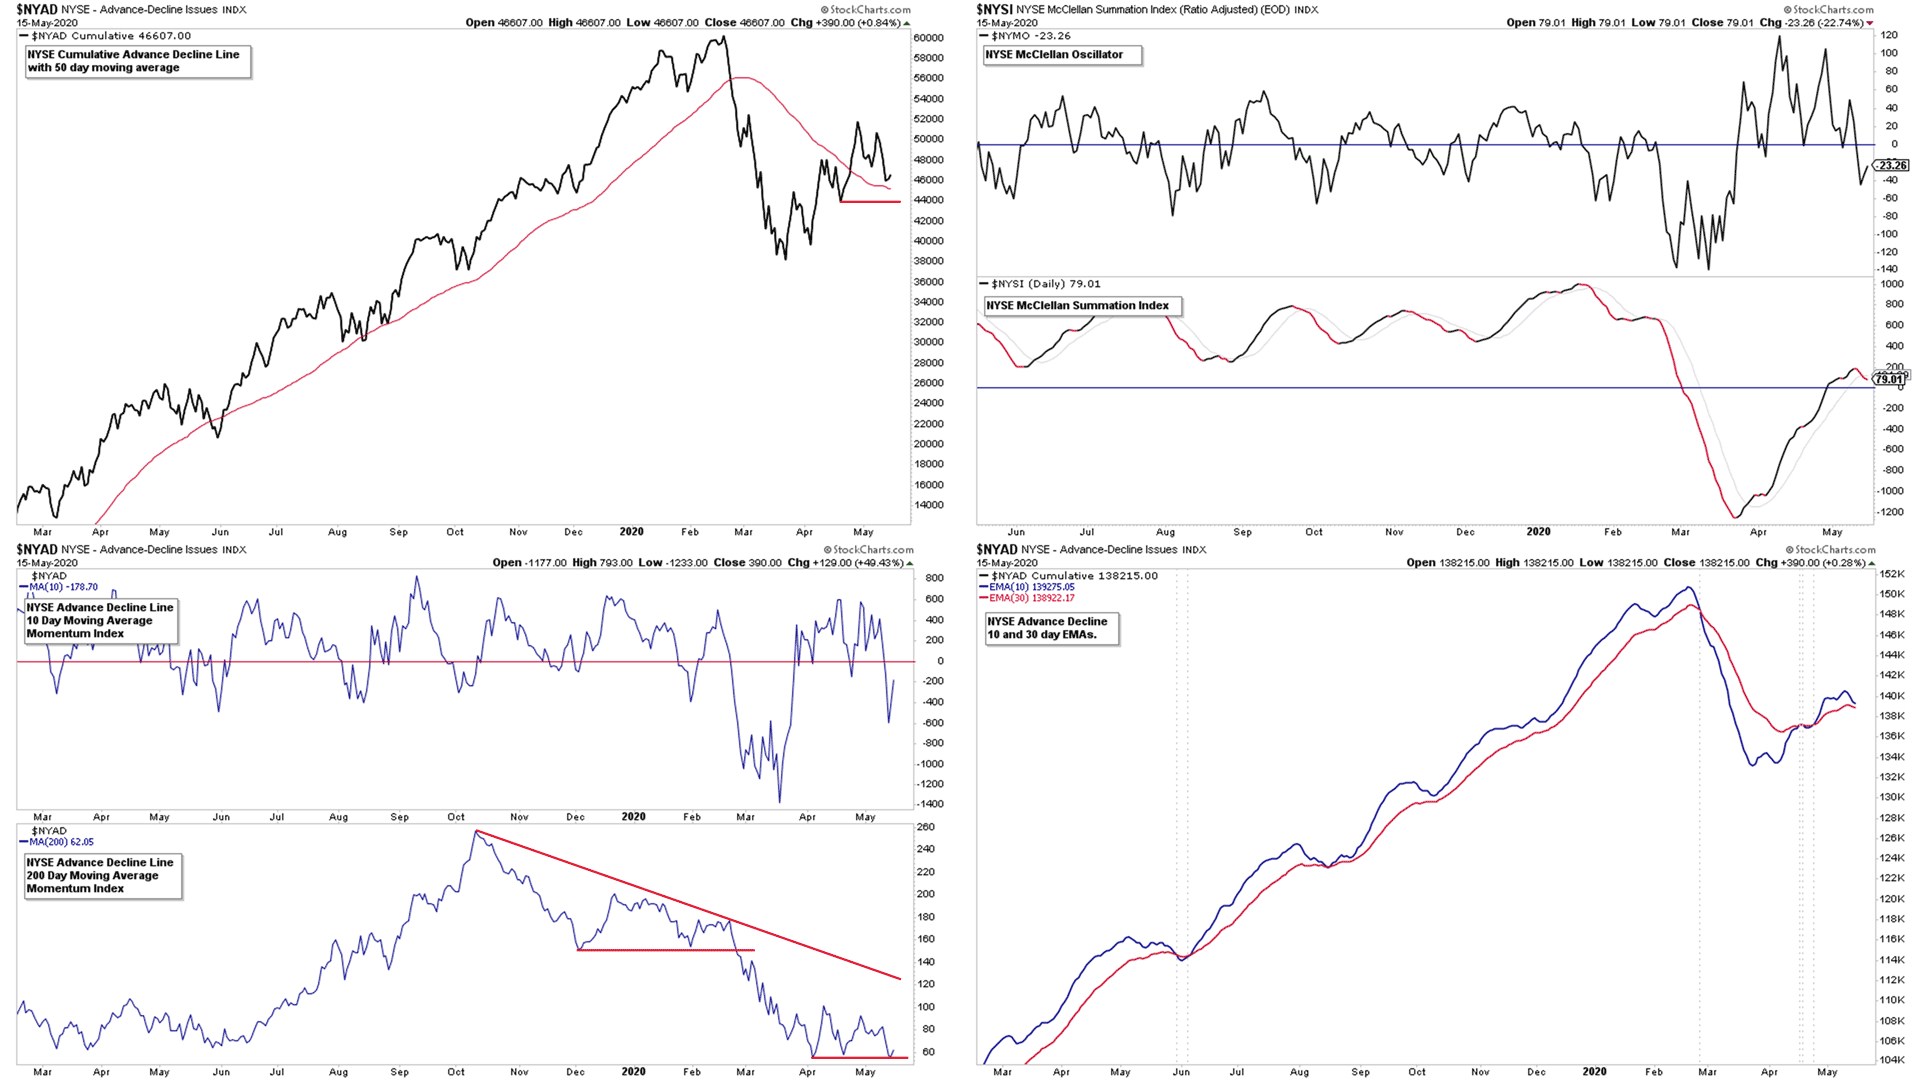
- NYSE Advance Decline Line Charts (12:19)
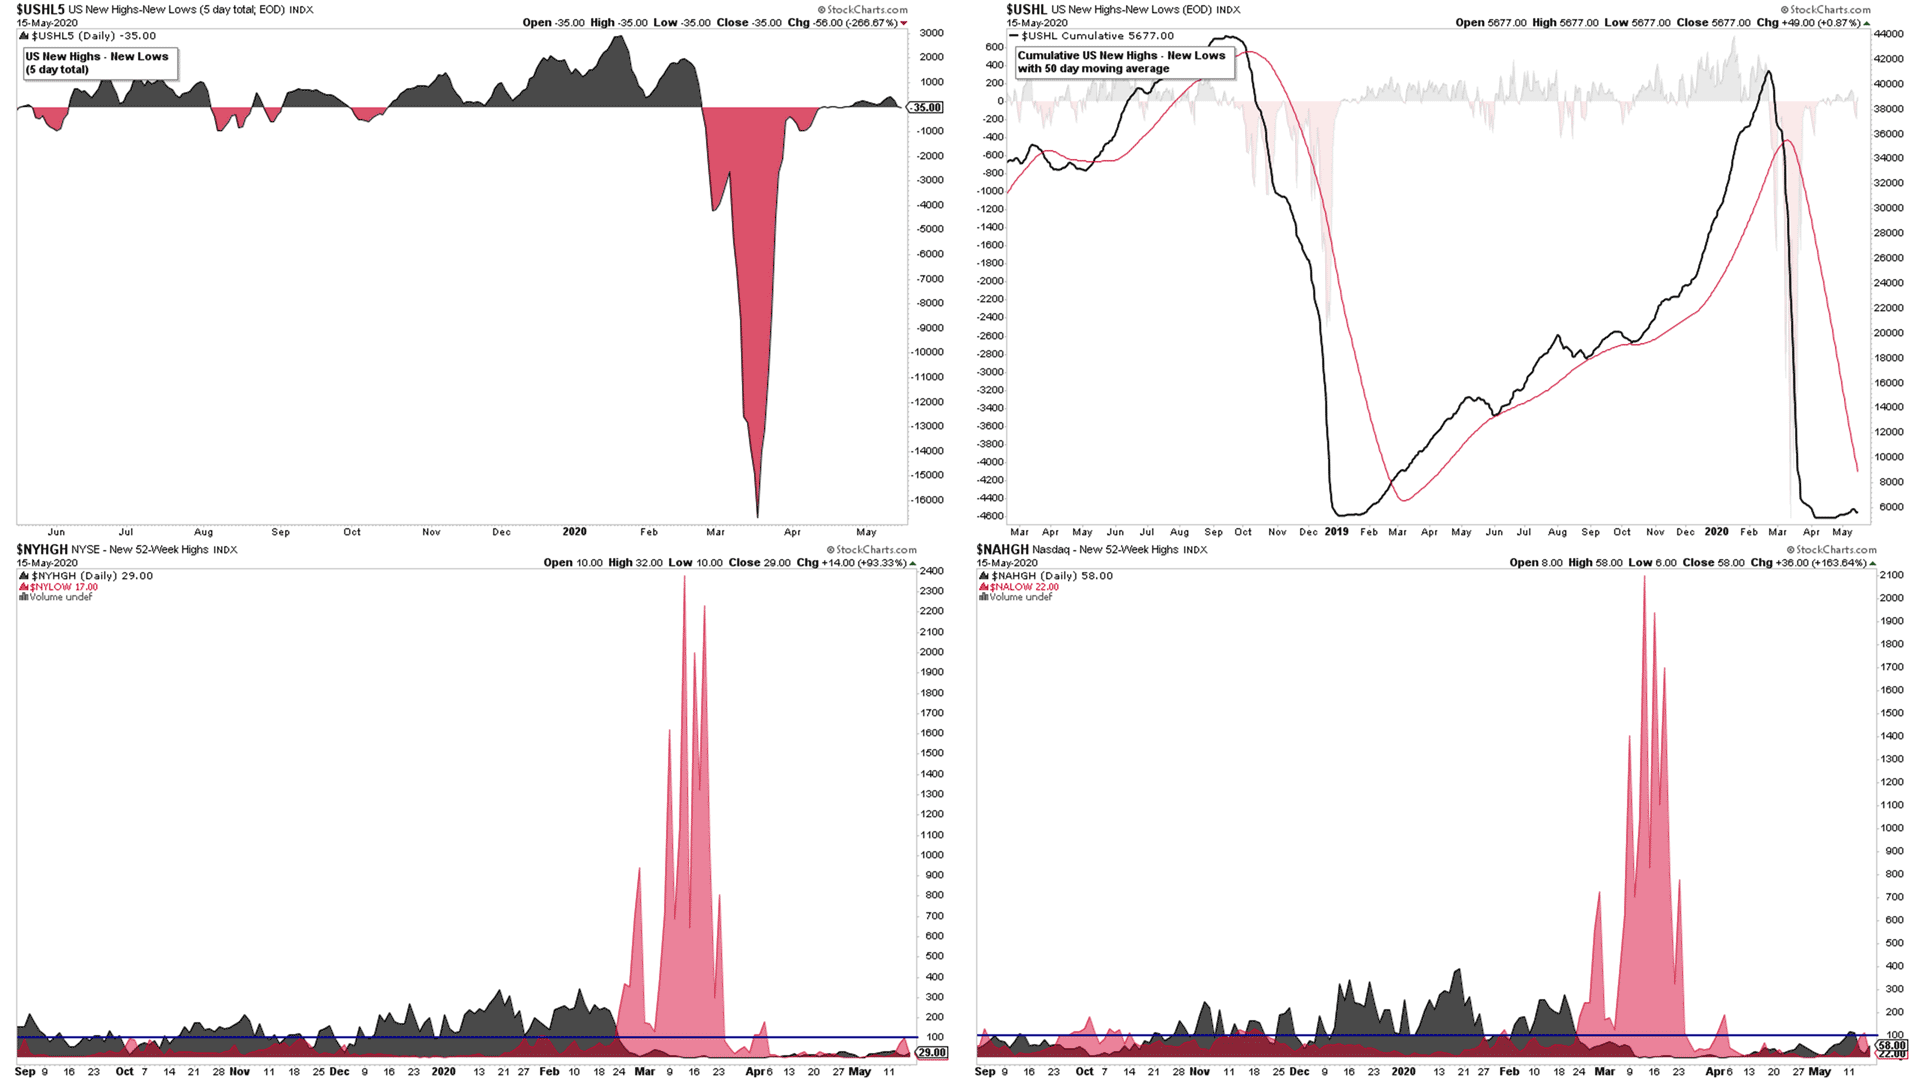
- US New Highs - New Lows Charts & Momentum Index (14:44)
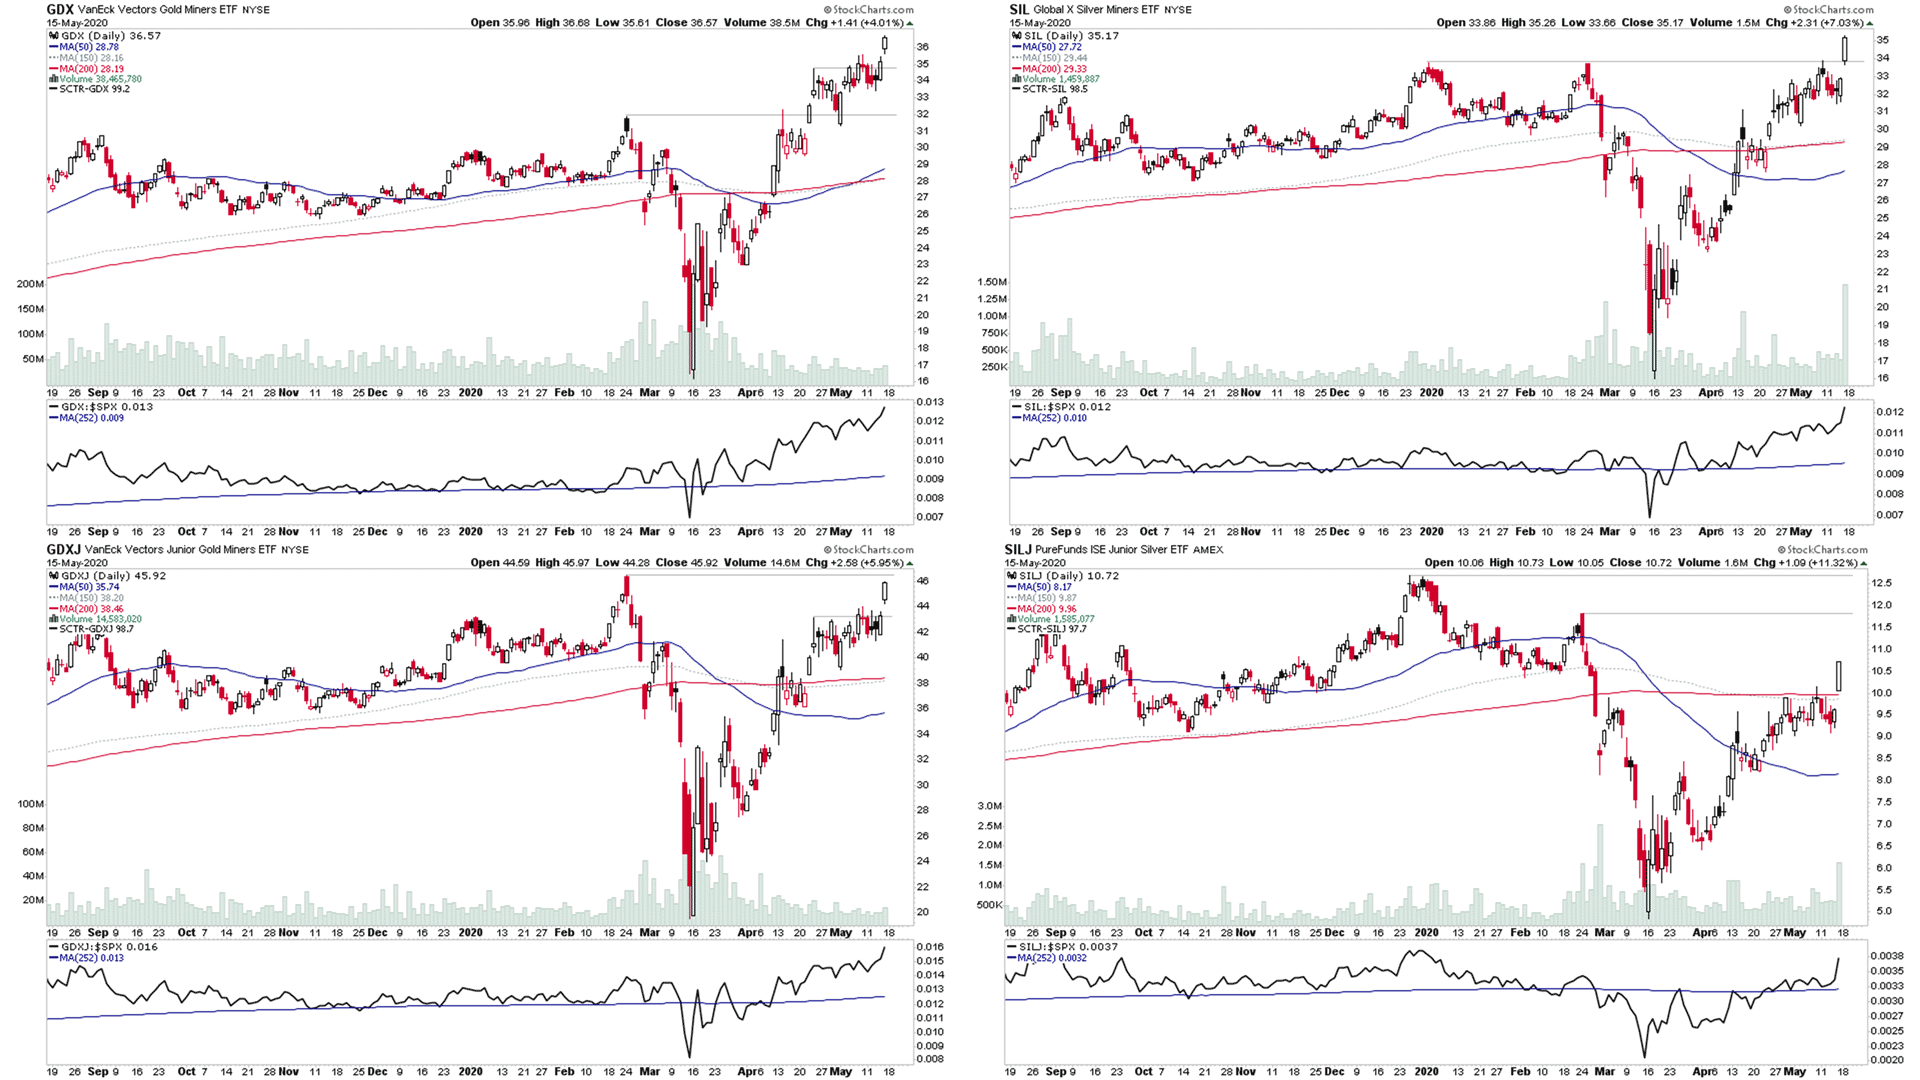
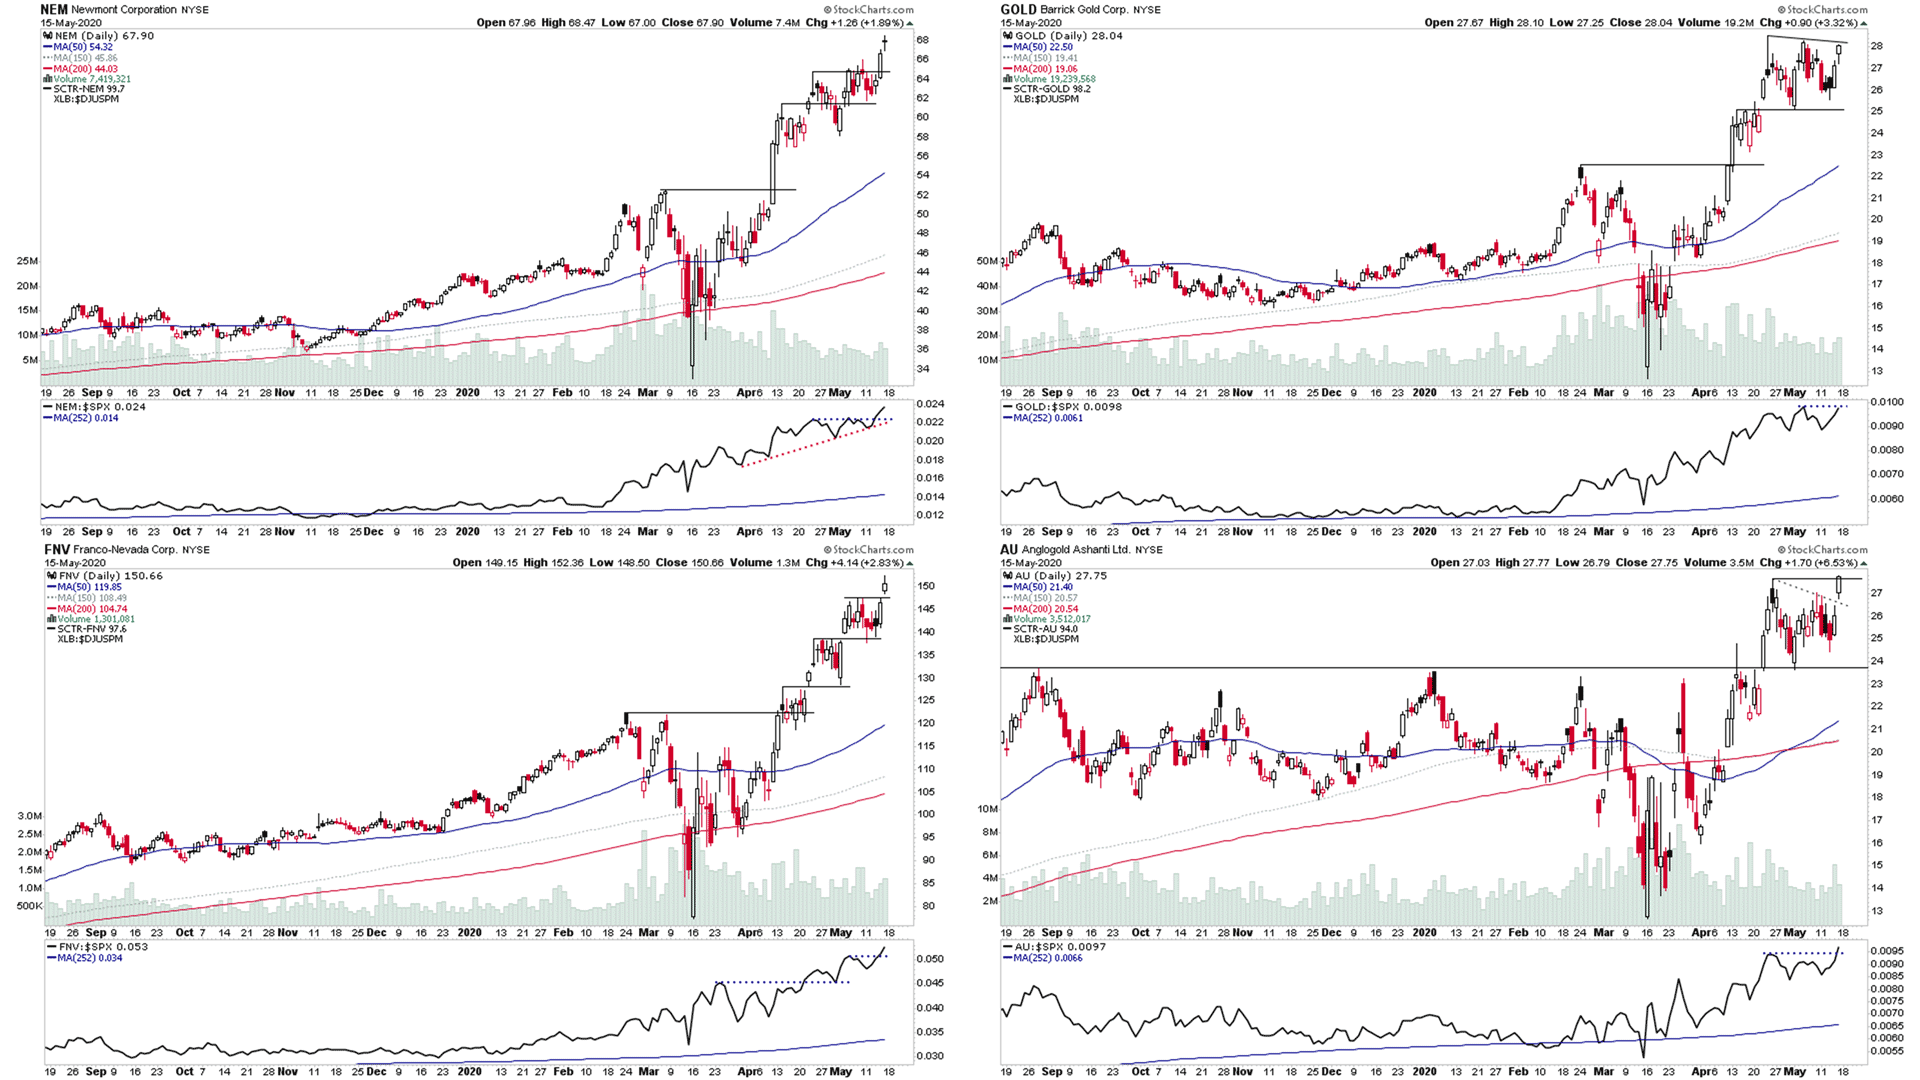
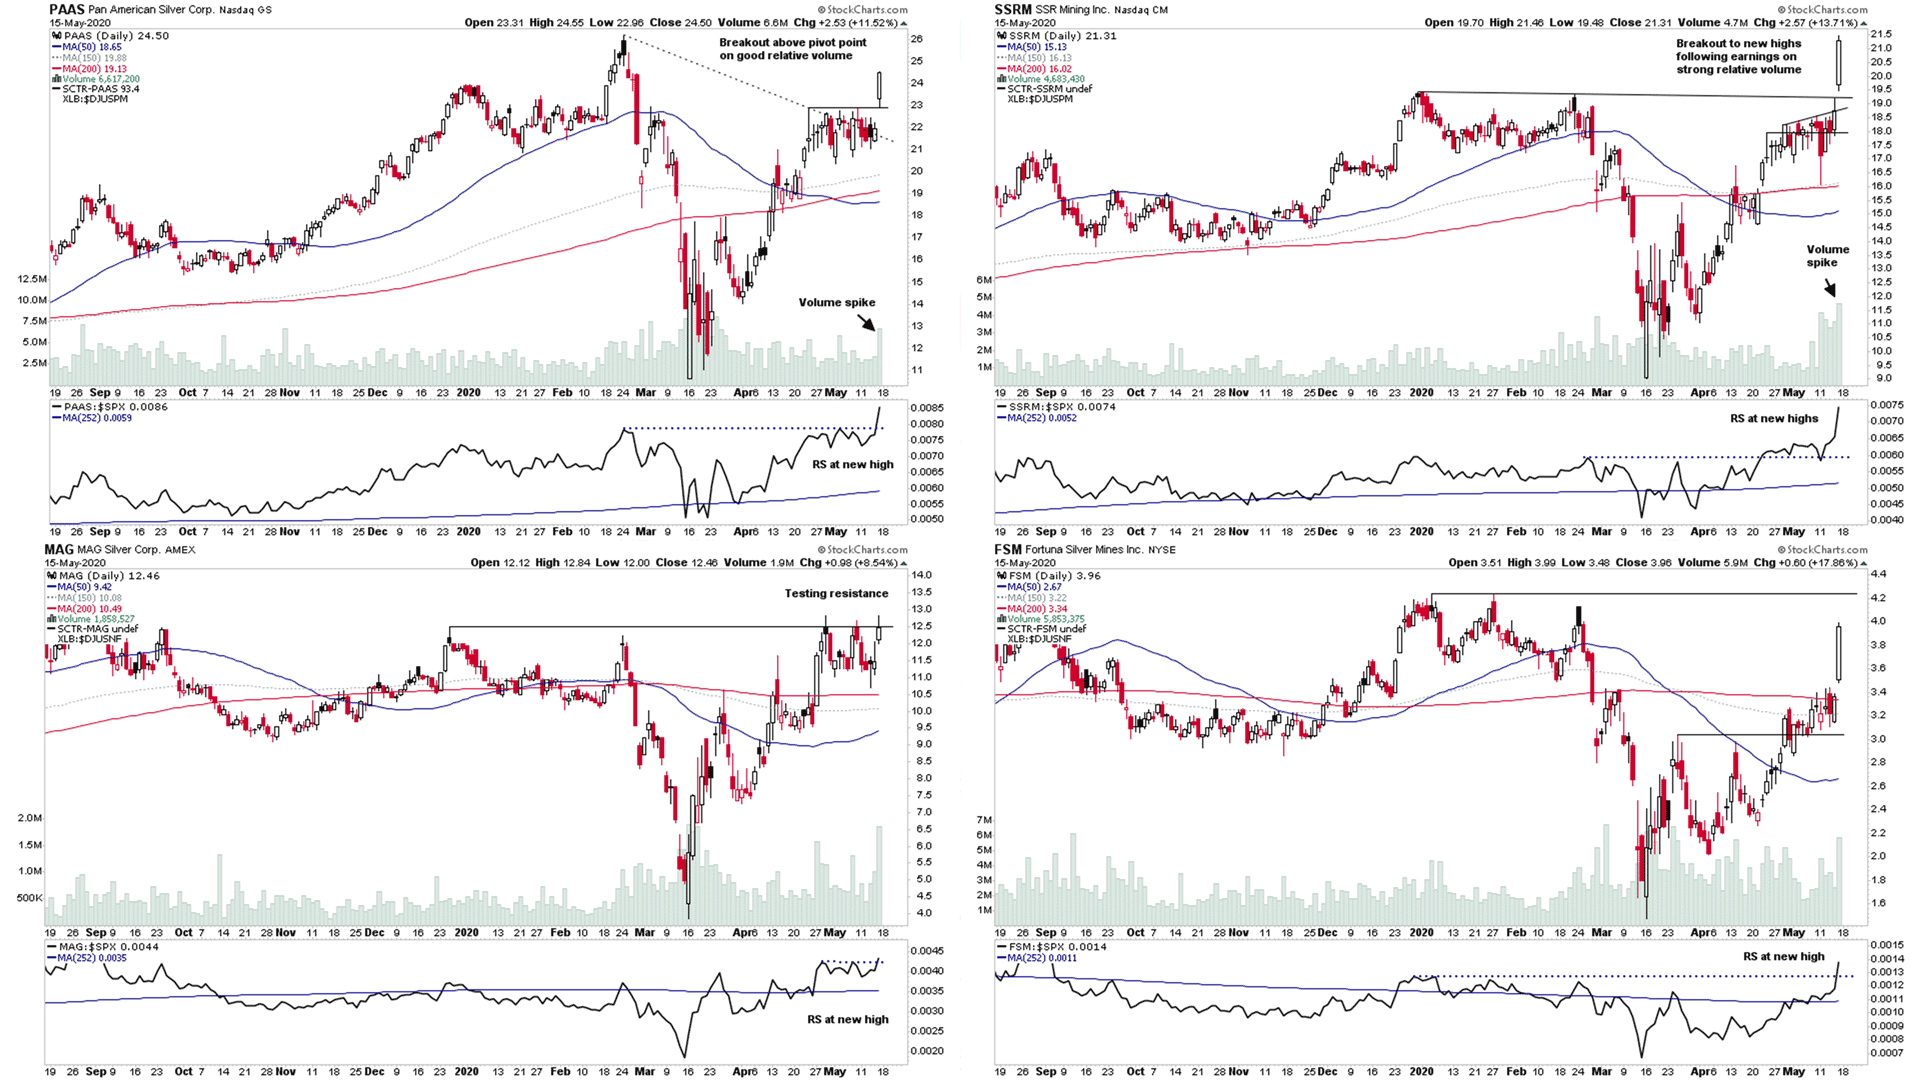
- IN FOCUS: Gold & Silver Miners Sector – Multiple Breakouts in the Sector (15:59)
A number of the key market breadth indicators weakened this week, with moves back to bearish signals in multiple indicators that had been positive for the last month or so, like the NYSE Bullish Percent Index which moved back to Bear Confirmed status on the 13th https://twitter.com/stageanaly... and multiple individual sector bullish percent index charts on the 14th https://twitter.com/stageanaly... and other breadth measures also moved back to bear signals like the McClellan Oscillator and McClellan Summation Index.
So with multiple signal changes like this, it downgrades the recent market breadth status from a short term positive, long term negative status, to a more short term neutral, long term negative status. Hence, the Weight of Evidence shifts back to a Neutral status, with a weighting more towards the negative currently.
So caution is required here, as unless the short term breadth indicators that turned down this week immediately recover back to bullish signals, then the risk of a pullback goes up dramatically. So stay alert and especially don't chase stocks that are extended from their proper buy points, as a risk of market pullback is increased here.
=======================
Weekend update of the major US stock market indexes and indicators. A weekly look beneath the surface of the US stock market, featuring the key market breadth charts for timing trading stocks and the stock market indexes, such as the NYSE Bullish Percent Index, the Advance Decline Line, the New Highs - New Lows etc and some custom breadth indicators of my own in order to determine what the "Weight of Evidence" is suggesting in terms of the US stock market direction and how to allocate your money.
=======================
Subscribe to the Channel
=======================
Subscribe to the Stage Analysis Youtube Channel to get the latest stock trading videos when they are released:
https://www.youtube.com/channe...
====================
Stage Analysis Website
====================
Want to chat about Stan Weinstein's Stage Analysis method and his classic book: Stan Weinstein's Secrets for Profit in Bull and Bear Markets, then go to Stage Analysis website and join the forum here: https://www.stageanalysis.net/forum/
=======================
Follow us on Social Media:
=======================
Twitter: https://twitter.com/stageanalysis
Stocktwits: https://stocktwits.com/StageAnalysis
======================================
Books to help you learn how to trade stocks*
======================================
• Stan Weinstein's Secrets for Profit in Bull and Bear Markets: https://amzn.to/2RpDdPZ
• Trade Like a Stock Market Wizard: How to Achieve Super Performance in Stocks in Any Market: https://amzn.to/2NUXA5p
• How to Make Money in Stocks: A Winning System In Good Times And Bad, Fourth Edition: https://amzn.to/2NYAE5D
• Think & Trade Like a Champion: The Secrets, Rules & Blunt Truths of a Stock Market Wizard: https://amzn.to/37qBSyd
• Momentum Masters: A Roundtable Interview with Super Traders: https://amzn.to/37uzCWs
• Insider Buy Superstocks: https://amzn.to/2RHyVCs
• Point and Figure Charting: The Essential Application for Forecasting and Tracking Market Prices (Wiley Trading): https://amzn.to/2RLPtta
• Come Into My Trading Room: A Complete Guide to Trading (Wiley Trading): https://amzn.to/2tFM1bK
• The New Trading for a Living: Psychology, Discipline, Trading Tools and Systems, Risk Control, Trade Management (Wiley Trading): https://amzn.to/37uAhXW
• Entries and Exits: Visits to Sixteen Trading Rooms: Visits to 16 Trading Rooms (Wiley Trading): https://amzn.to/38JYkCJ
Disclaimer: All stock charts and ideas presented are for educational purposes only. Always do your own research before making any trades.
#stocks #trading #money #nyse #nasdaq #technicalanalysis #stock #stockbreakouts #stocksandshares #investing
*As an Amazon Associate I earn from qualifying purchases.
Disclaimer: For educational purpose only. Not investment advice. Seek professional advice from a financial advisor before making any investing decisions.