
Netflix Stage 4 Continuation Breakdown on Earnings and the US Stocks Watchlist – 19 April 2022
The full post is available to view by members only. For immediate access:
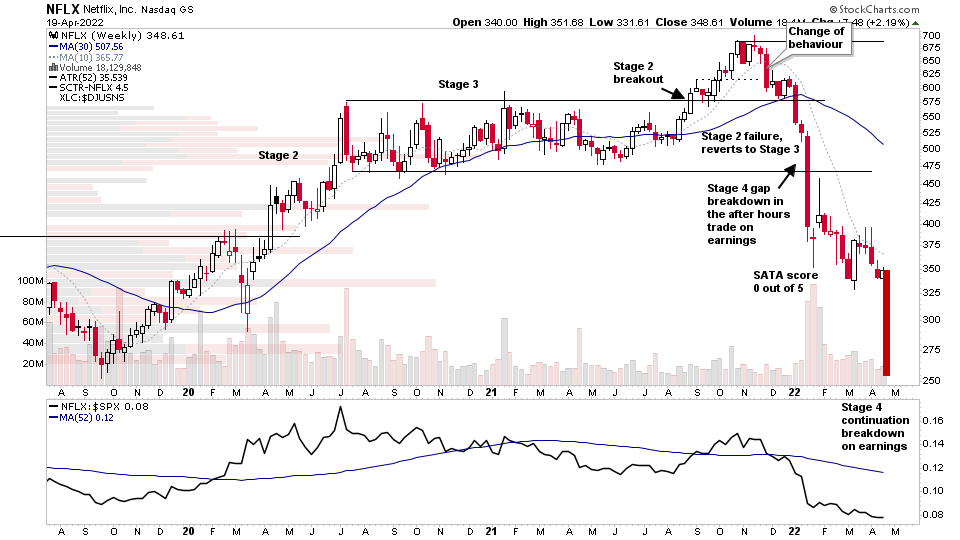
NFLX (Netflix) reacted poorly to it earnings again and made its second large gap down of the year so far. The first of which was on the announcement of the previous earnings. And so it made a Stage 4 continuation breakdown with a massive gap of over -25% in the after hours trade and has now retraced the entire previous Stage 2 advance. Hence, it should be a strong lesson for anyone considering holding a late Stage 4B stock into earnings on the hope of a gap up – the key word there being hope – as surprises in a Stage 4 tend to be to the downside.
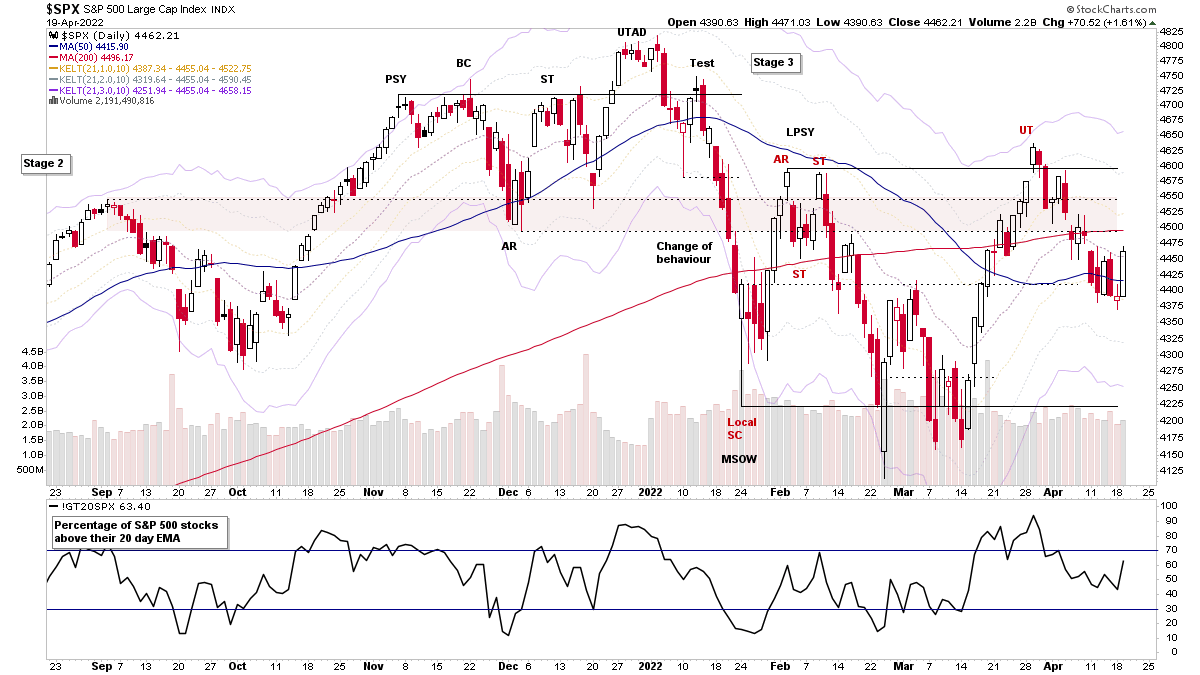
The stock market bounced today with yet another move through the 50 day MA (4 reversals through the 50 day MA in the last 5 days), so the rollercoaster / whipsaw market continues in the short term – which as Stan Weinstein says almost daily in the Global Trend Alert, is the least important, as he considers it a 1 on the Richter Scale, while the intermediate term trend is a 5, and the major long term trend is a 10 on the Richter Scale. So while everyone obsesses about every minor daily move, what matters is the over trend and overall market health – which is why I go into so much detail each weekend on the member videos about the Market Breadth charts. As determining what the Weight of Evidence is suggesting from the Market Breadth charts, as well as individual stock and group action and money flow etc, is crucial to successfully using the Stage Analysis method, and is often overlooked by new traders and investor to the method. When in reality, it's the most important part of the method, as it helps you to get in sync with the market environment that you are trading in, which then affects your strategy.
US Stocks Watchlist – 19 April 2022
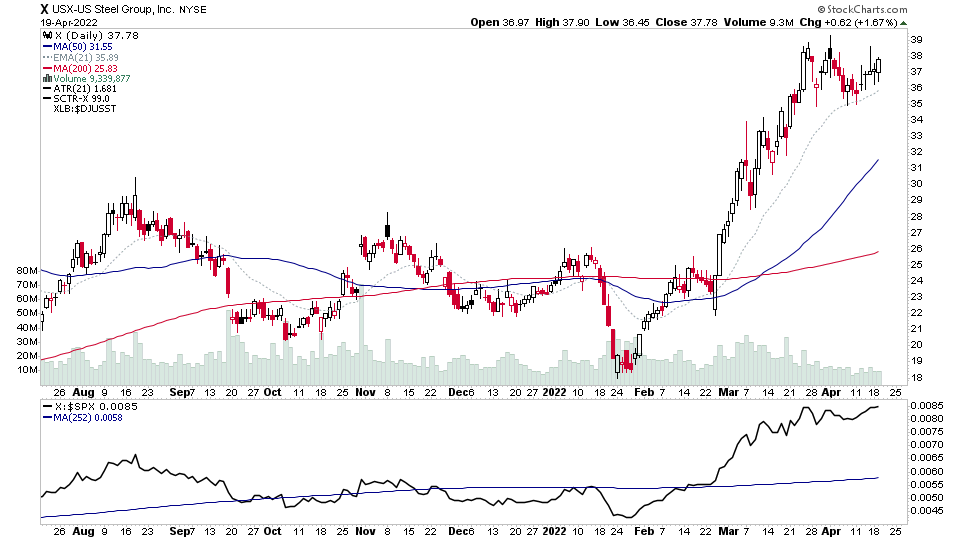
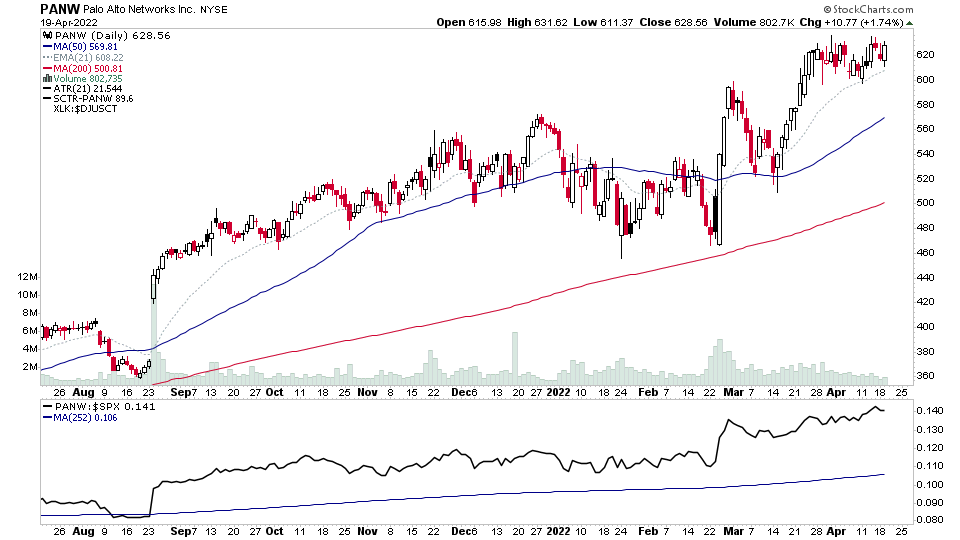
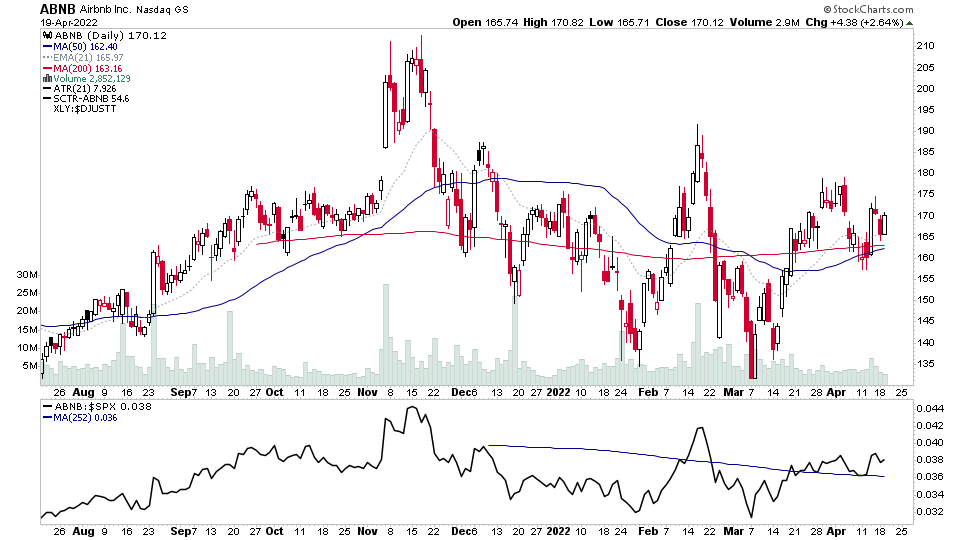
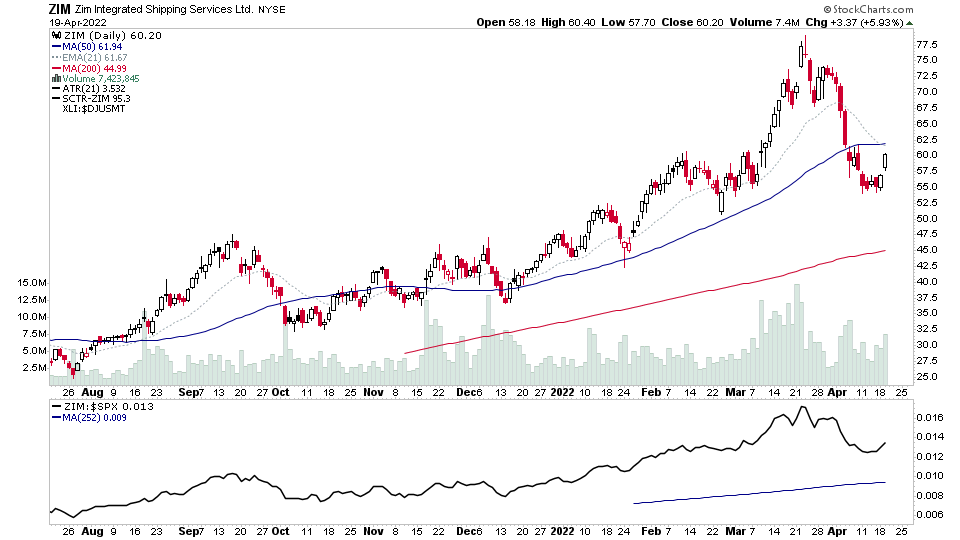
There were 34 stocks for the US stocks watchlist today.
X, PANW, ABNB, ZIM + 30 more...
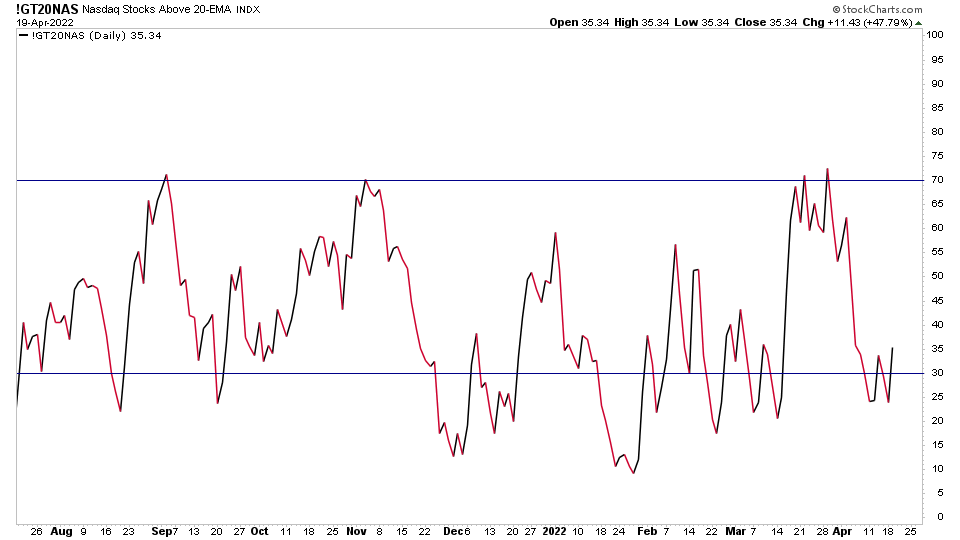
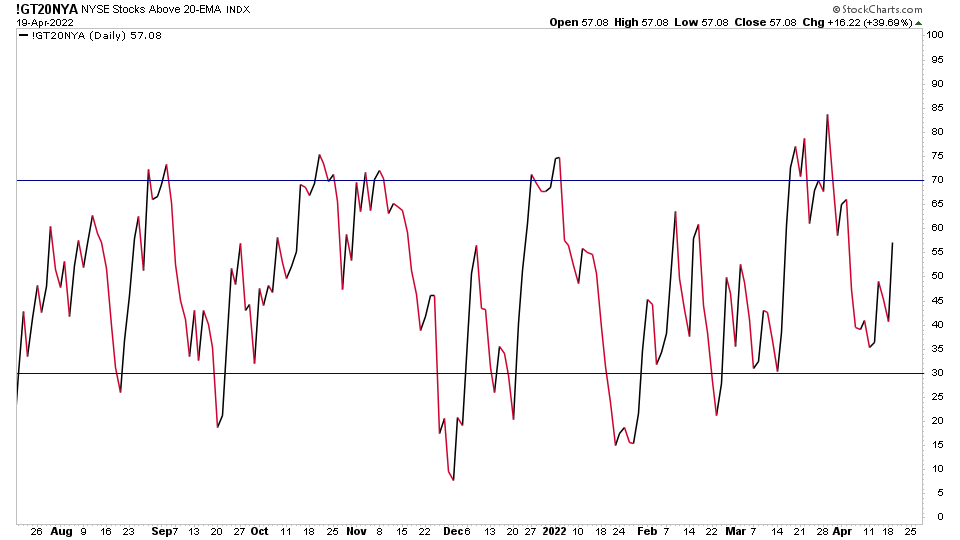
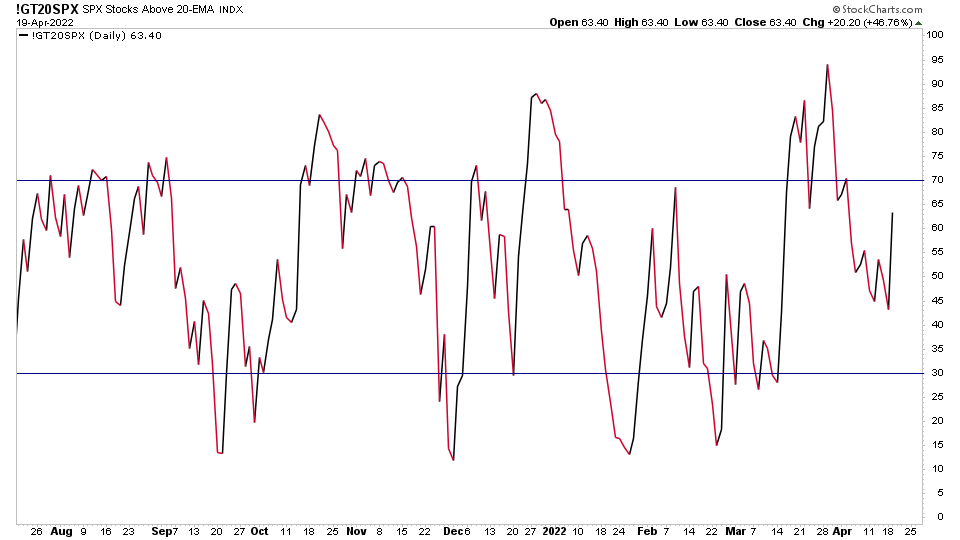
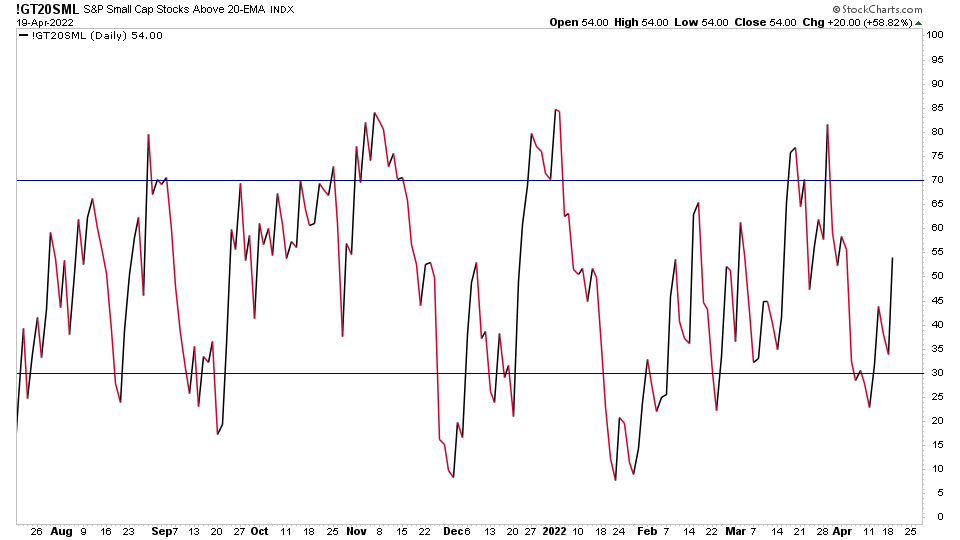
Market Breadth: Percentage of Stocks Above Their 20 Day MA
The Percentage of Stocks Above Their 20 Day EMA charts reversed higher again today, with the Nasdaq Composite chart back out from the lower zone, and pivot breakouts from the rest. So a tentative positive signal which needs further confirmation in the coming days.
Become a Stage Analysis Member:
To see more like this – US Stocks watchlist posts, detailed videos each weekend, use our unique Stage Analysis tools, such as the US Stocks & ETFs Screener, Charts, Market Breadth, Group Relative Strength and more...
Join Today
Disclaimer: For educational purpose only. Not investment advice. Seek professional advice from a financial advisor before making any investing decisions.