
Market Breadth: Percentage of Stocks Above their 50 Day, 150 Day & 200 Day Moving Averages Combined
The full post is available to view by members only. For immediate access:
42.37% (+1.31% 1wk)
Status: Positive Environment
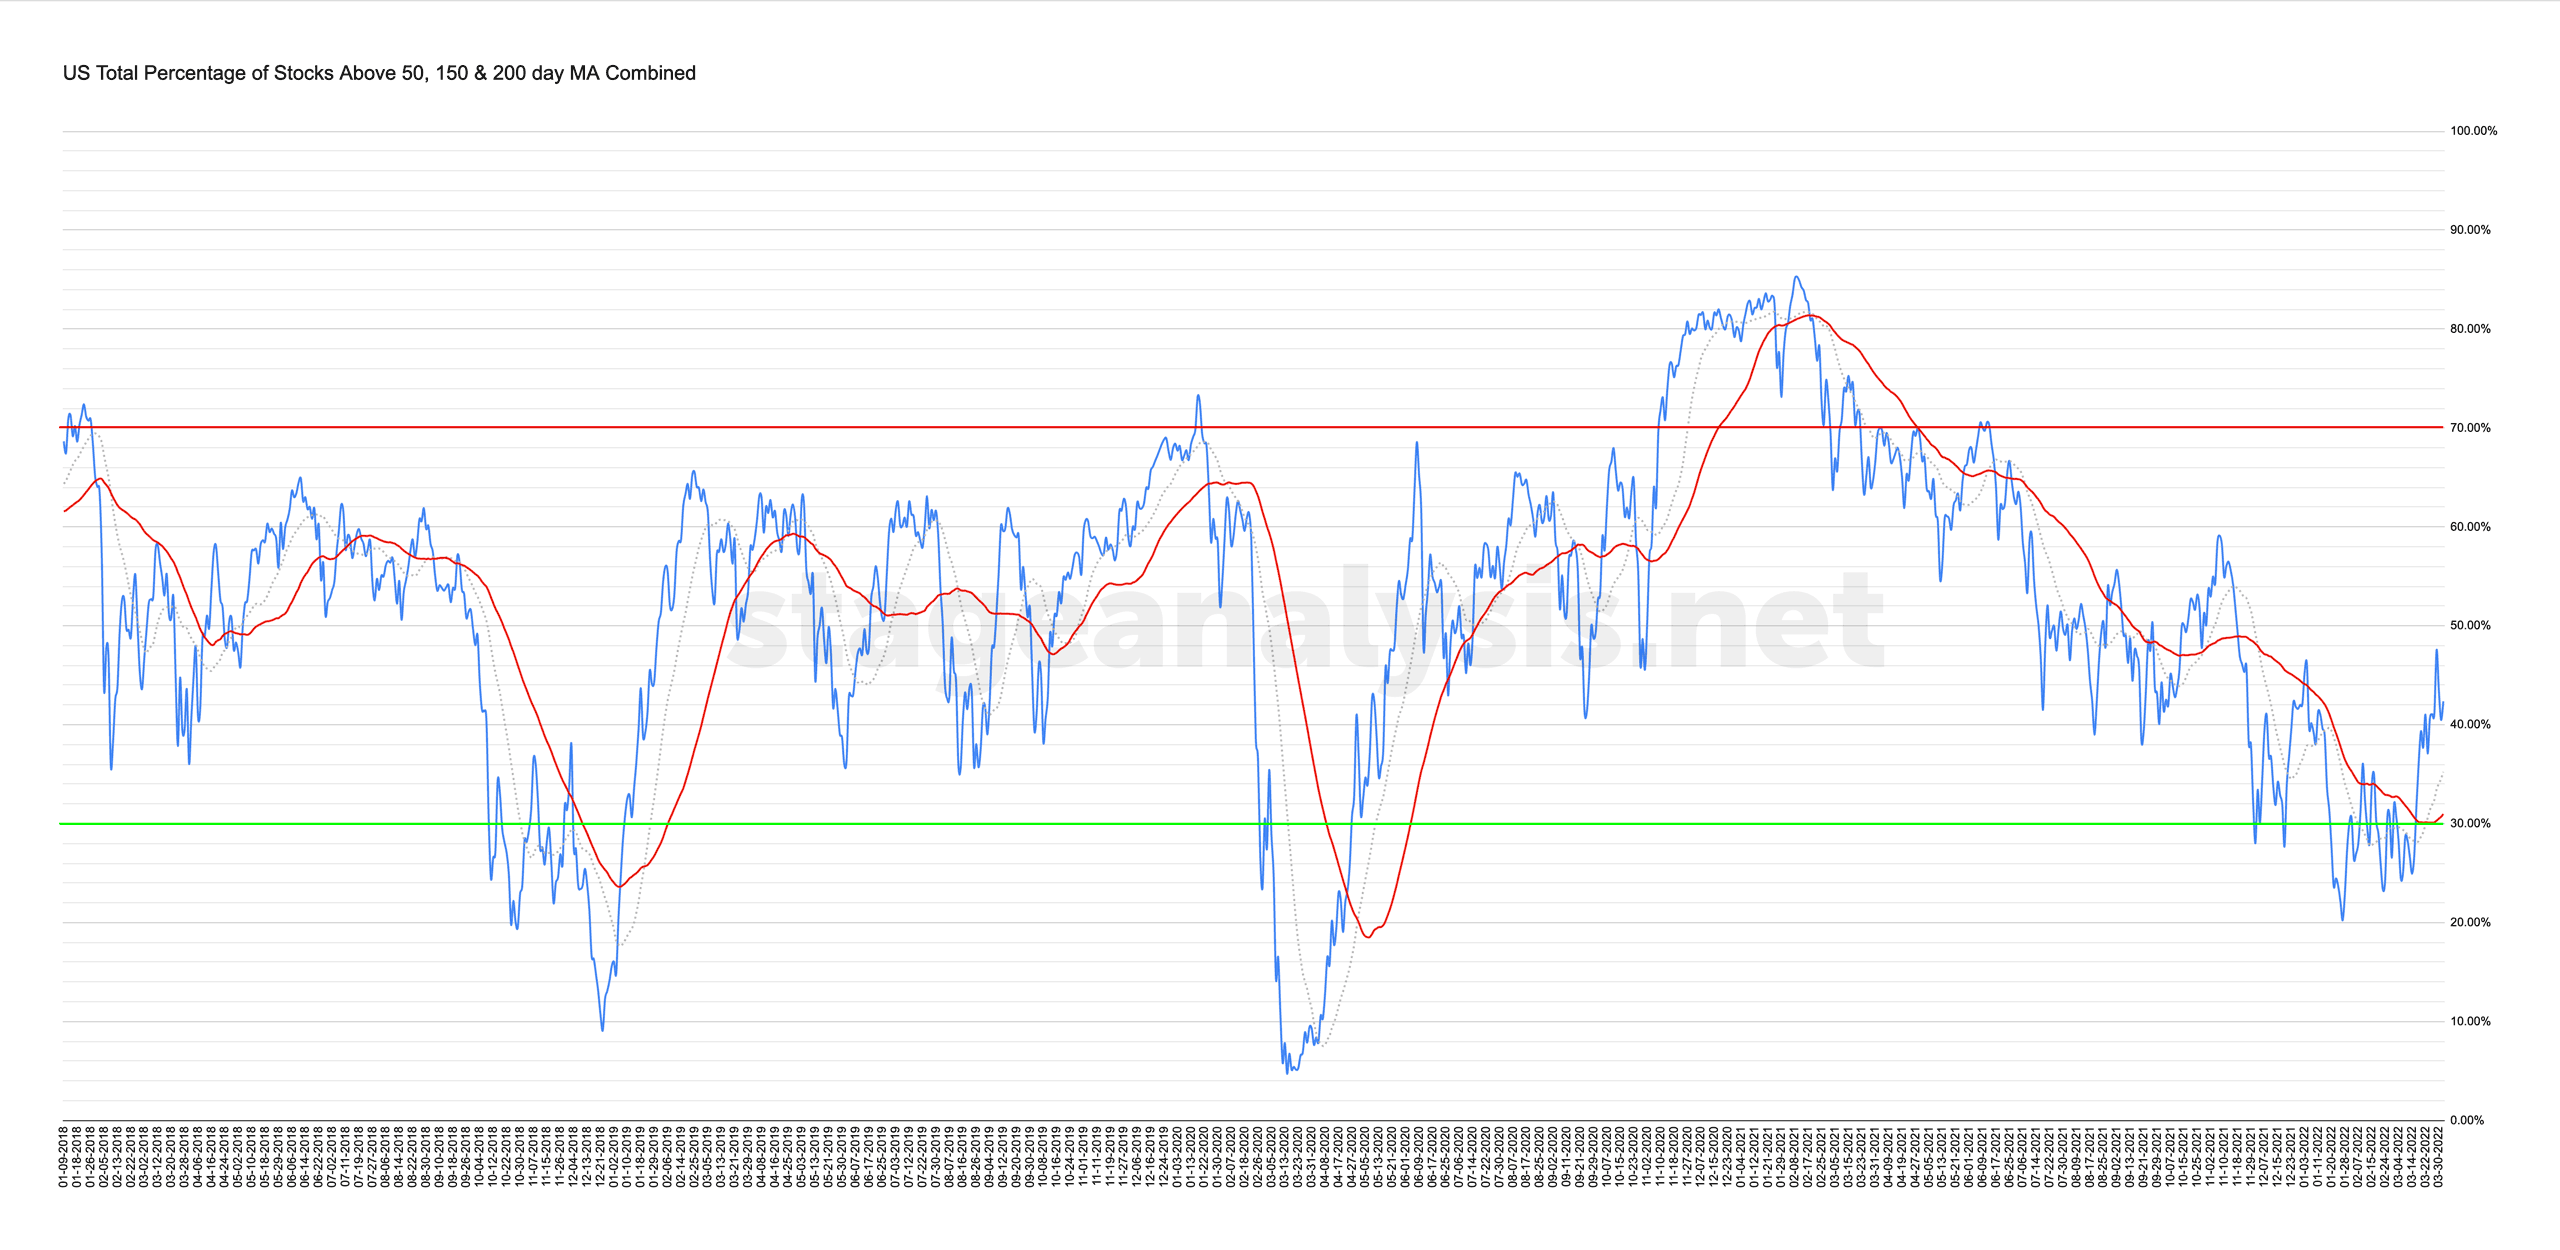
The US Total Percentage of Stocks Above their 50 Day, 150 Day & 200 Day Moving Averages Combined chart extended its move above its 50 day MA, but pulled back Wednesday and Thursday. However, the move above the 50 day MA is the largest since November 2020, and only reached the current level above the 50 day MA in Jan 2019 and late April 2020 previously in the last four years. So it is a potential Change of Character over the other rally attempts in the last year.
Disclaimer: For educational purpose only. Not investment advice. Seek professional advice from a financial advisor before making any investing decisions.