
US Stocks Industry Groups Relative Strength Rankings
The full post is available to view by members only. For immediate access:
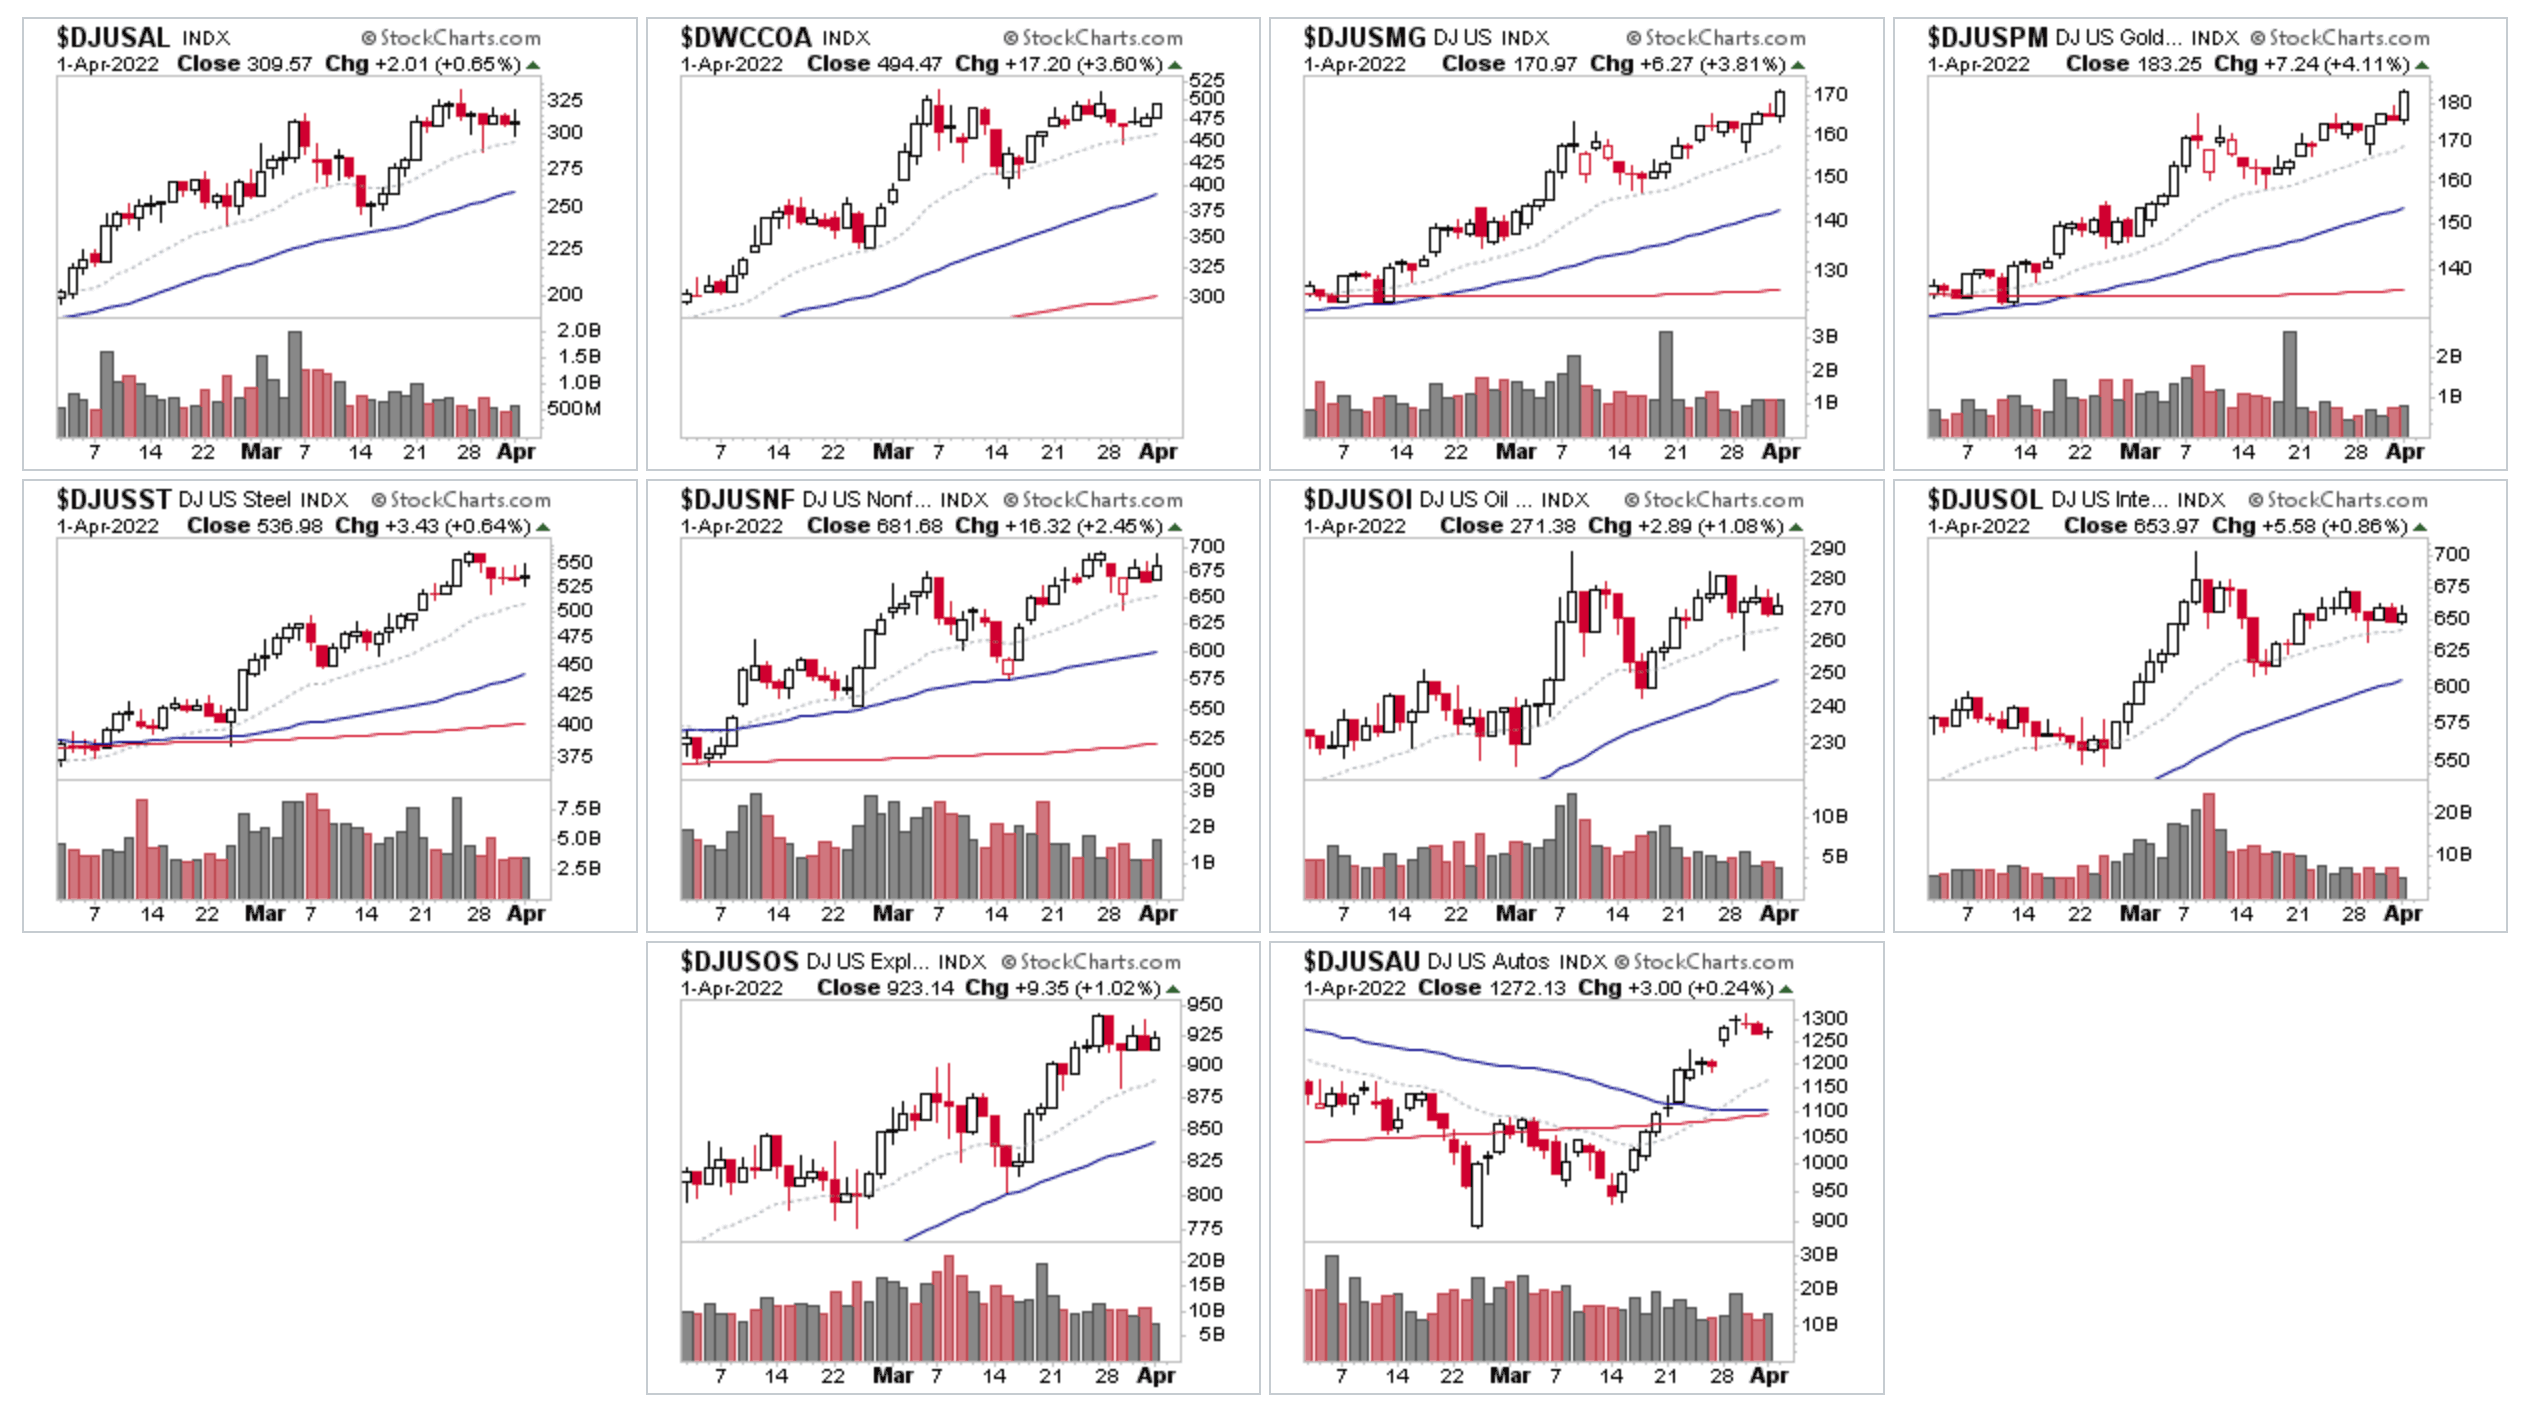
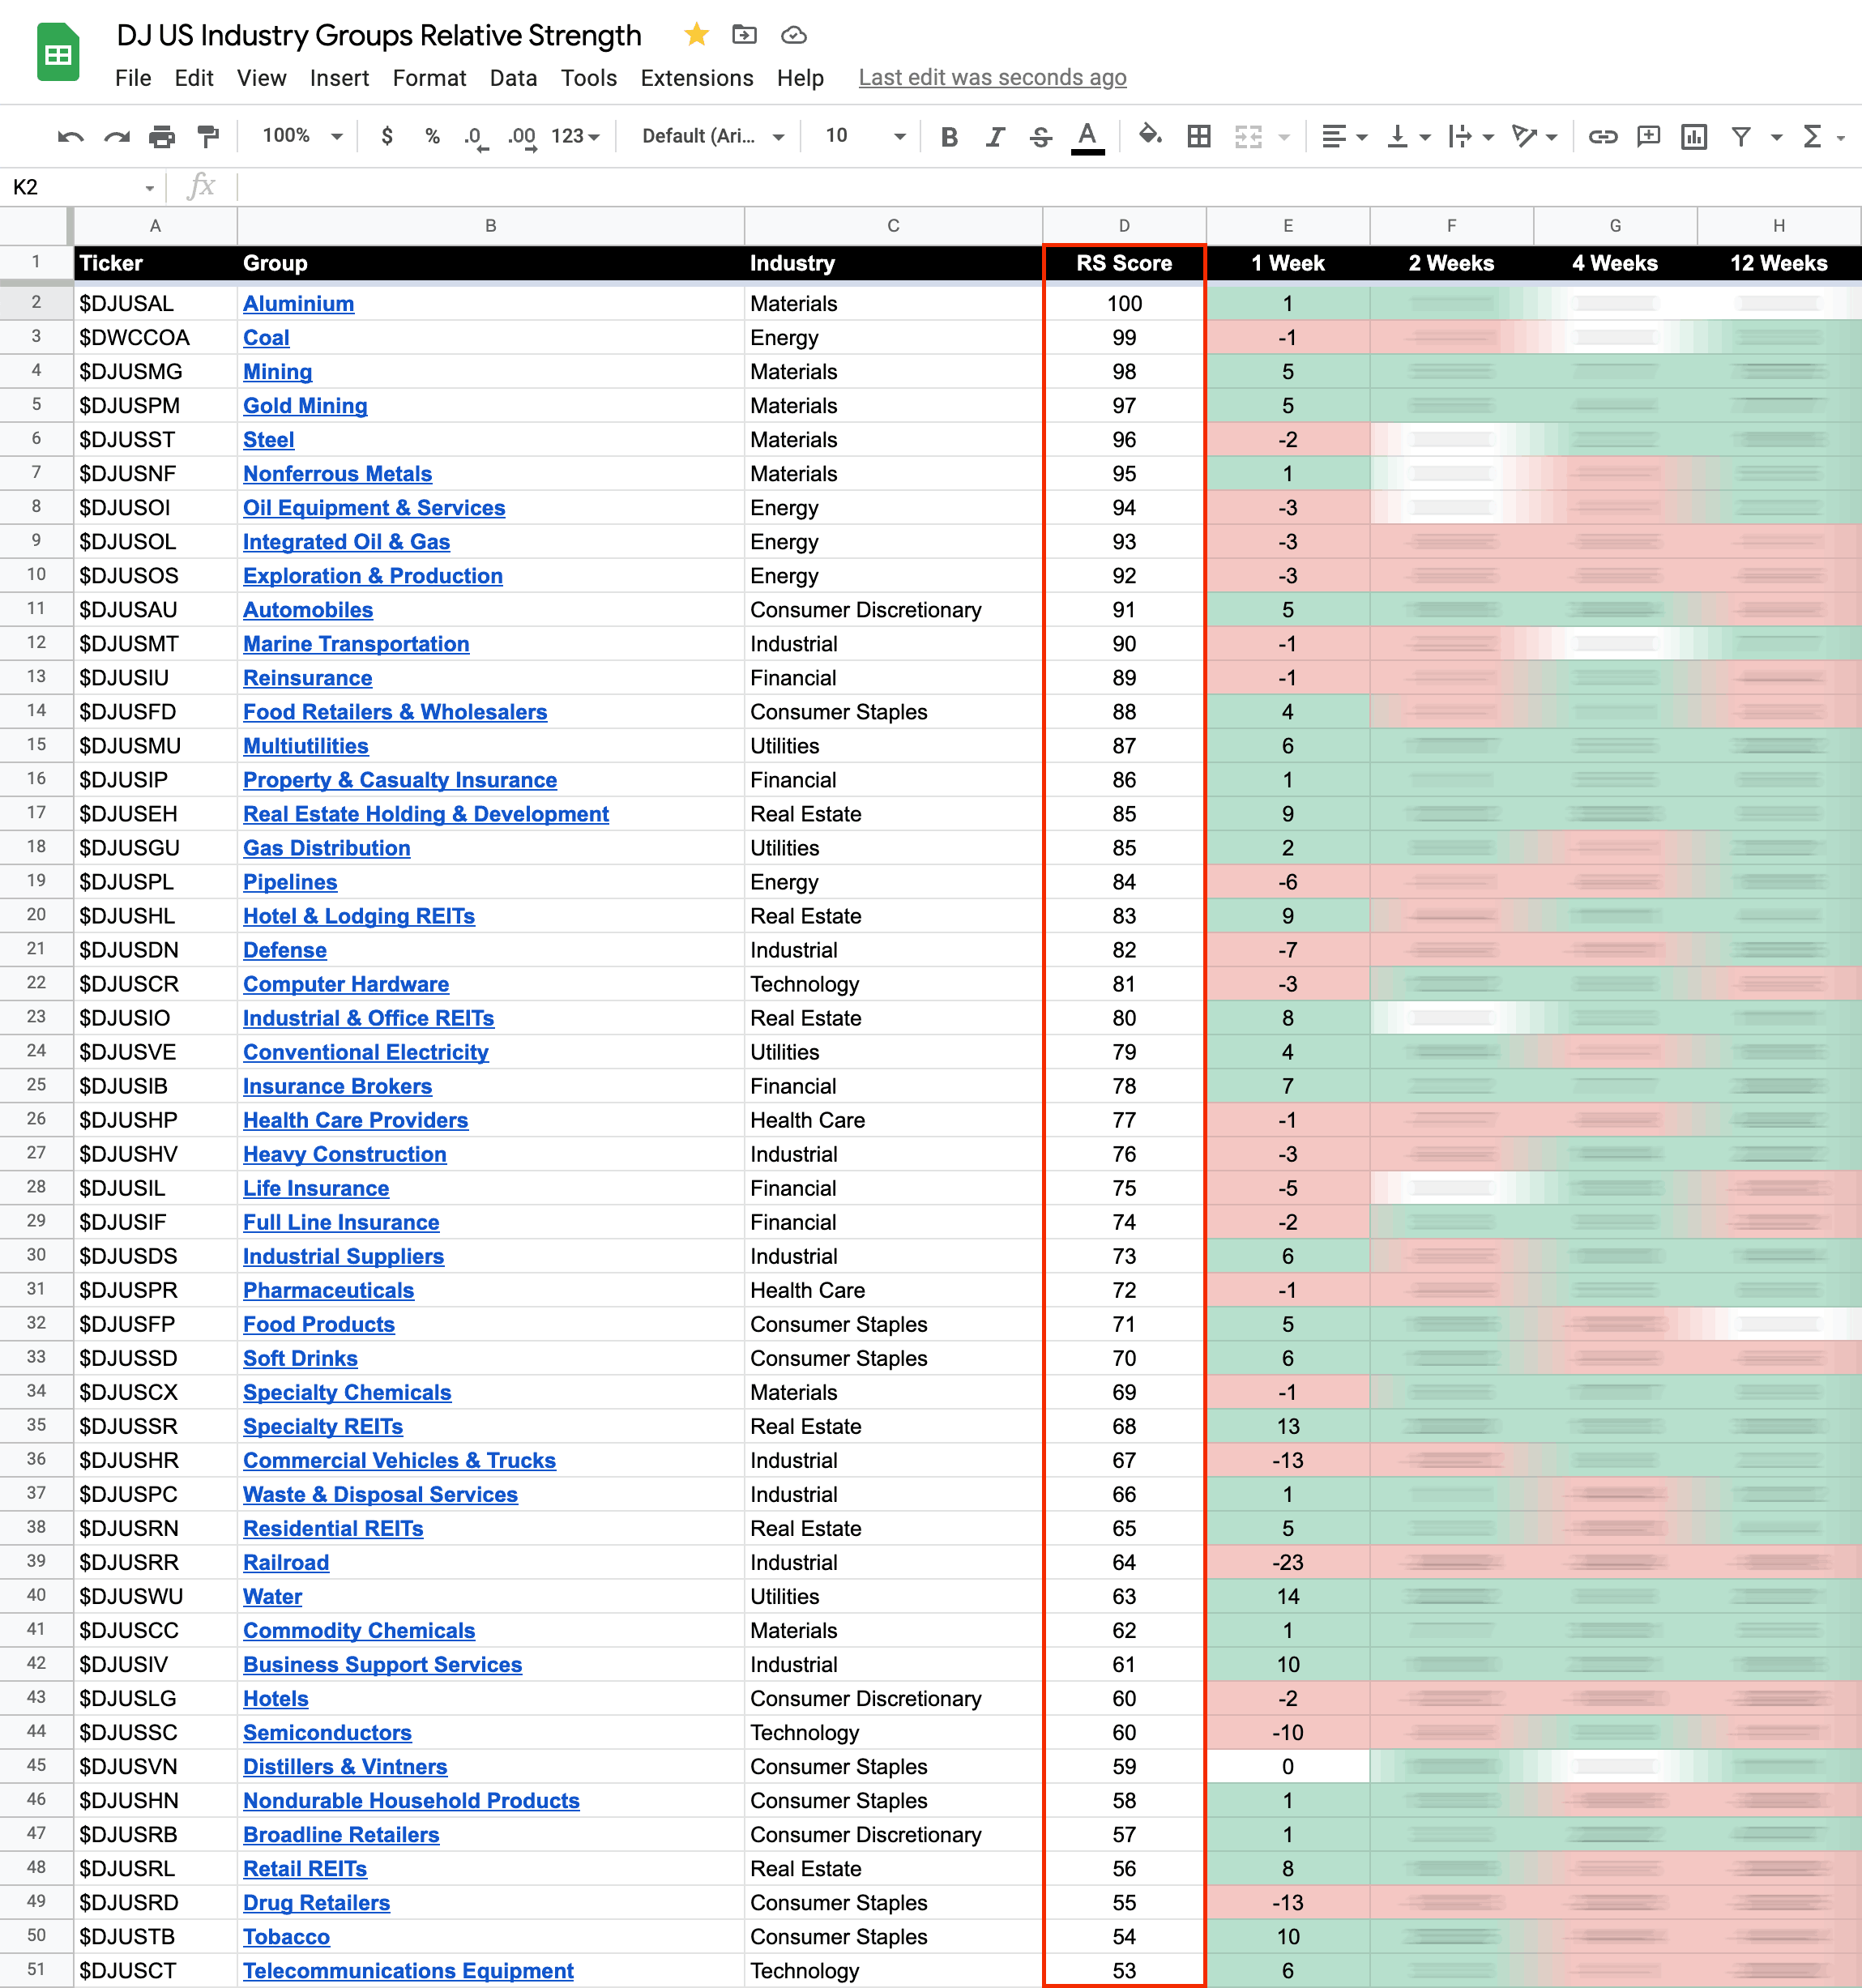
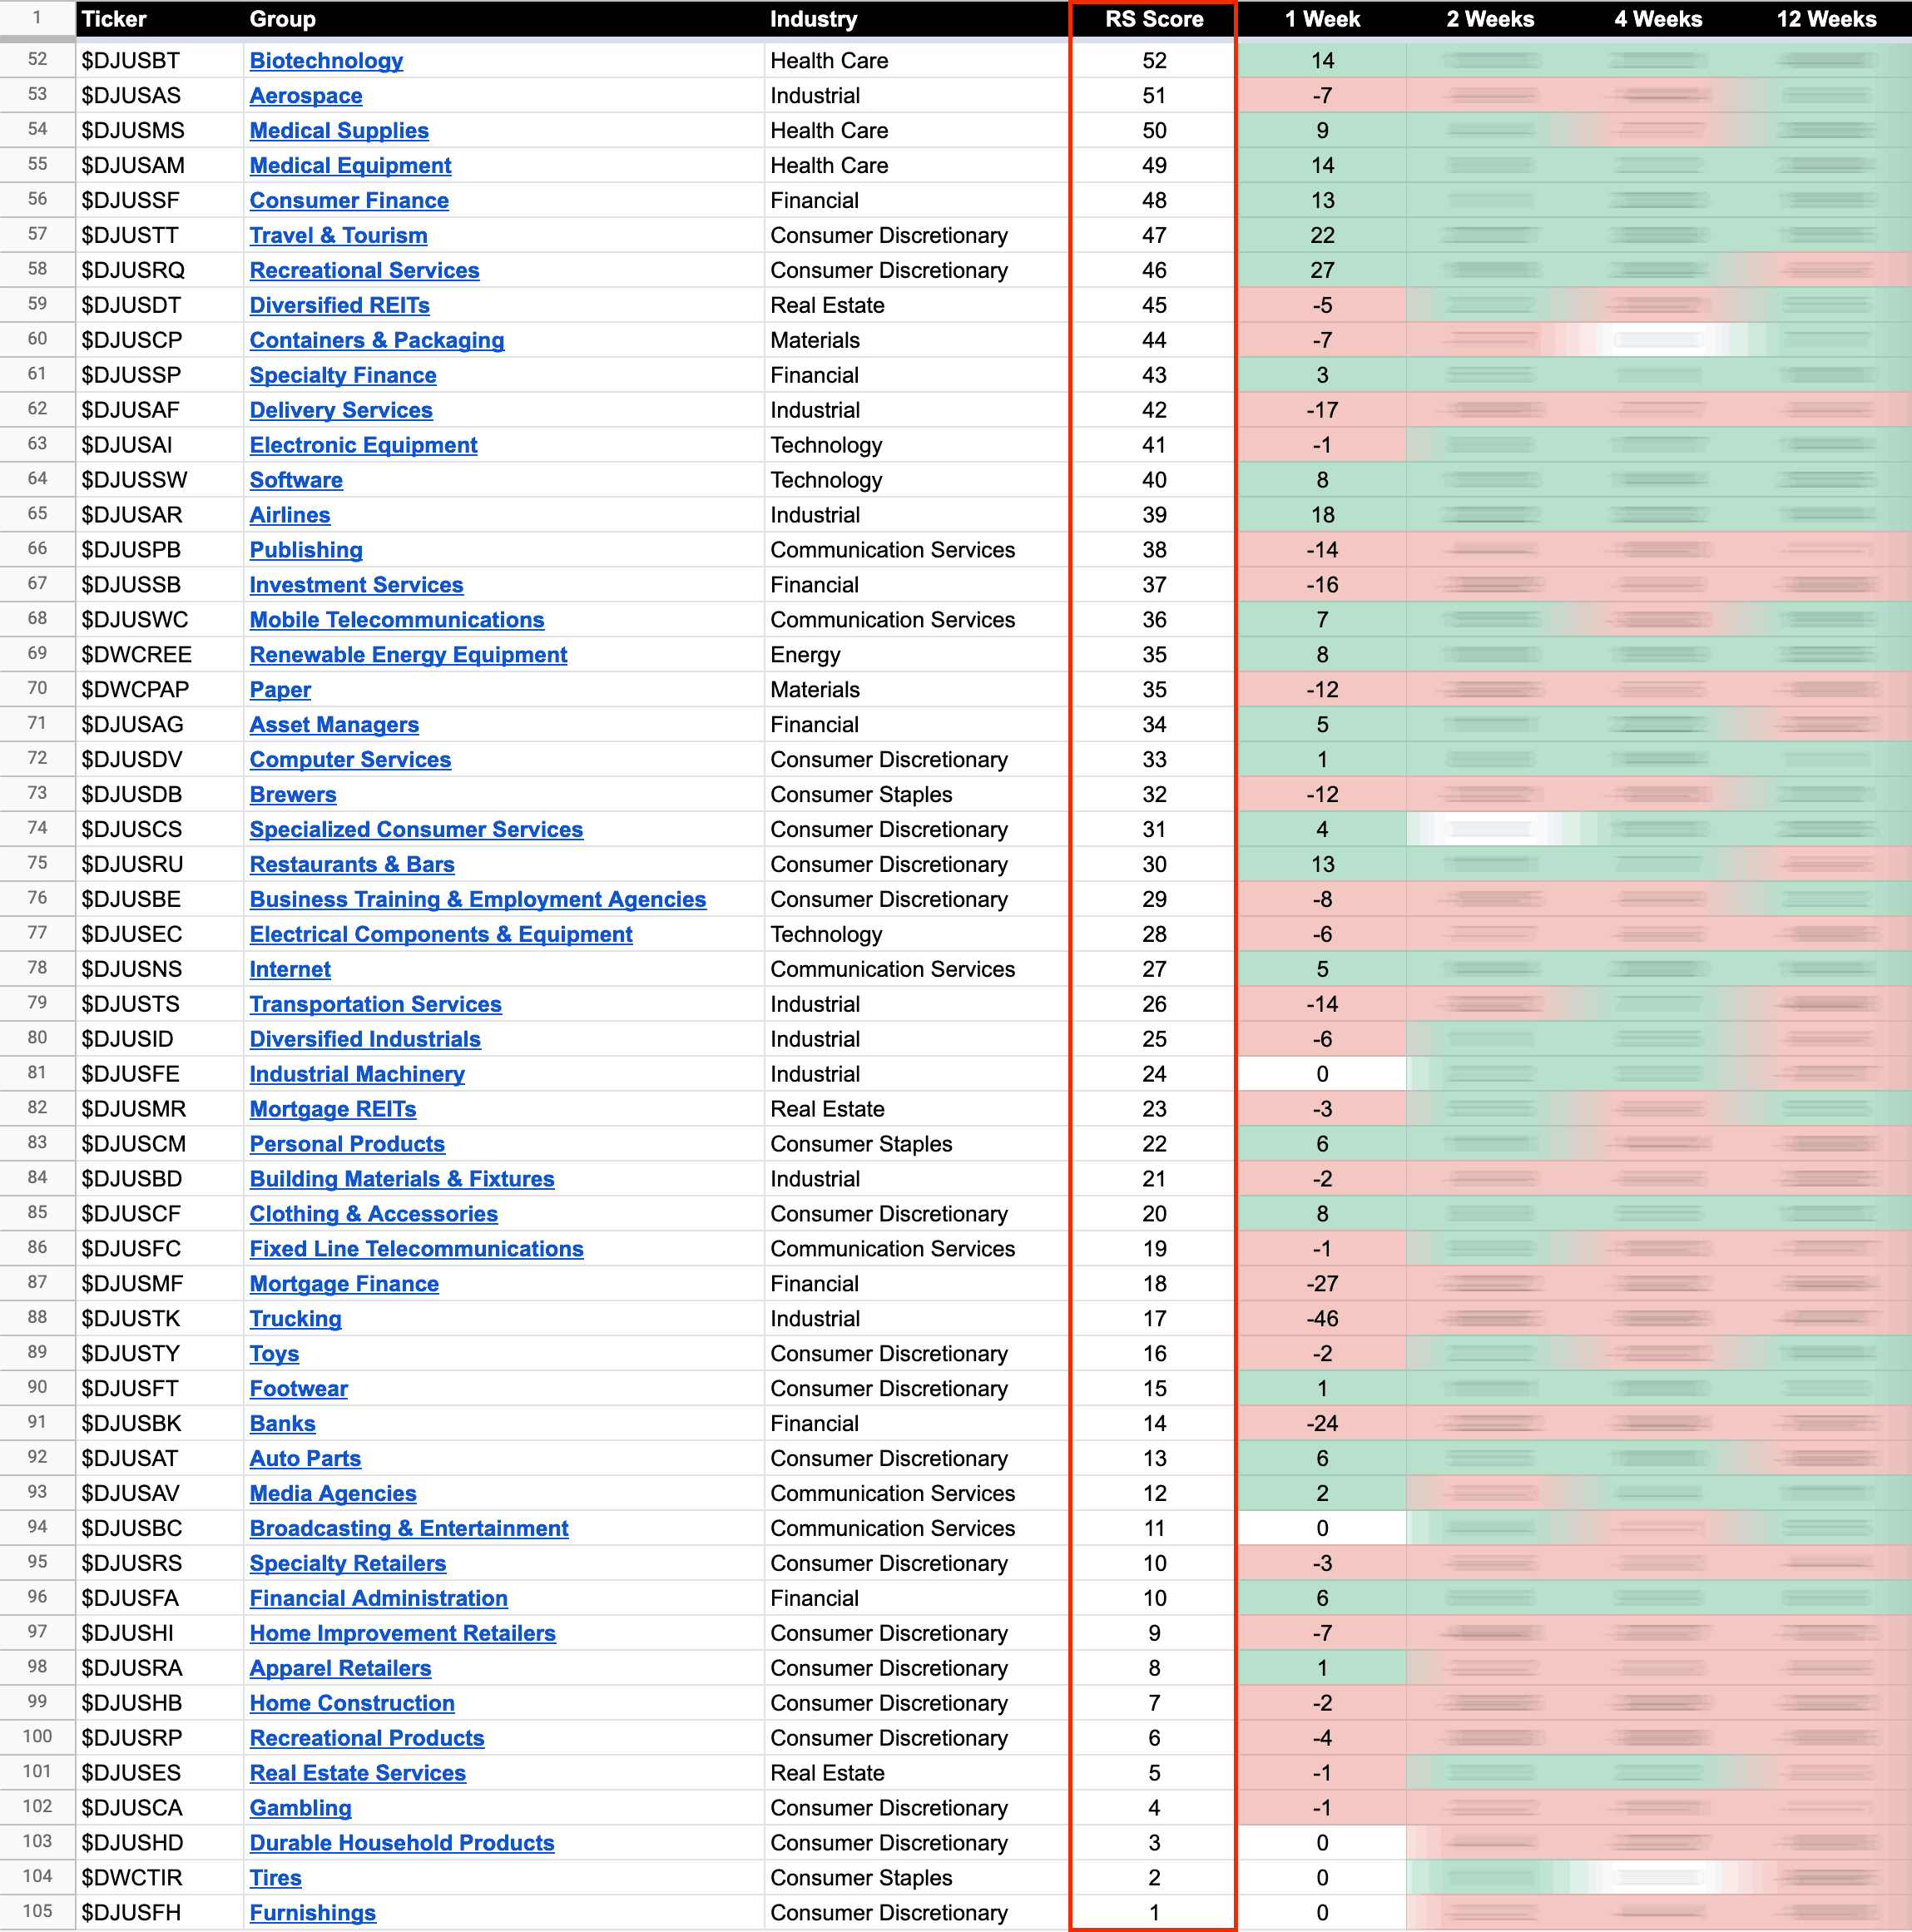
The purpose of the Relative Strength (RS) tables is to track the short, medium and long term RS changes of the individual groups to find the new leadership earlier than the crowd.
RS Score of 100 is the strongest, and 0 is the weakest.
In the Stage Analysis method we are looking to focus on the strongest groups, as what is strong, tends to stay strong for a long time. But we also want to find the improving / up and coming groups that are starting to rise up strongly through the RS table from the lower zone, in order to find the future leading stocks before they breakout from a Stage 1 base and move into a Stage 2 advancing phase.
Each week I go through the most interesting groups on the move in more detail during the Stage Analysis Members weekend video – as Industry Group analysis is a key part of Stan Weinstein's Stage Analysis method.
You can find out which stocks are in each industry group by going to https://stockcharts.com/freech... and clicking on the name of the group.
Disclaimer: For educational purpose only. Not investment advice. Seek professional advice from a financial advisor before making any investing decisions.