
Sector Breadth: Percentage of Technically Healthy Stocks
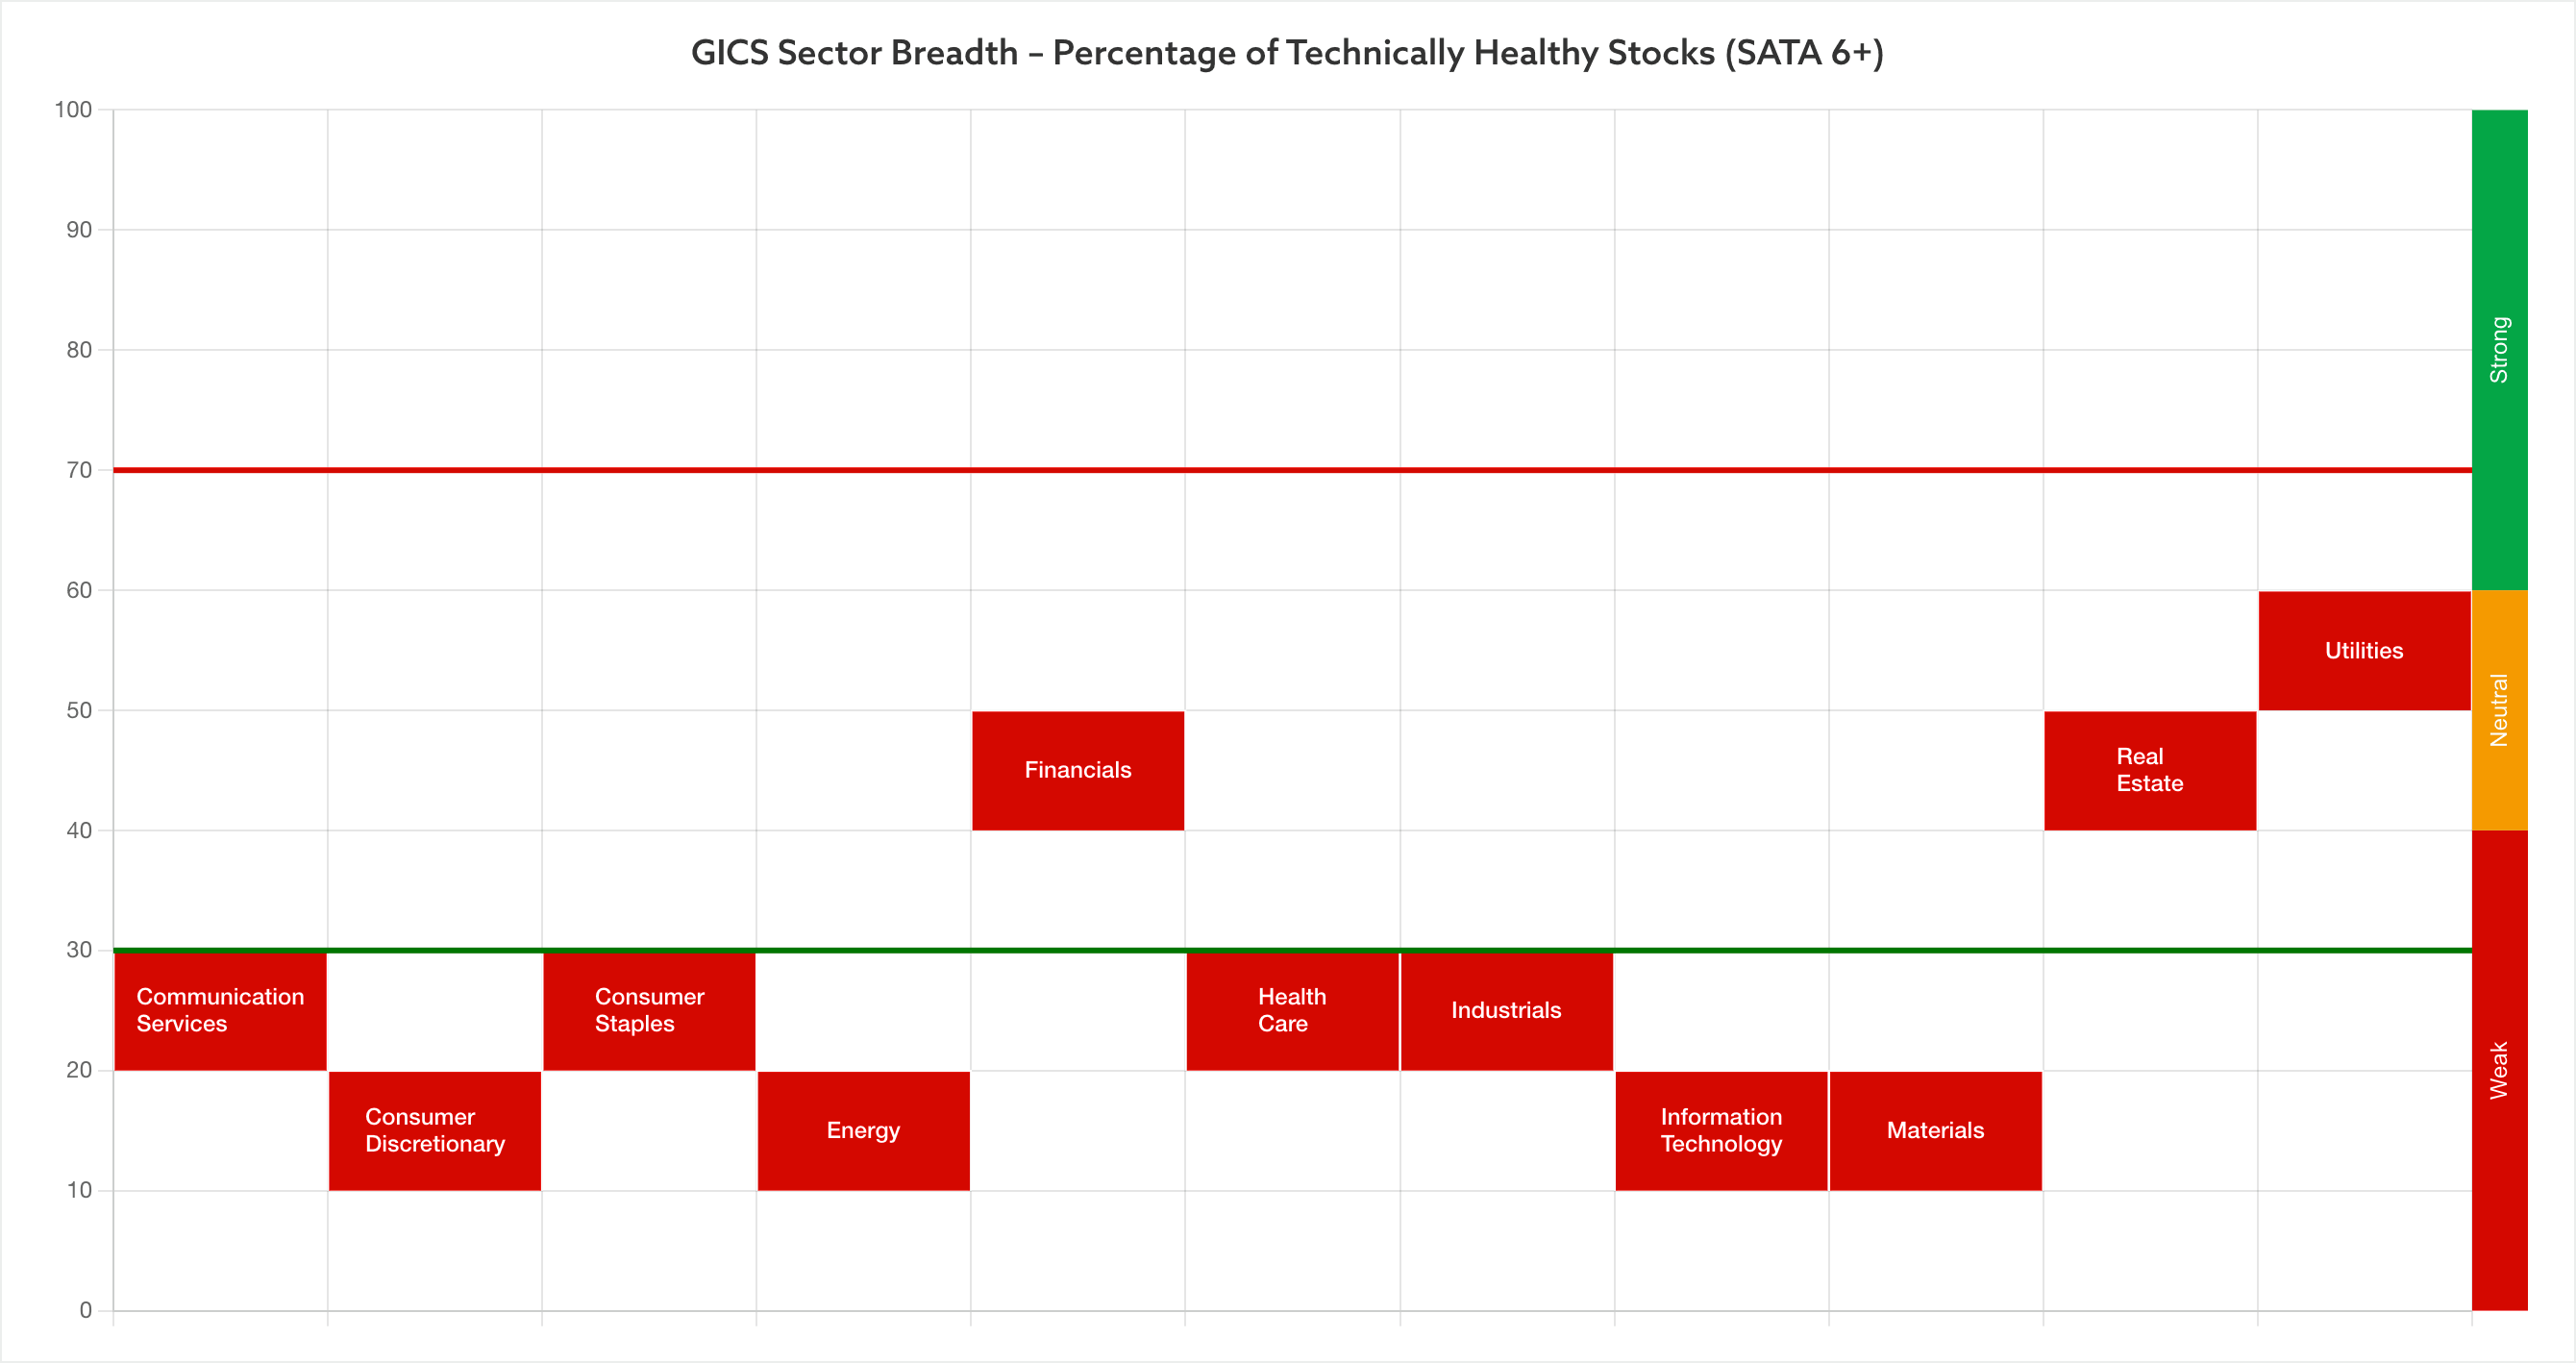
Average: 26.73% (-9.41% since the close last week)
- 0 sectors in (Strong) Stage 2 zone
- 3 sectors in (Neutral) Stage 1 / 3 zone (Utilities, Real Estate, Financials)
- 8 sectors in (Weak) Stage 4 zone (Industrials, Consumer Staples, Communication Services, Health Care, Consumer Discretionary, Materials, Information Technology, Energy)
Sample Size: 5024 stocks
The sector breadth has seen a steep drop over the past few weeks from overall neutral levels to weak levels. With numerous stocks collapsing into Stage 3 and Stage 4 declines. Almost all of the sectors are currently in a weaker position technically than they were a quarter ago, except for Real Estate. But even that hasn't escaped the current sell off, and had the strongest drop of all of the sectors today in terms of their technical attributes.
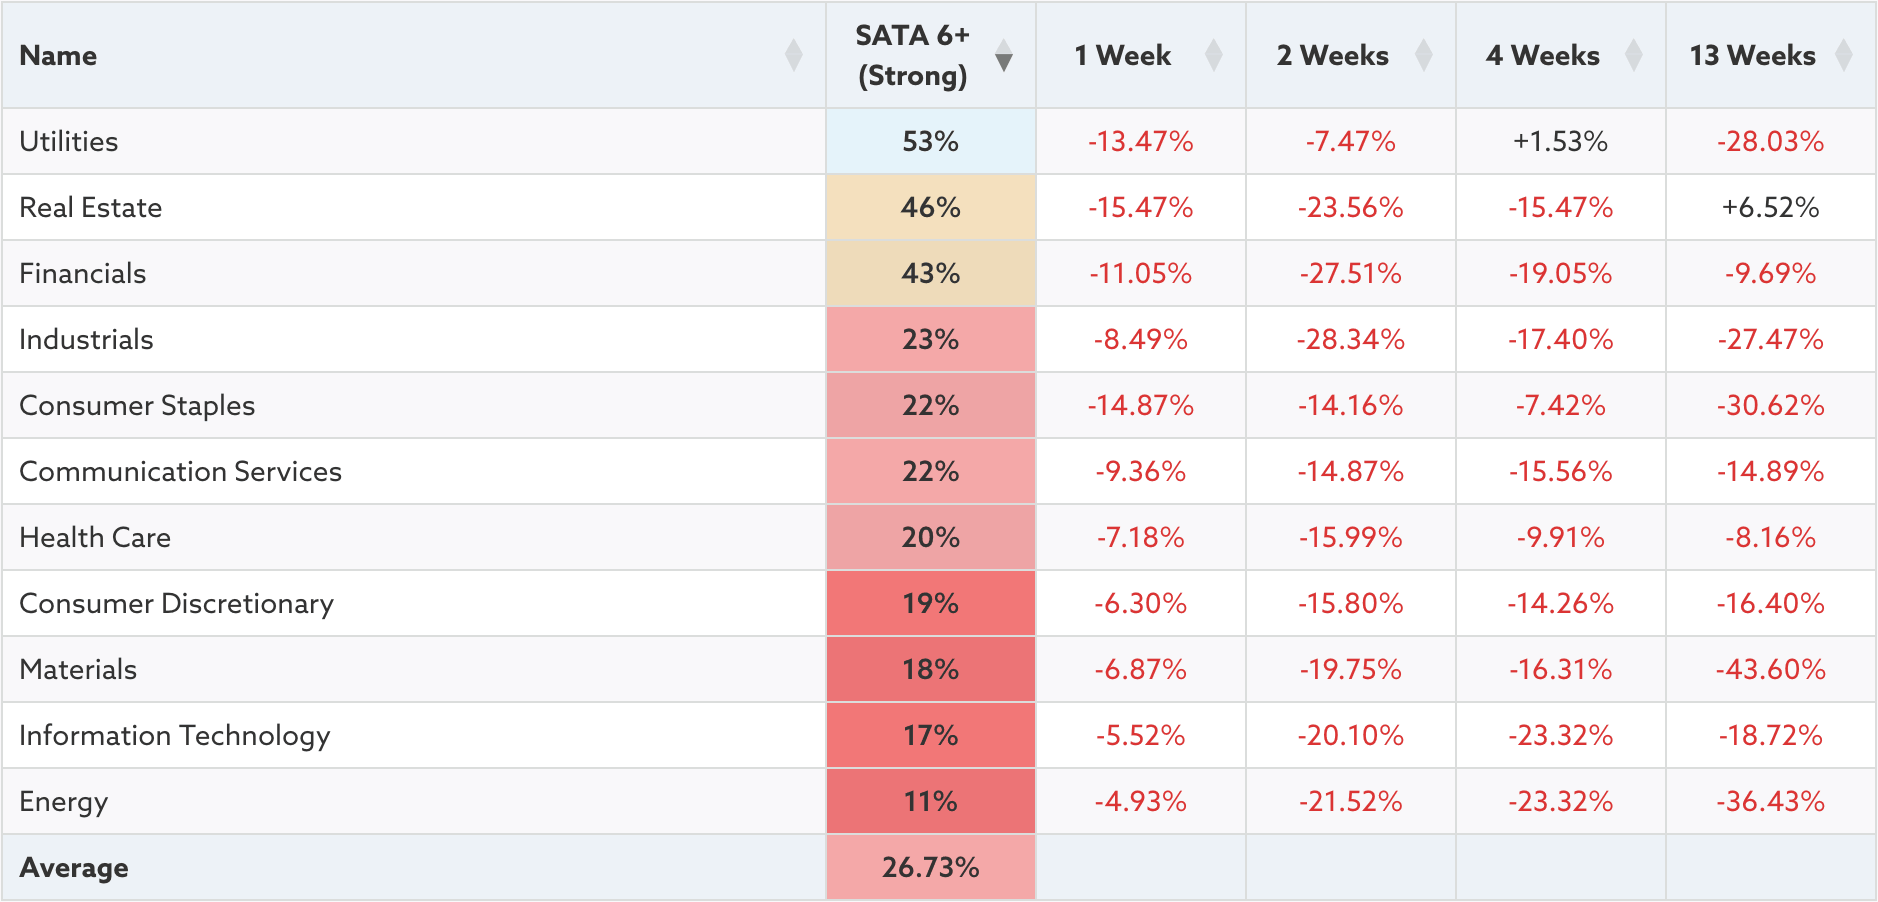
Sector Breadth Table – Ordered by Relative Strength
The table below shows the short-term changes in the Percentage of US Stocks that are technically healthy
Sector Breadth Charts
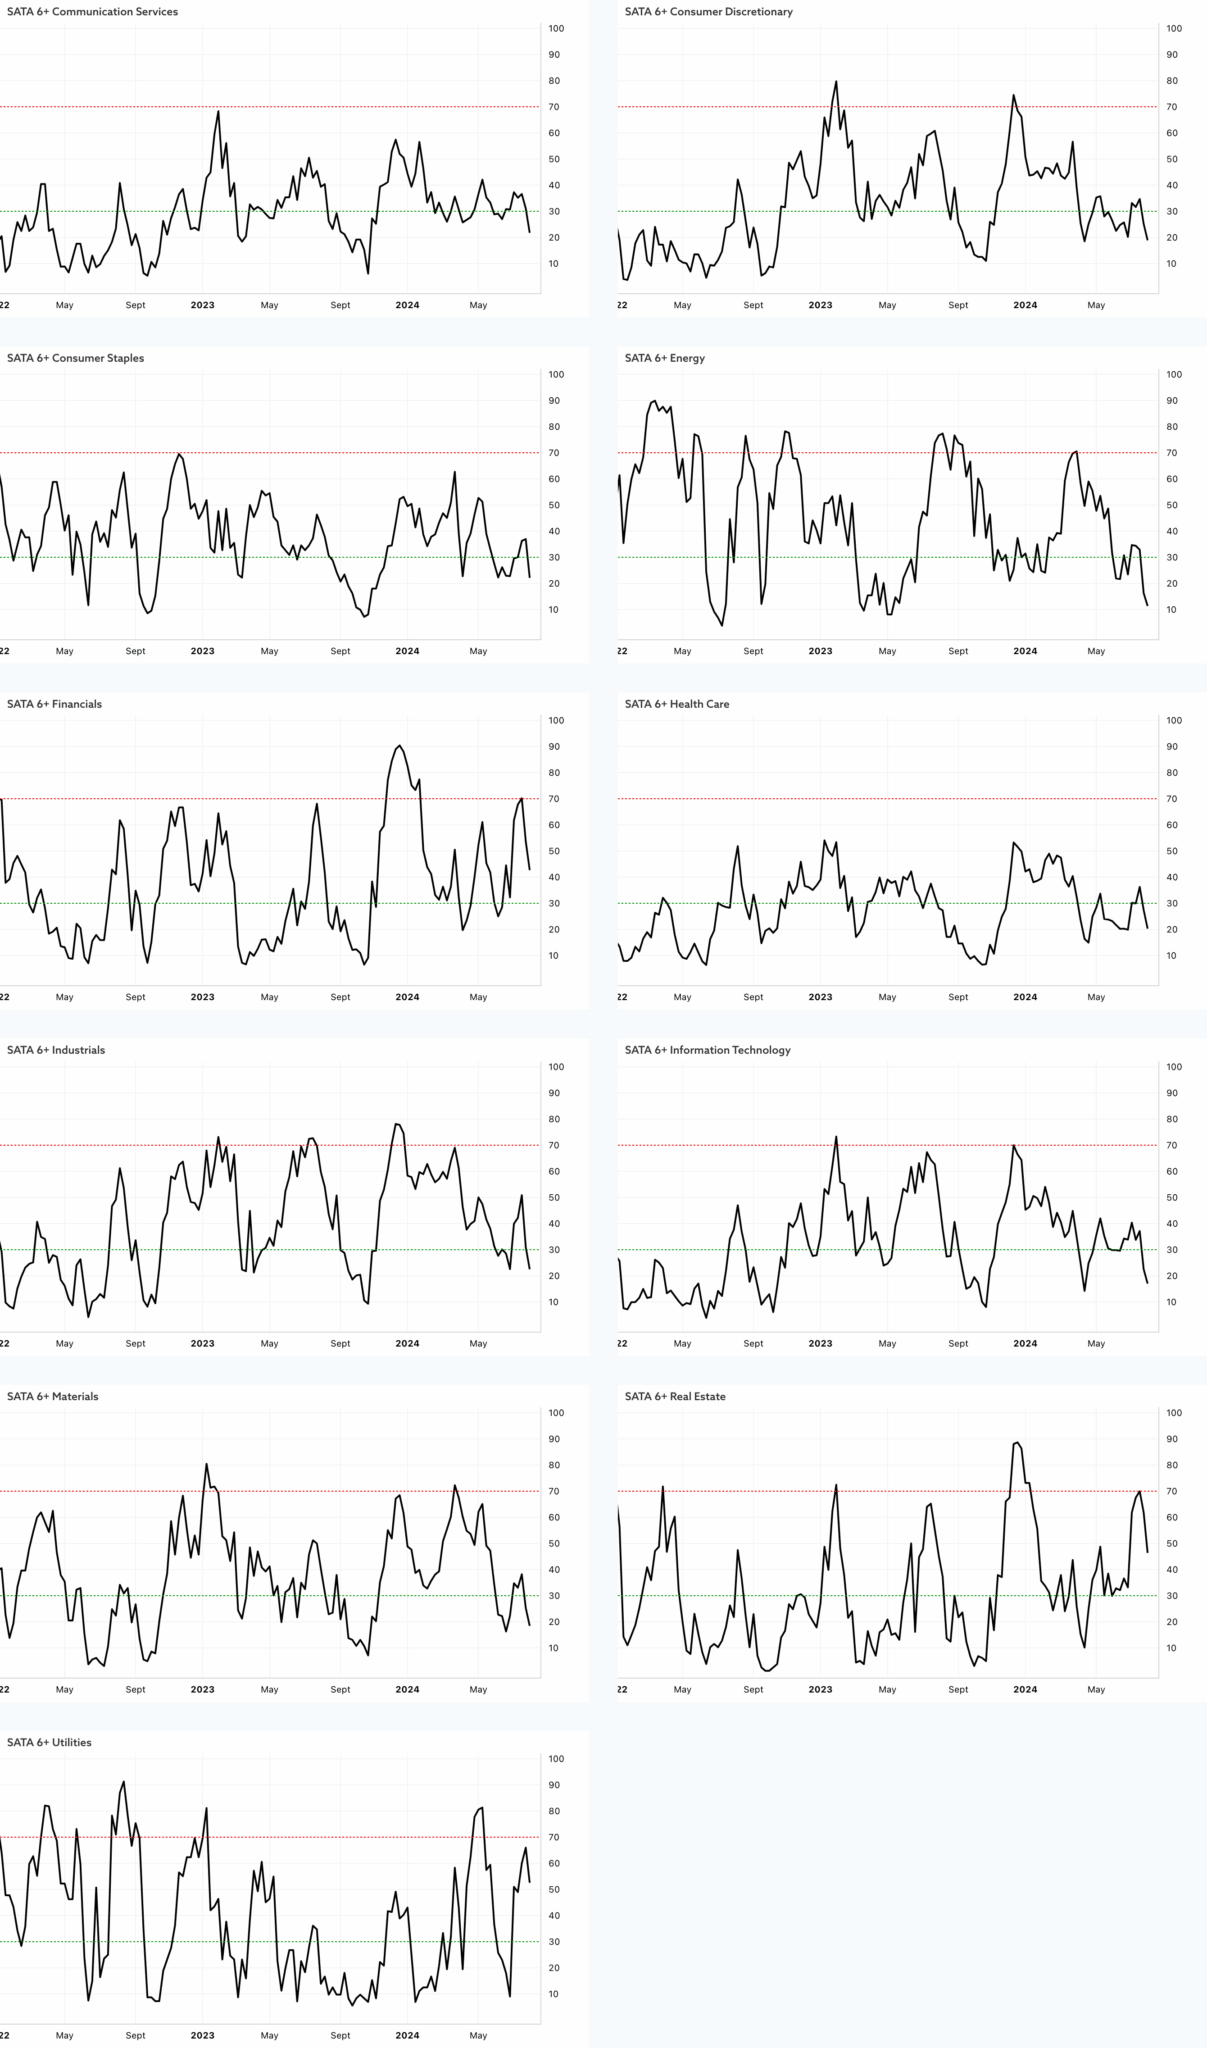
The Sector Breadth data is updated daily on the Stage Analysis website a few hours after the close, and is available on the GICS Sectors page for members, along with the individual charts and links to the component stocks of each sector.
Become a Stage Analysis Member:
To see more like this – US Stocks watchlist posts, detailed videos each weekend, use our unique Stage Analysis tools, such as the US Stocks & ETFs Screener, Charts, Market Breadth, Group Relative Strength and more...
Join Today
Disclaimer: For educational purpose only. Not investment advice. Seek professional advice from a financial advisor before making any investing decisions.