
Market Breadth: Percentage of Stocks Above their 50 Day, 150 Day & 200 Day Moving Averages Combined
The full post is available to view by members only. For immediate access:
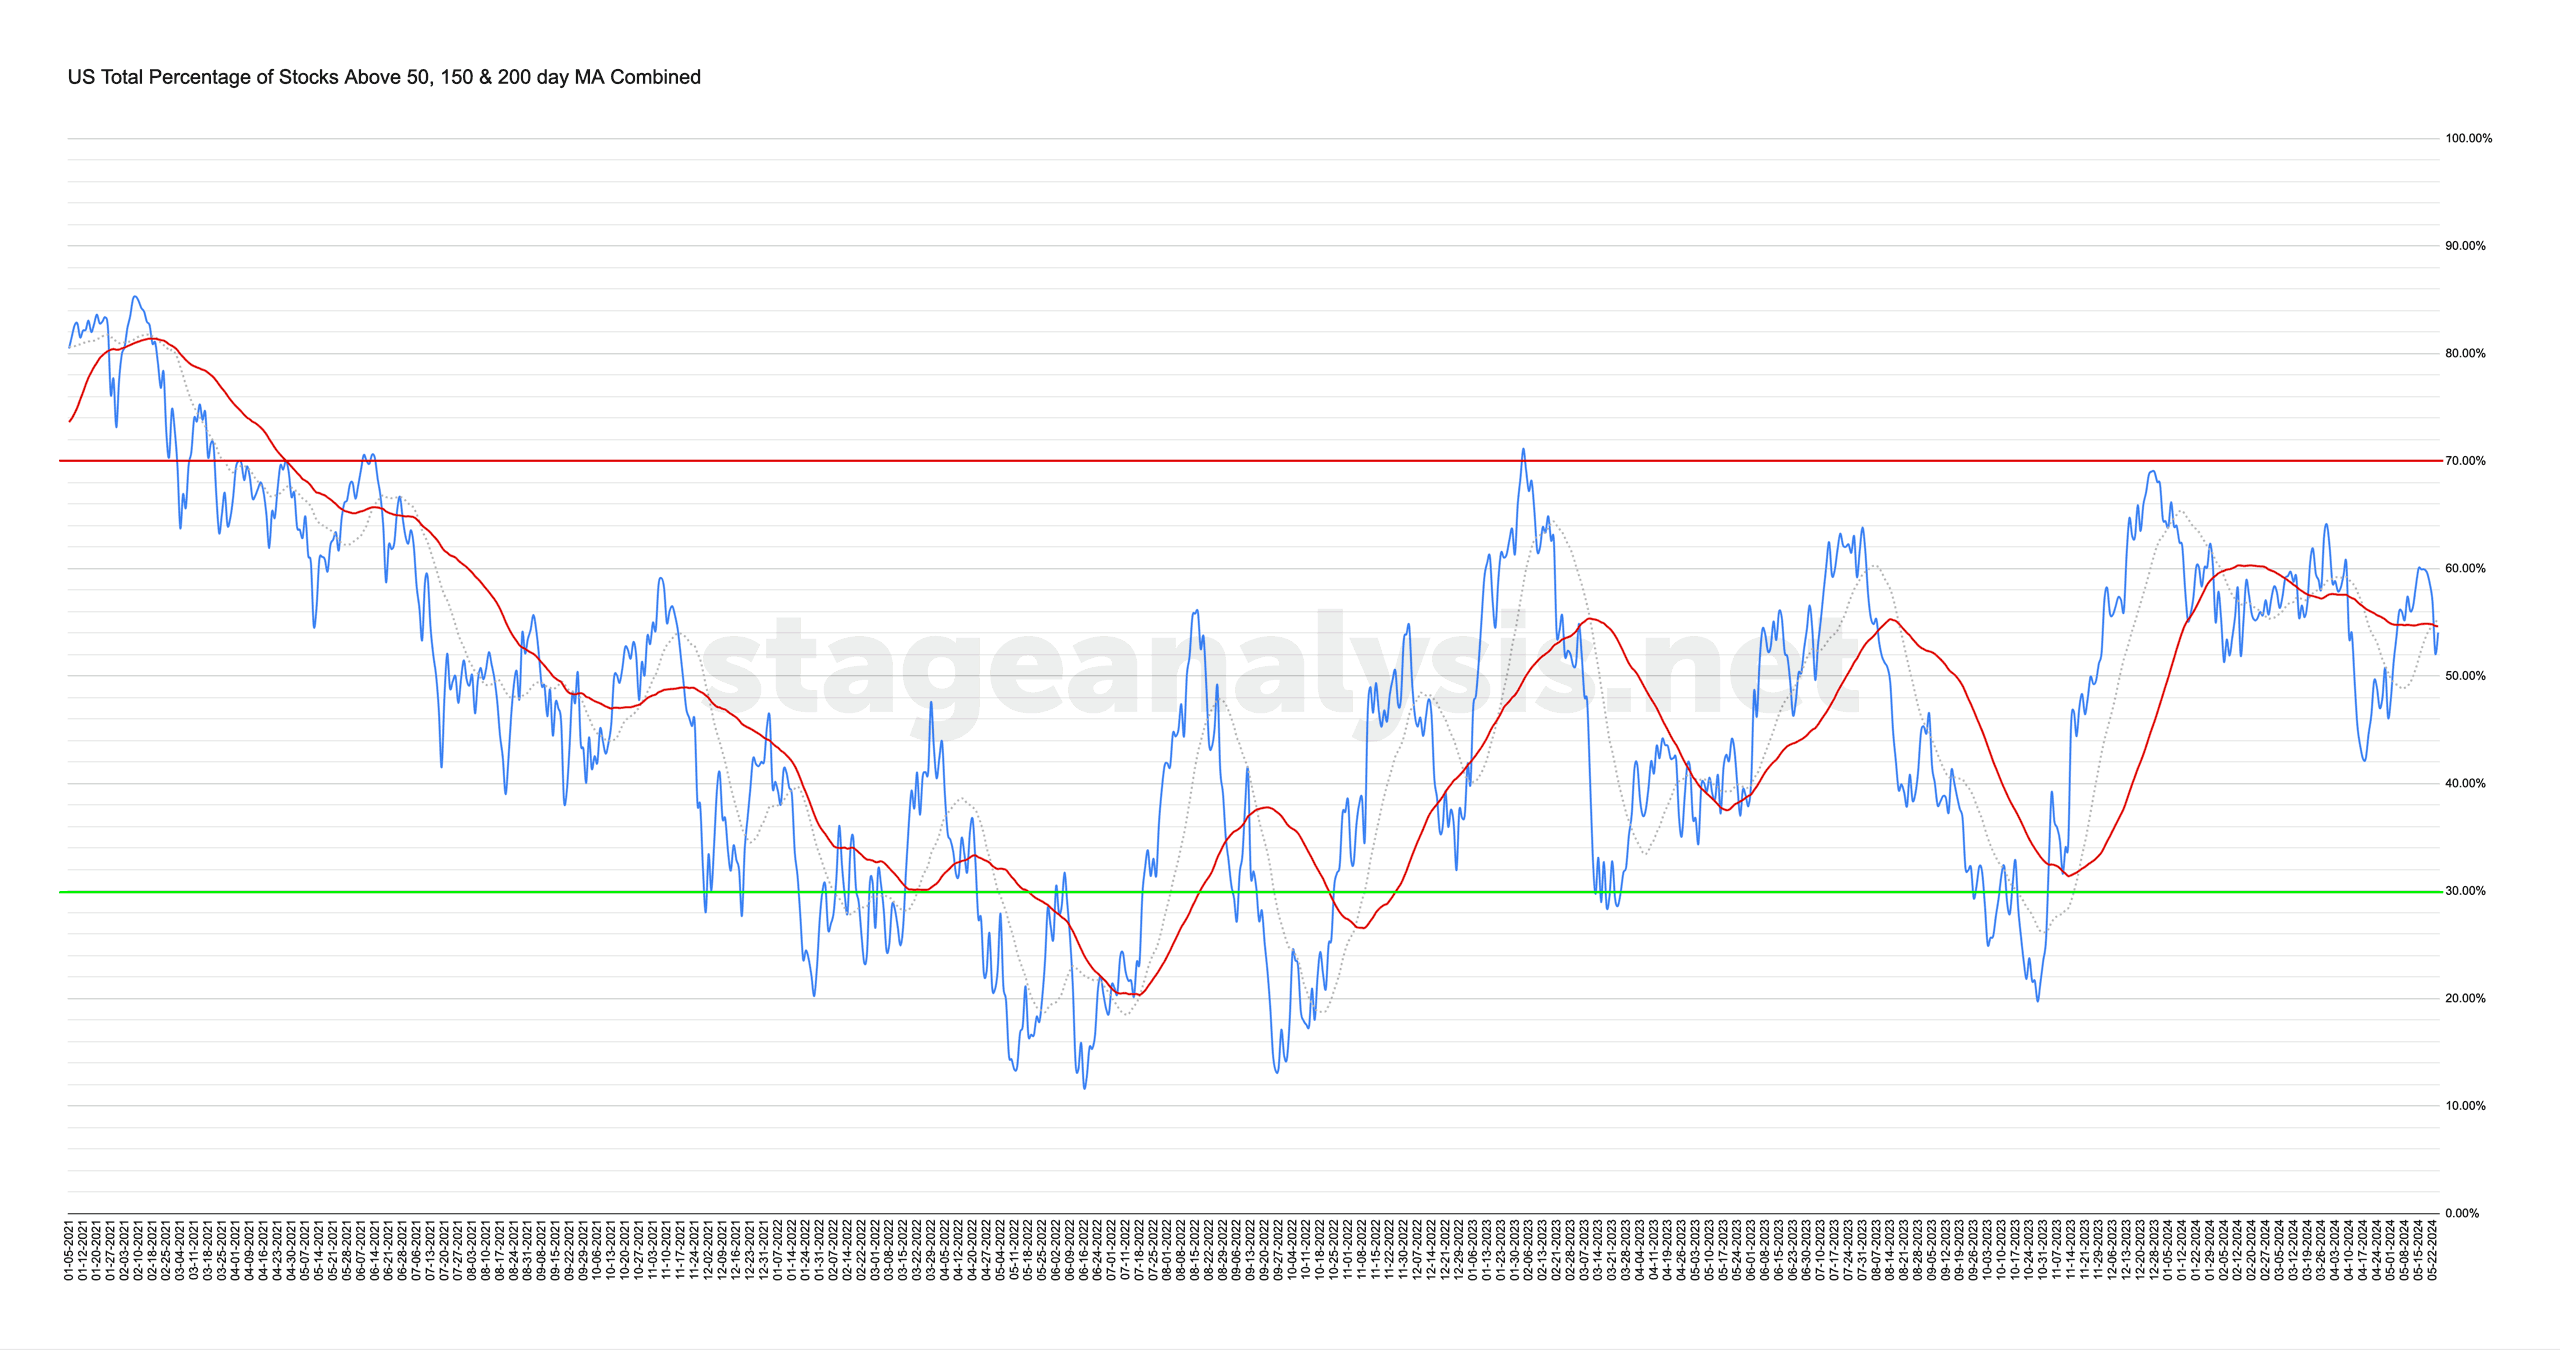
54.04% (-5.88% 1wk)
Status: Neutral Environment (status change)
The US Total Percentage of Stocks above their 50 Day, 150 Day & 200 Day Moving Averages (shown above) decreased by -5.88% this week.
Therefore, the overall combined average is at 54.04% in the US market (NYSE and Nasdaq markets combined) above their short, medium and long term moving averages.
The combined average had a sharp decline this week, dropping back close to -8% by the end of Thursday, before a minor bounce on Friday to close down by -5.88% for the week. So it moved below its 20 day MA and 50 day MA (signal line), and hence the status technically has changed to Difficult, but, with the proximity to the moving averages, and them to each other, I'm modifying that to Neutral, unless Thursdays low in the combined average is broken below. As there's no clear trend in the data currently.
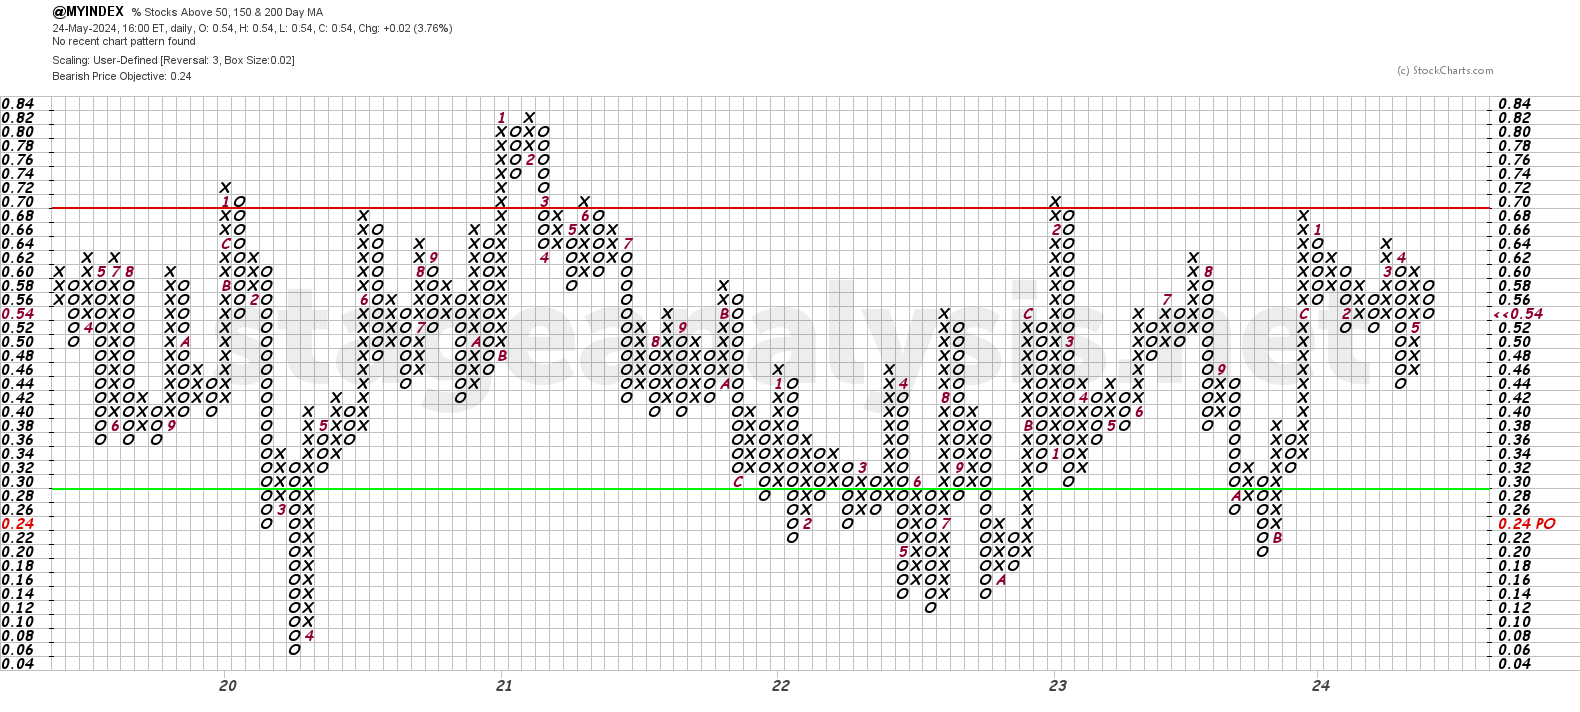
The Point and Figure (P&F) chart (shown above) reversed to a columns of Os, dropping 3 boxes this week, which changes the P&F strategy to Defense (as it is in a column of Os), and the P&F status changed to Bear Confirmed status in the middle of the playing field, as the double bottom breakdown from April is the last P&F signal. So reverts to that.
See the Bullish Percent article for more information on the P&F statuses.
Become a Stage Analysis Member:
To see more like this – US Stocks watchlist posts, detailed videos each weekend, use our unique Stage Analysis tools, such as the US Stocks & ETFs Screener, Charts, Market Breadth, Group Relative Strength and more...
Join Today
Disclaimer: For educational purpose only. Not investment advice. Seek professional advice from a financial advisor before making any investing decisions.