
US Stocks Watchlist – 25 April 2024
The full post is available to view by members only. For immediate access:
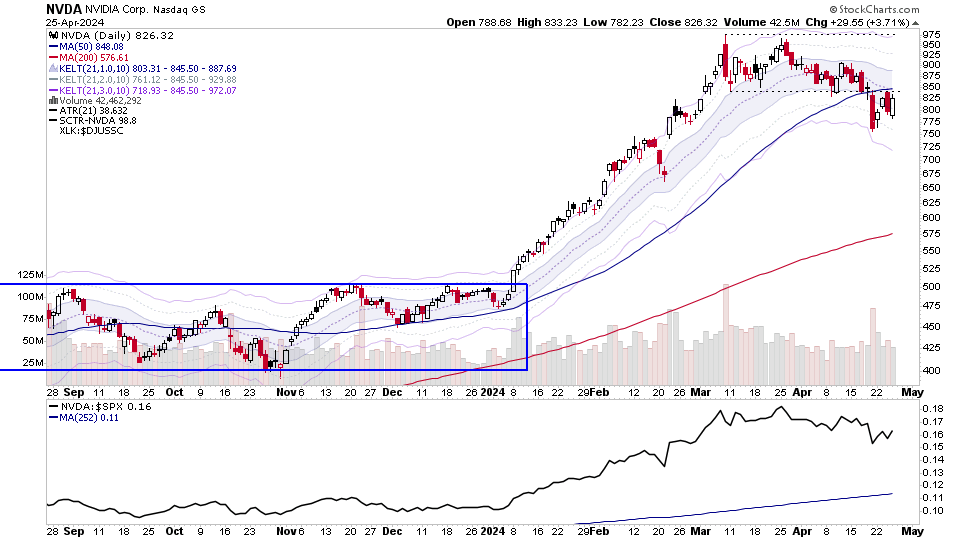
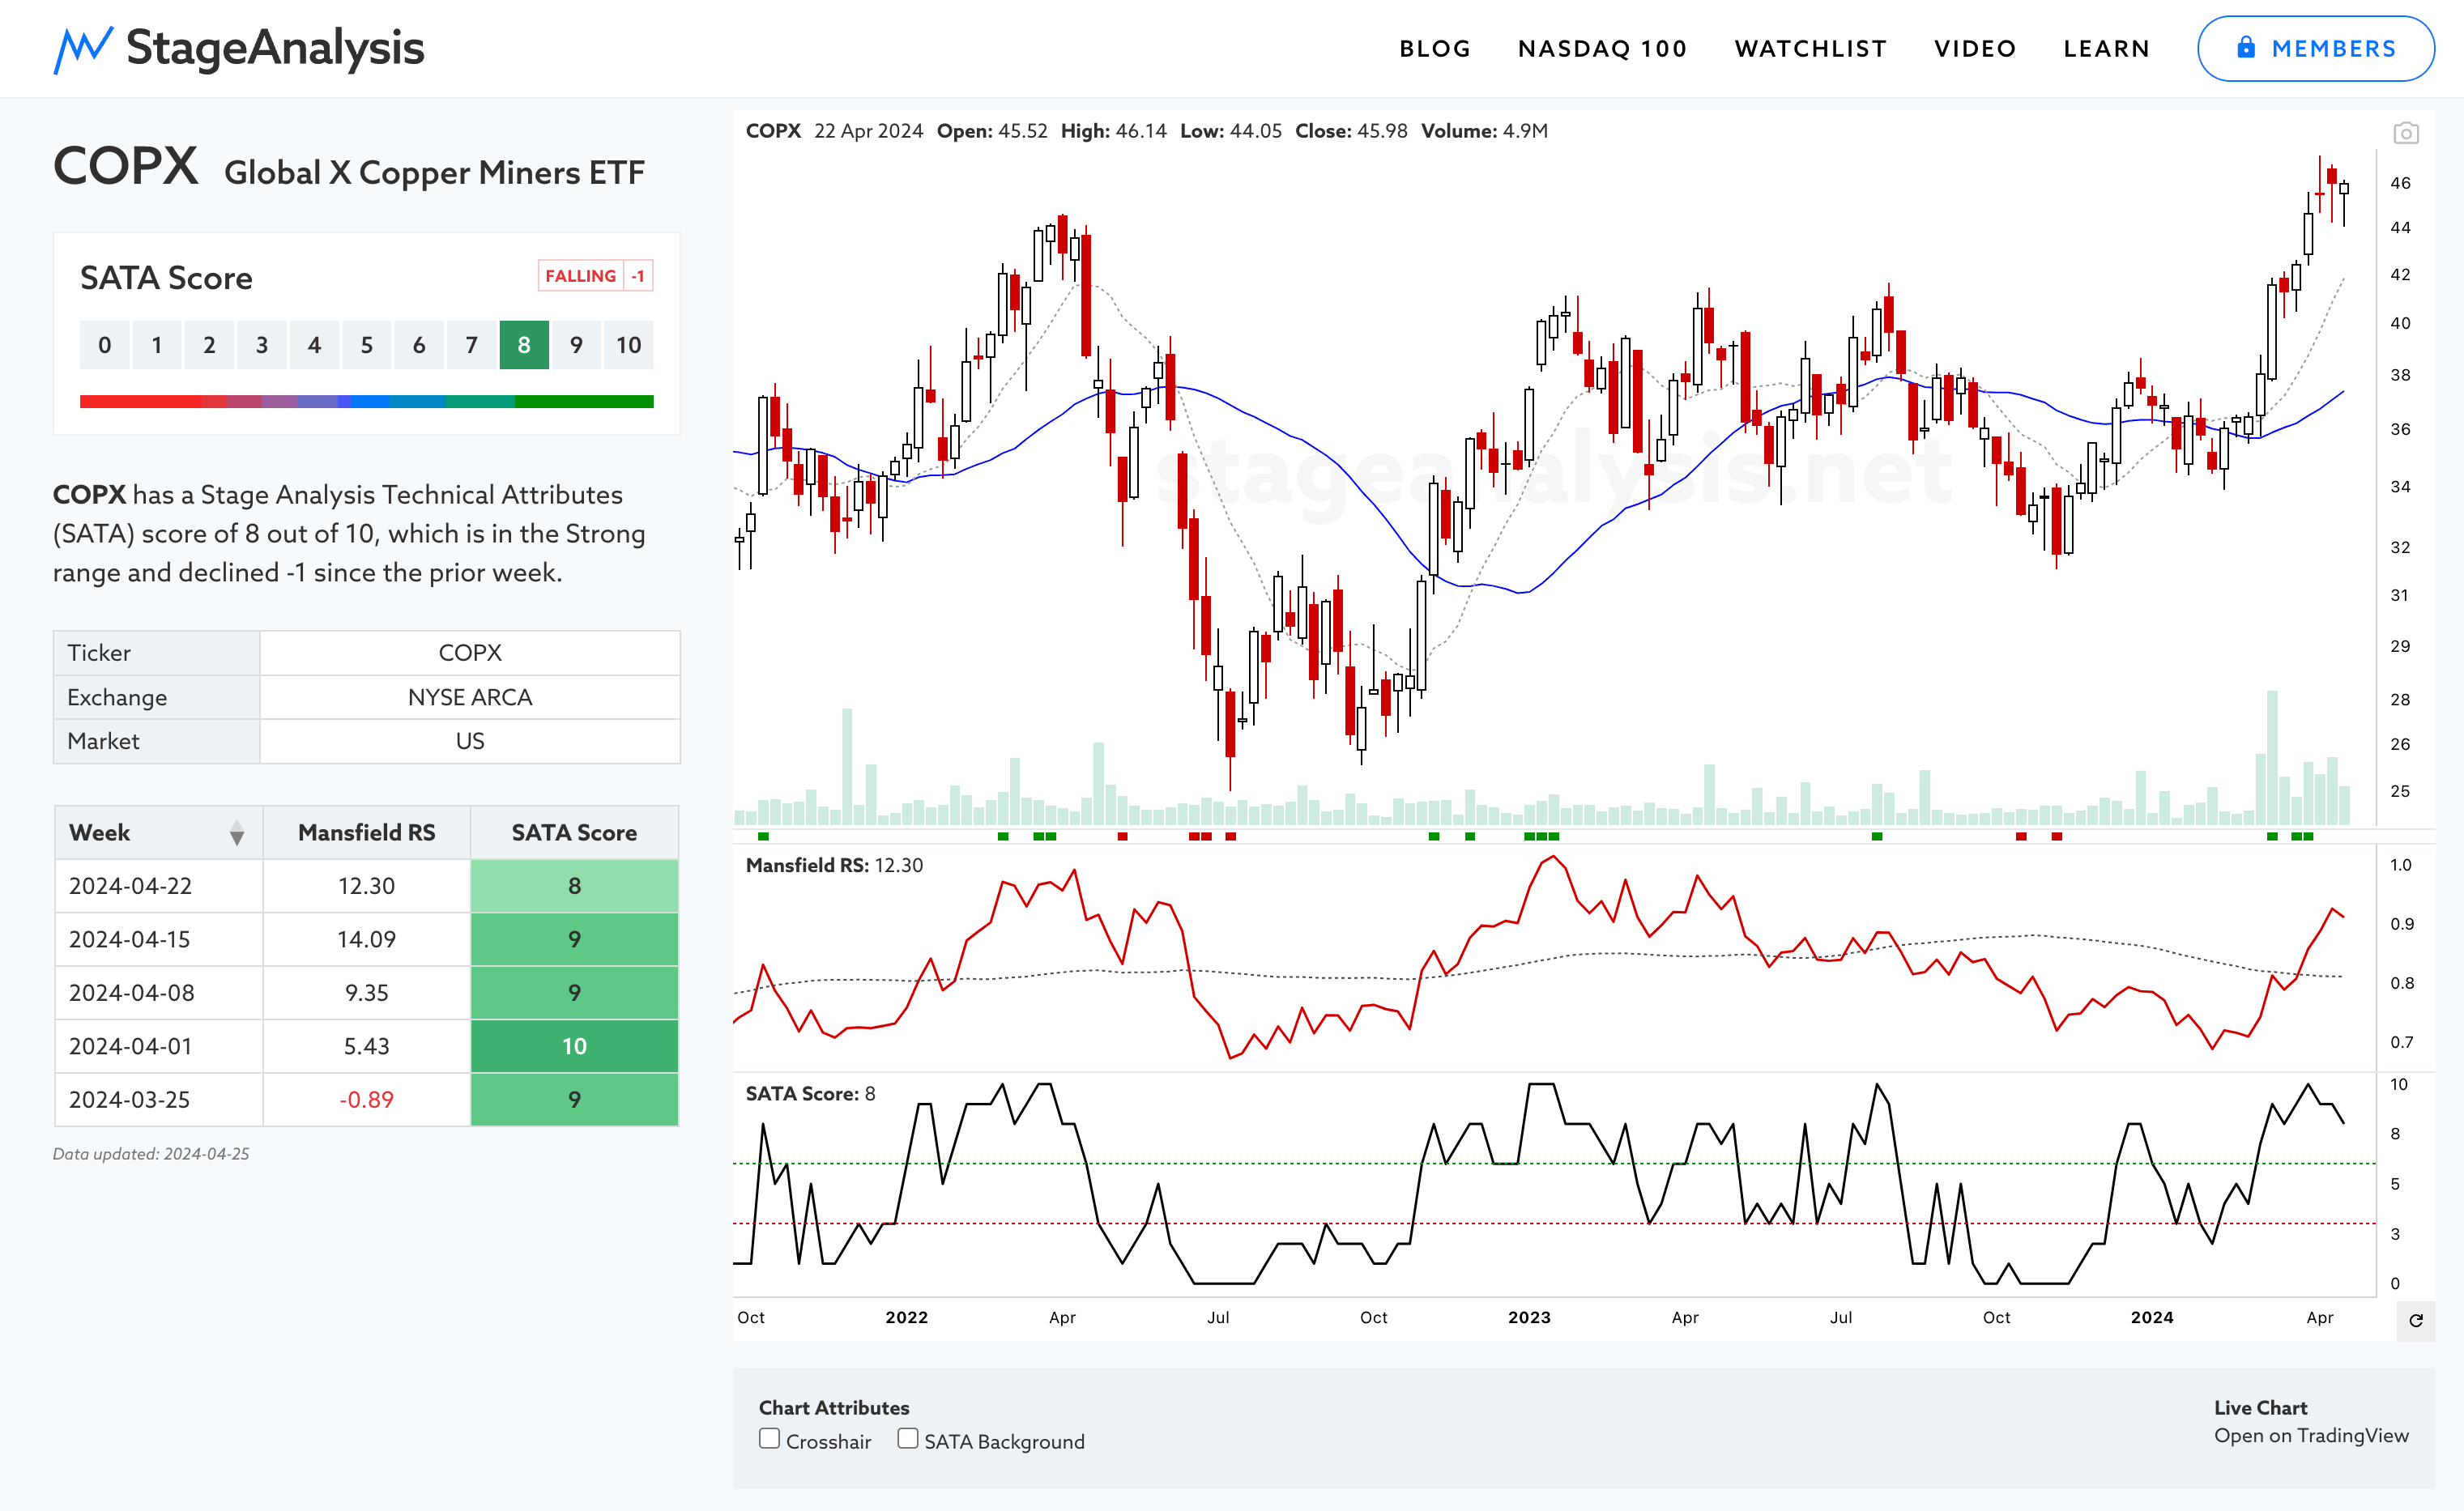
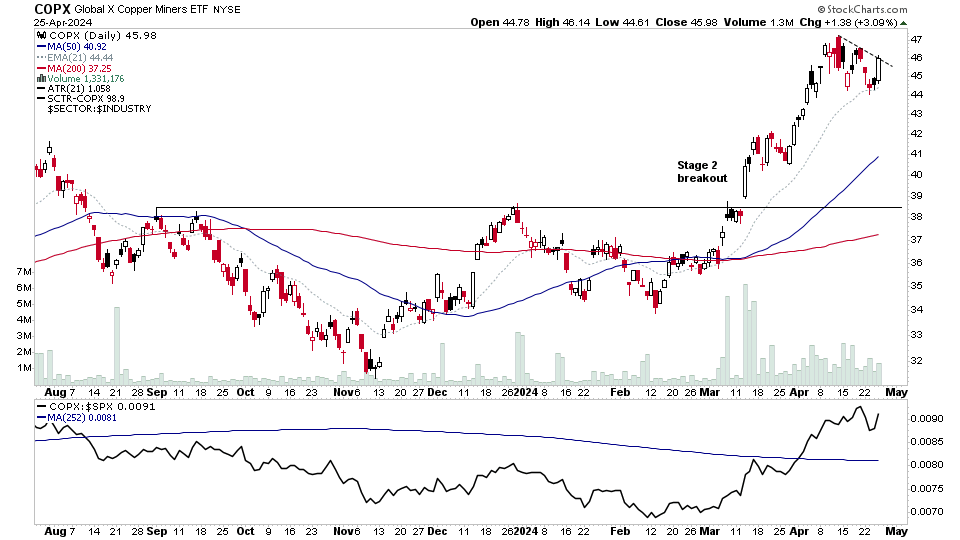
There were 23 stocks highlighted from the US stocks watchlist scans today
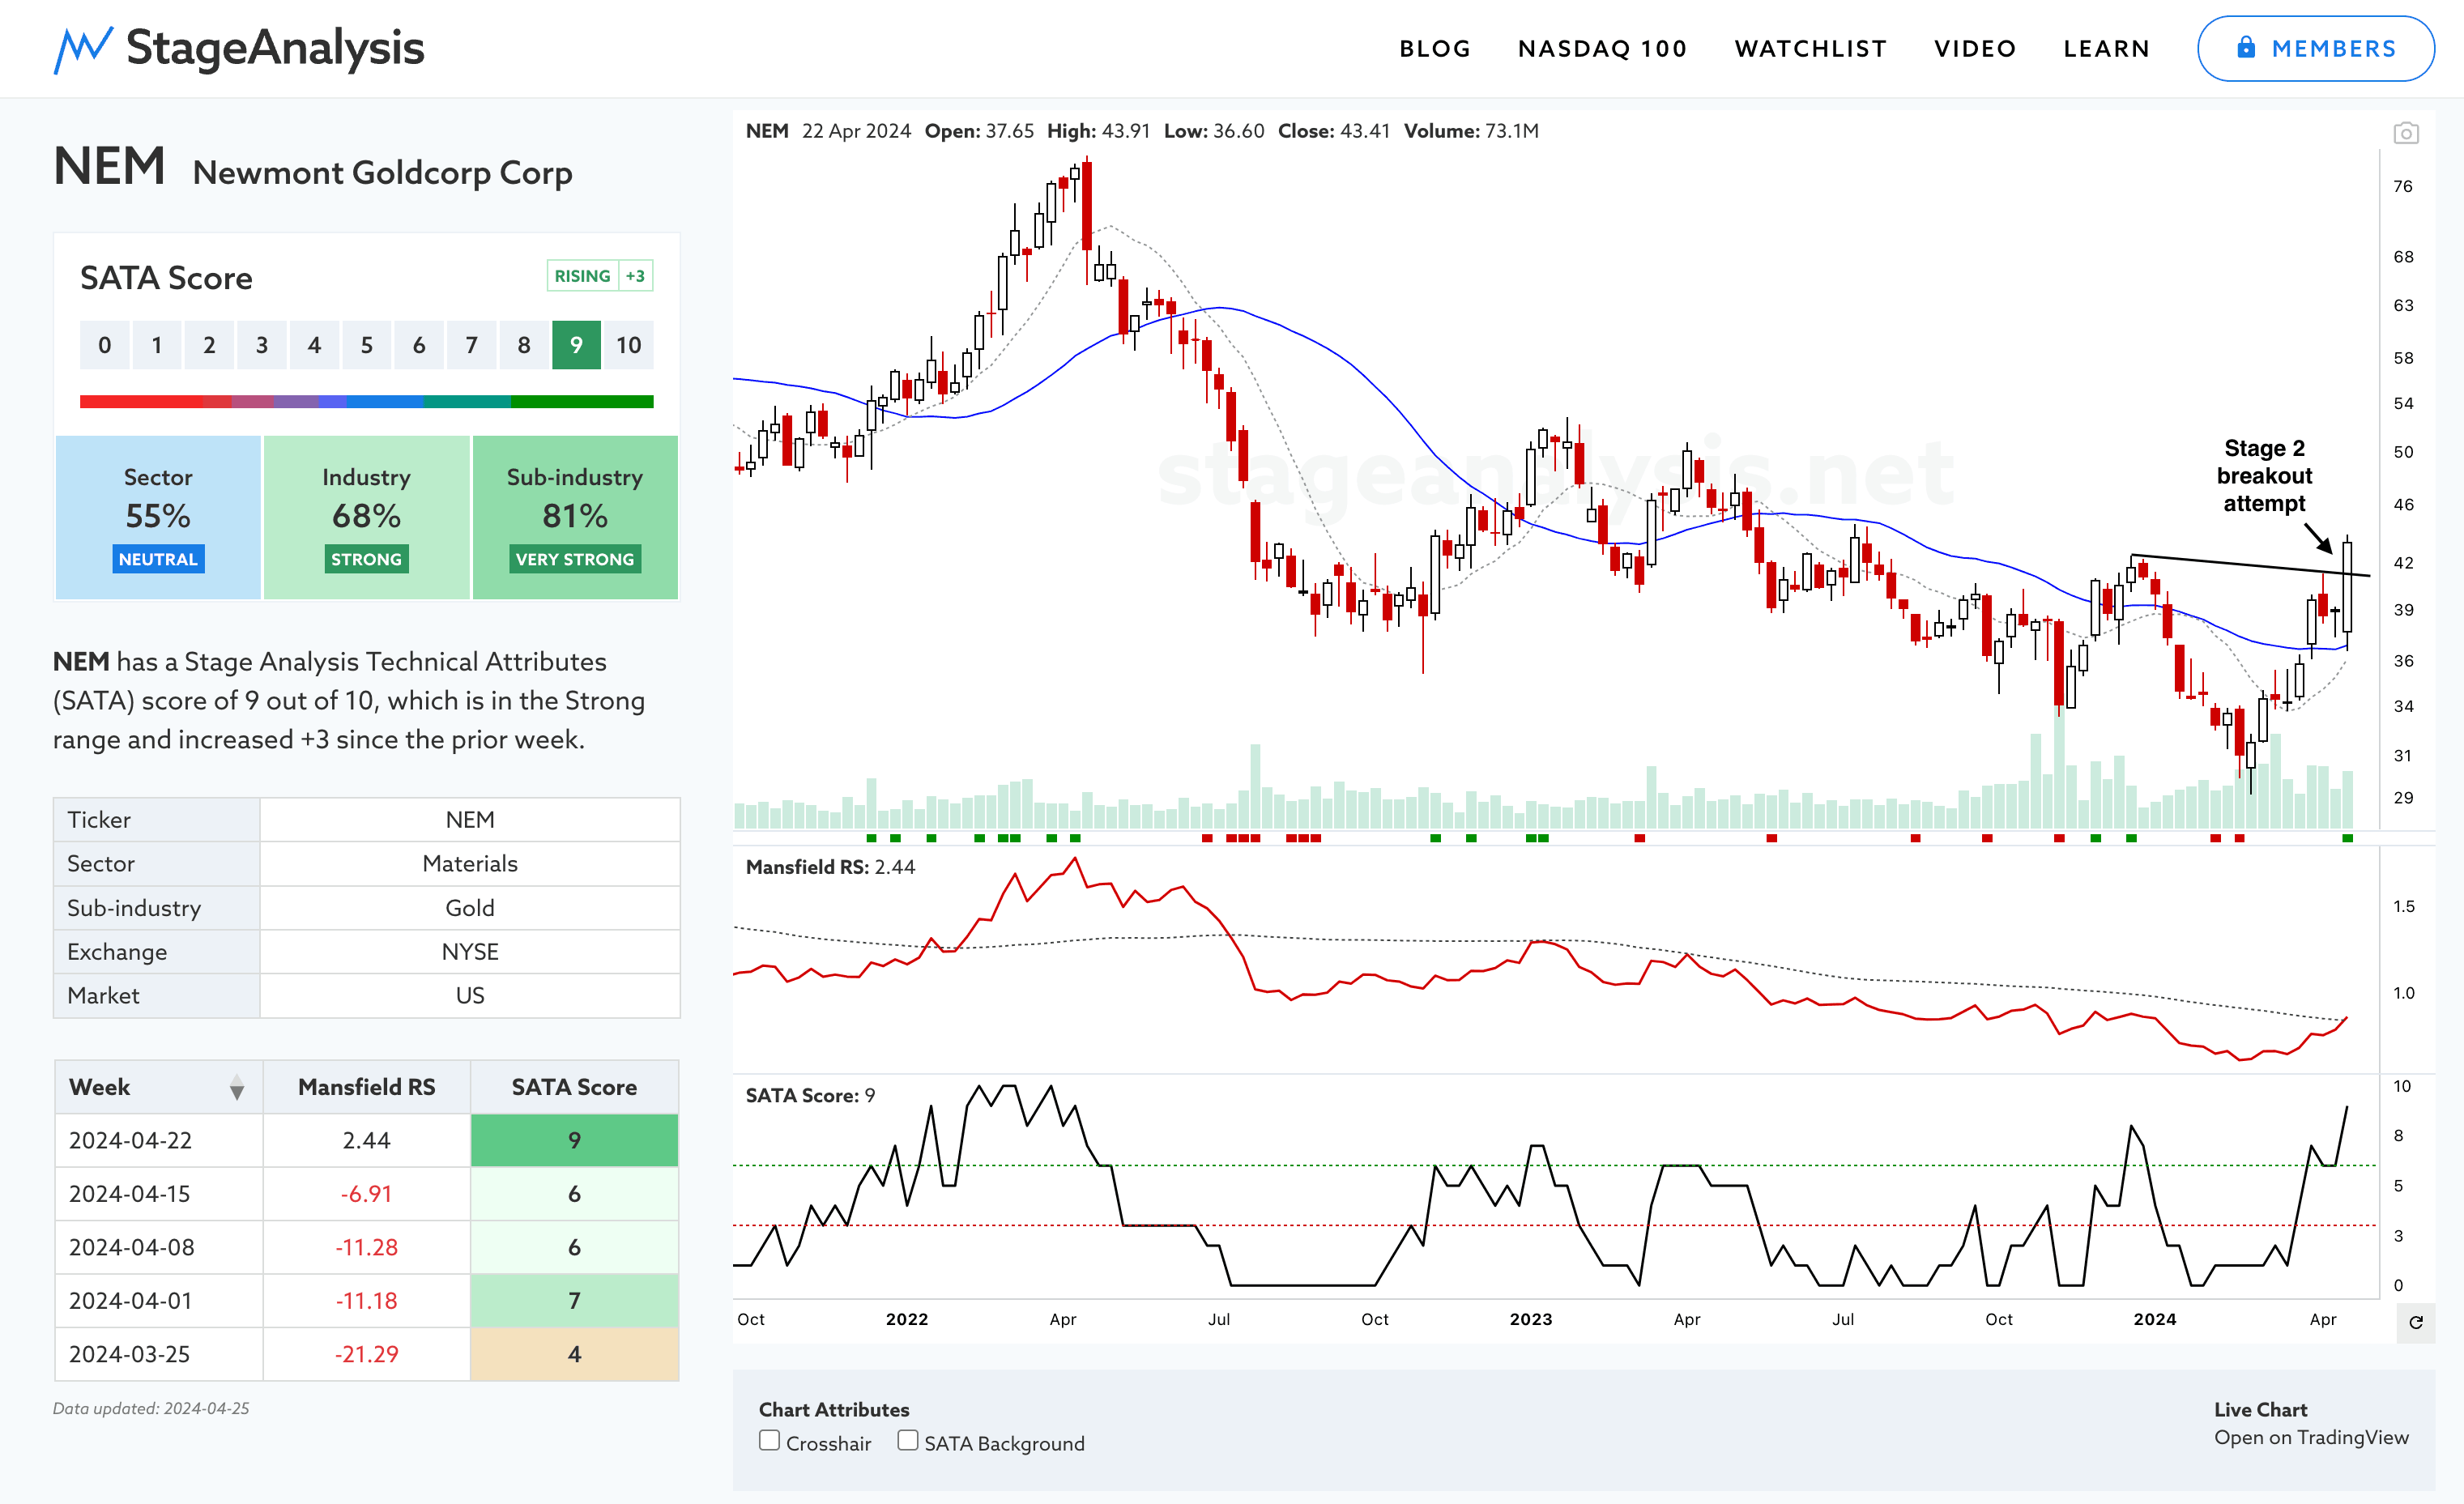
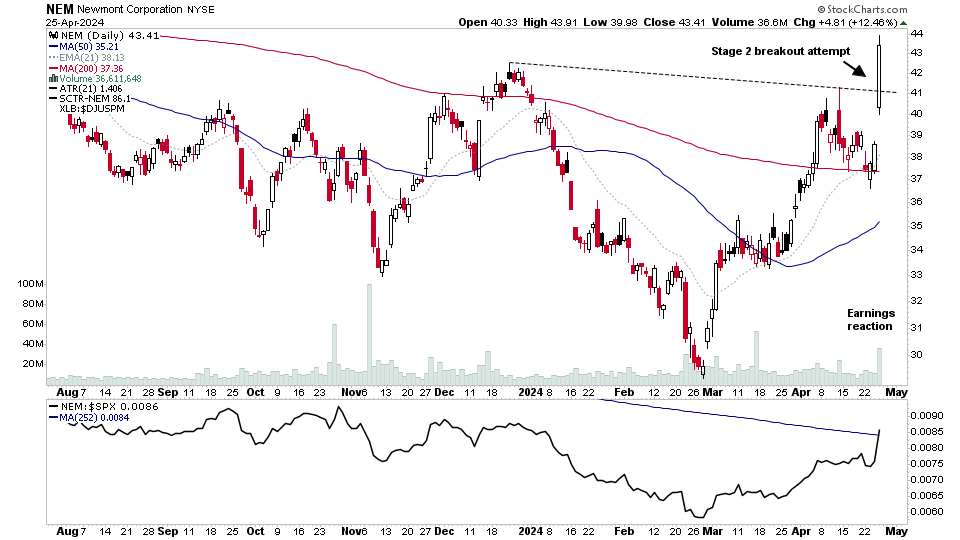
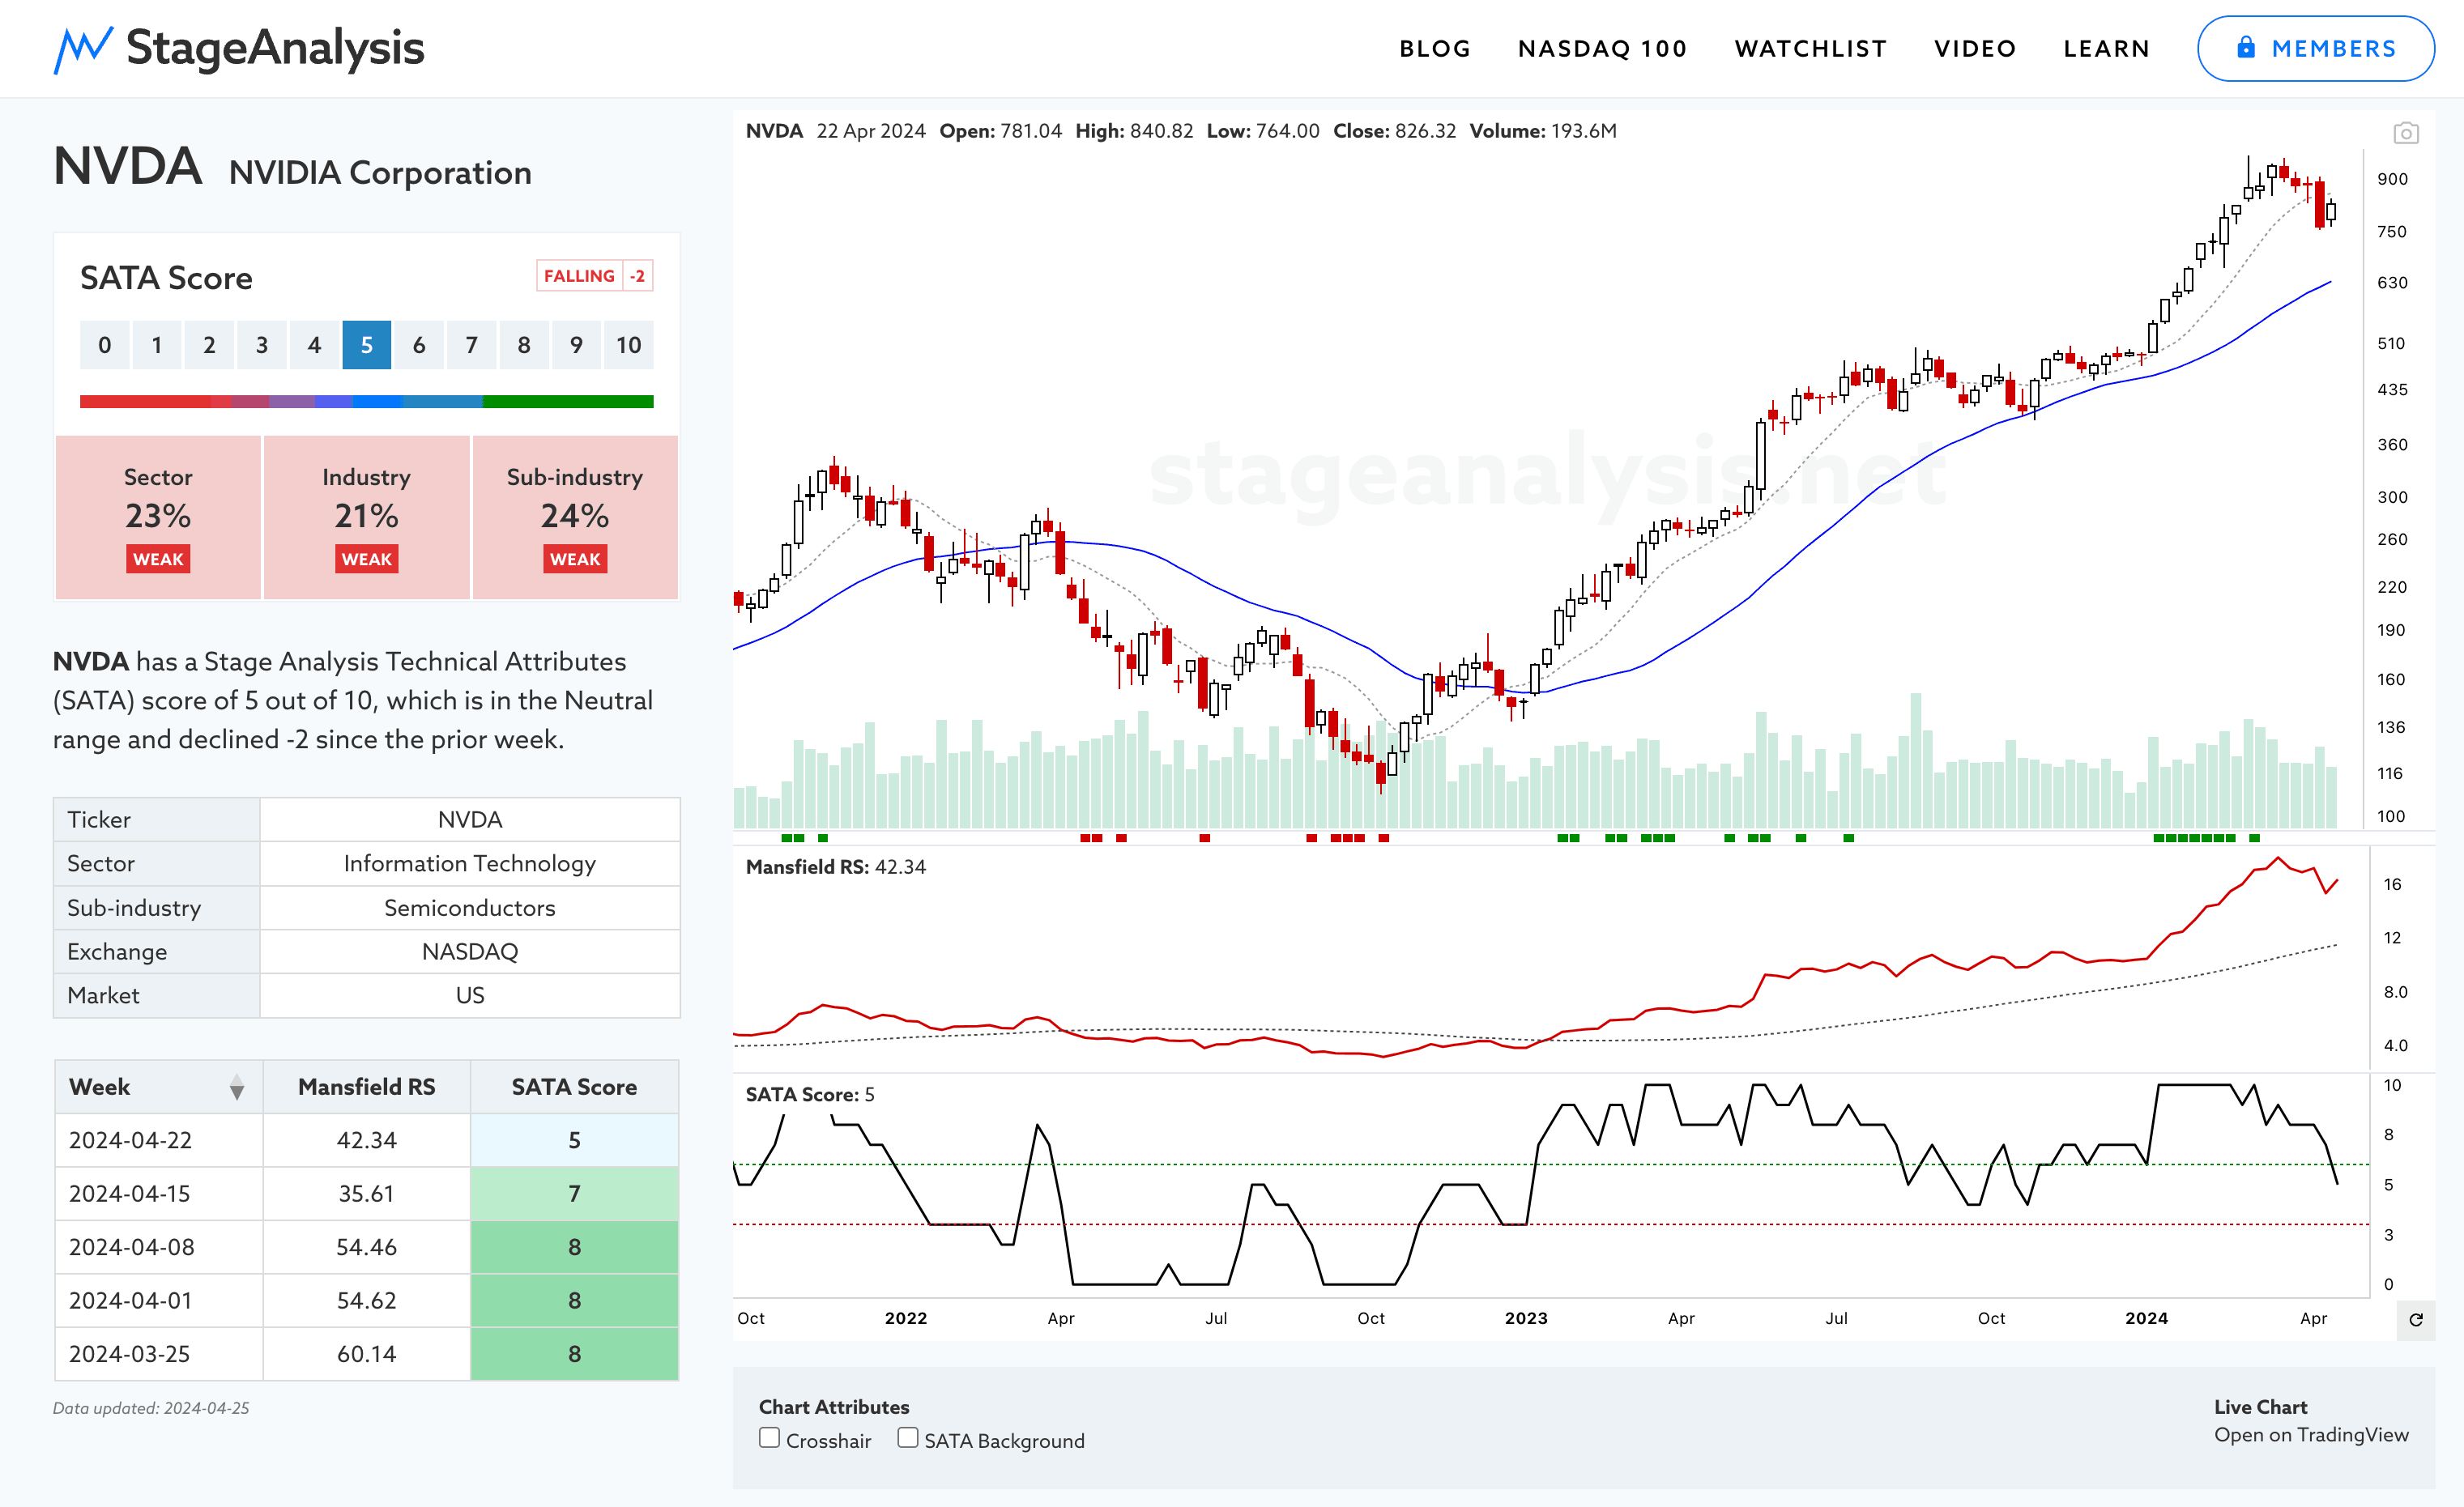
NEM, NVDA, COPX + 20 more...
Reminder: members can now use the new interactive GICS Sub-industries Bell Curve to explore all of the group themes in detail, which will see further improvements tomorrow with the additions of sector filters. Making it even easier to do Stan Weinstein's Forest to the Trees approach. So look out for those updates tomorrow on the website.
Minor new Feature: A link to live SATA charts on Tradingview can now be found in the bottom right corner of the charts, so that you can quickly jump to live charts during the trading day, and then you can use the exact same settings as on the website charts if you add the Stage Analysis Technical Attributes (SATA) by stageanalysis indicator and the Mansfield Relative Strength (Original Version) by stageanalysis indicator.
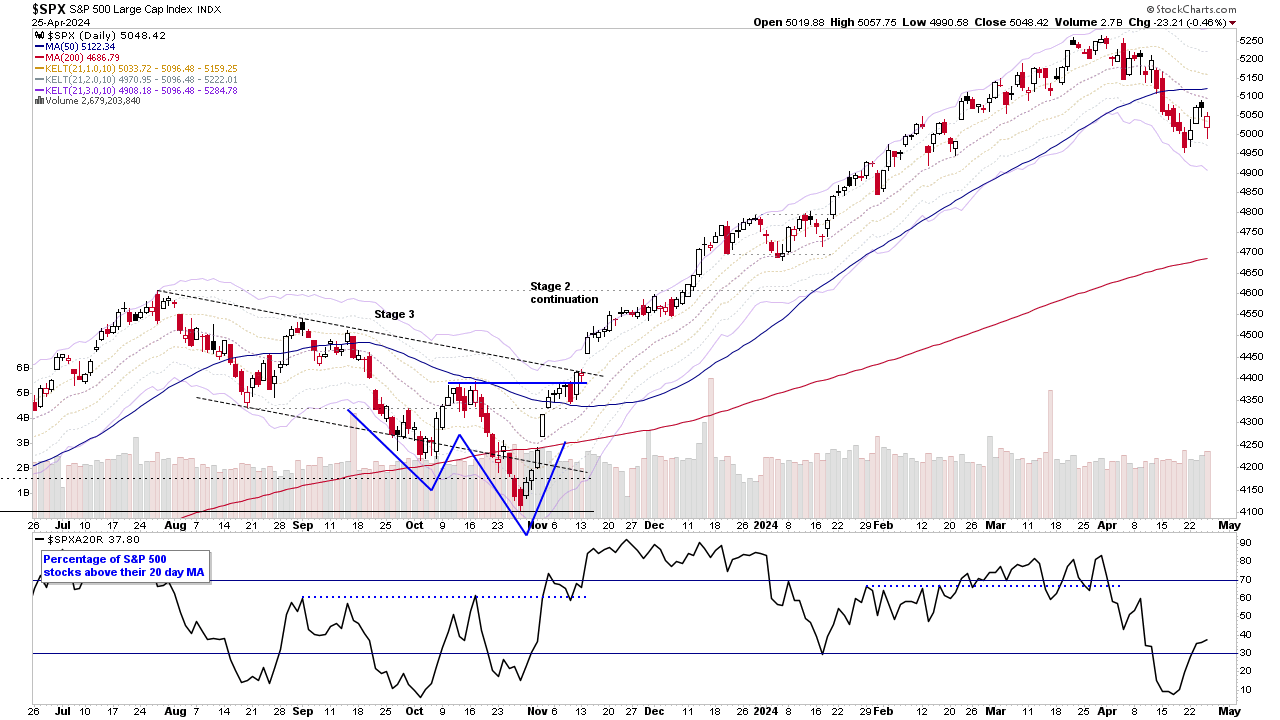
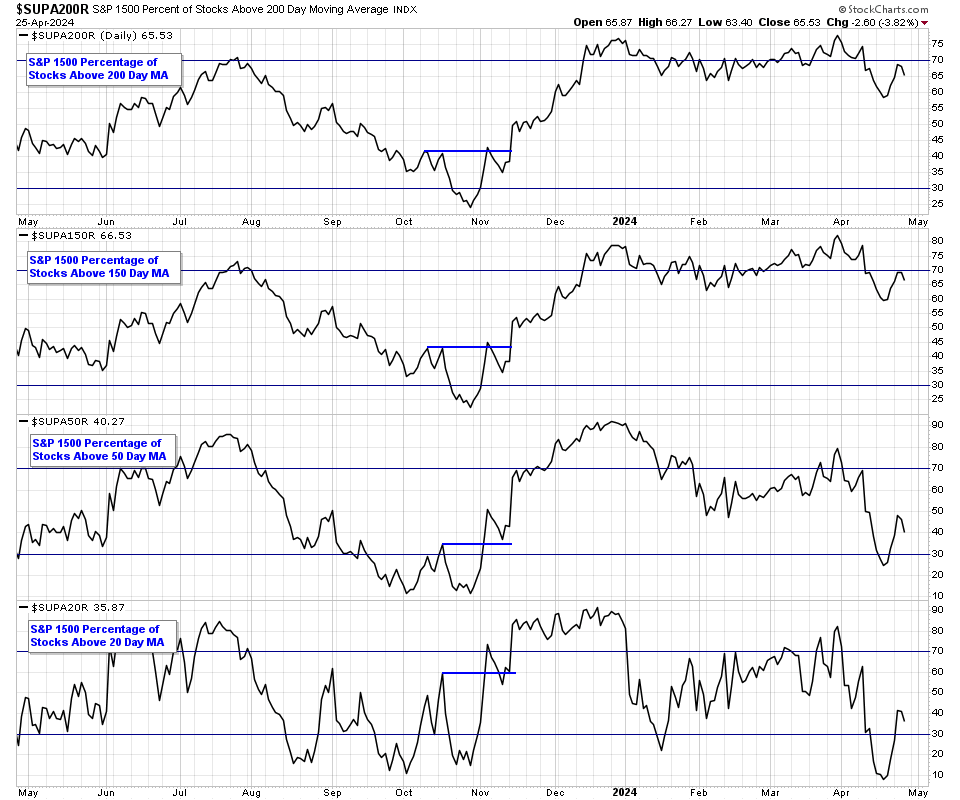
Market Breadth: S&P Composite 1500 Moving Average Breadth
- 65.63% > 200 day MA (Long-term)
- 66.53% > 150 day MA (Medium-term)
- 40.27% > 50 day MA (Short-term)
- 35.87% > 20 day MA (Very Short-term)
Combined Average: 52.08% (Neutral)
Become a Stage Analysis Member:
To see more like this – US Stocks watchlist posts, detailed videos each weekend, use our unique Stage Analysis tools, such as the US Stocks & ETFs Screener, Charts, Market Breadth, Group Relative Strength and more...
Join Today
Disclaimer: For educational purpose only. Not investment advice. Seek professional advice from a financial advisor before making any investing decisions.