
Market Breadth: Percentage of Stocks Above their 50 Day, 150 Day & 200 Day Moving Averages Combined
The full post is available to view by members only. For immediate access:
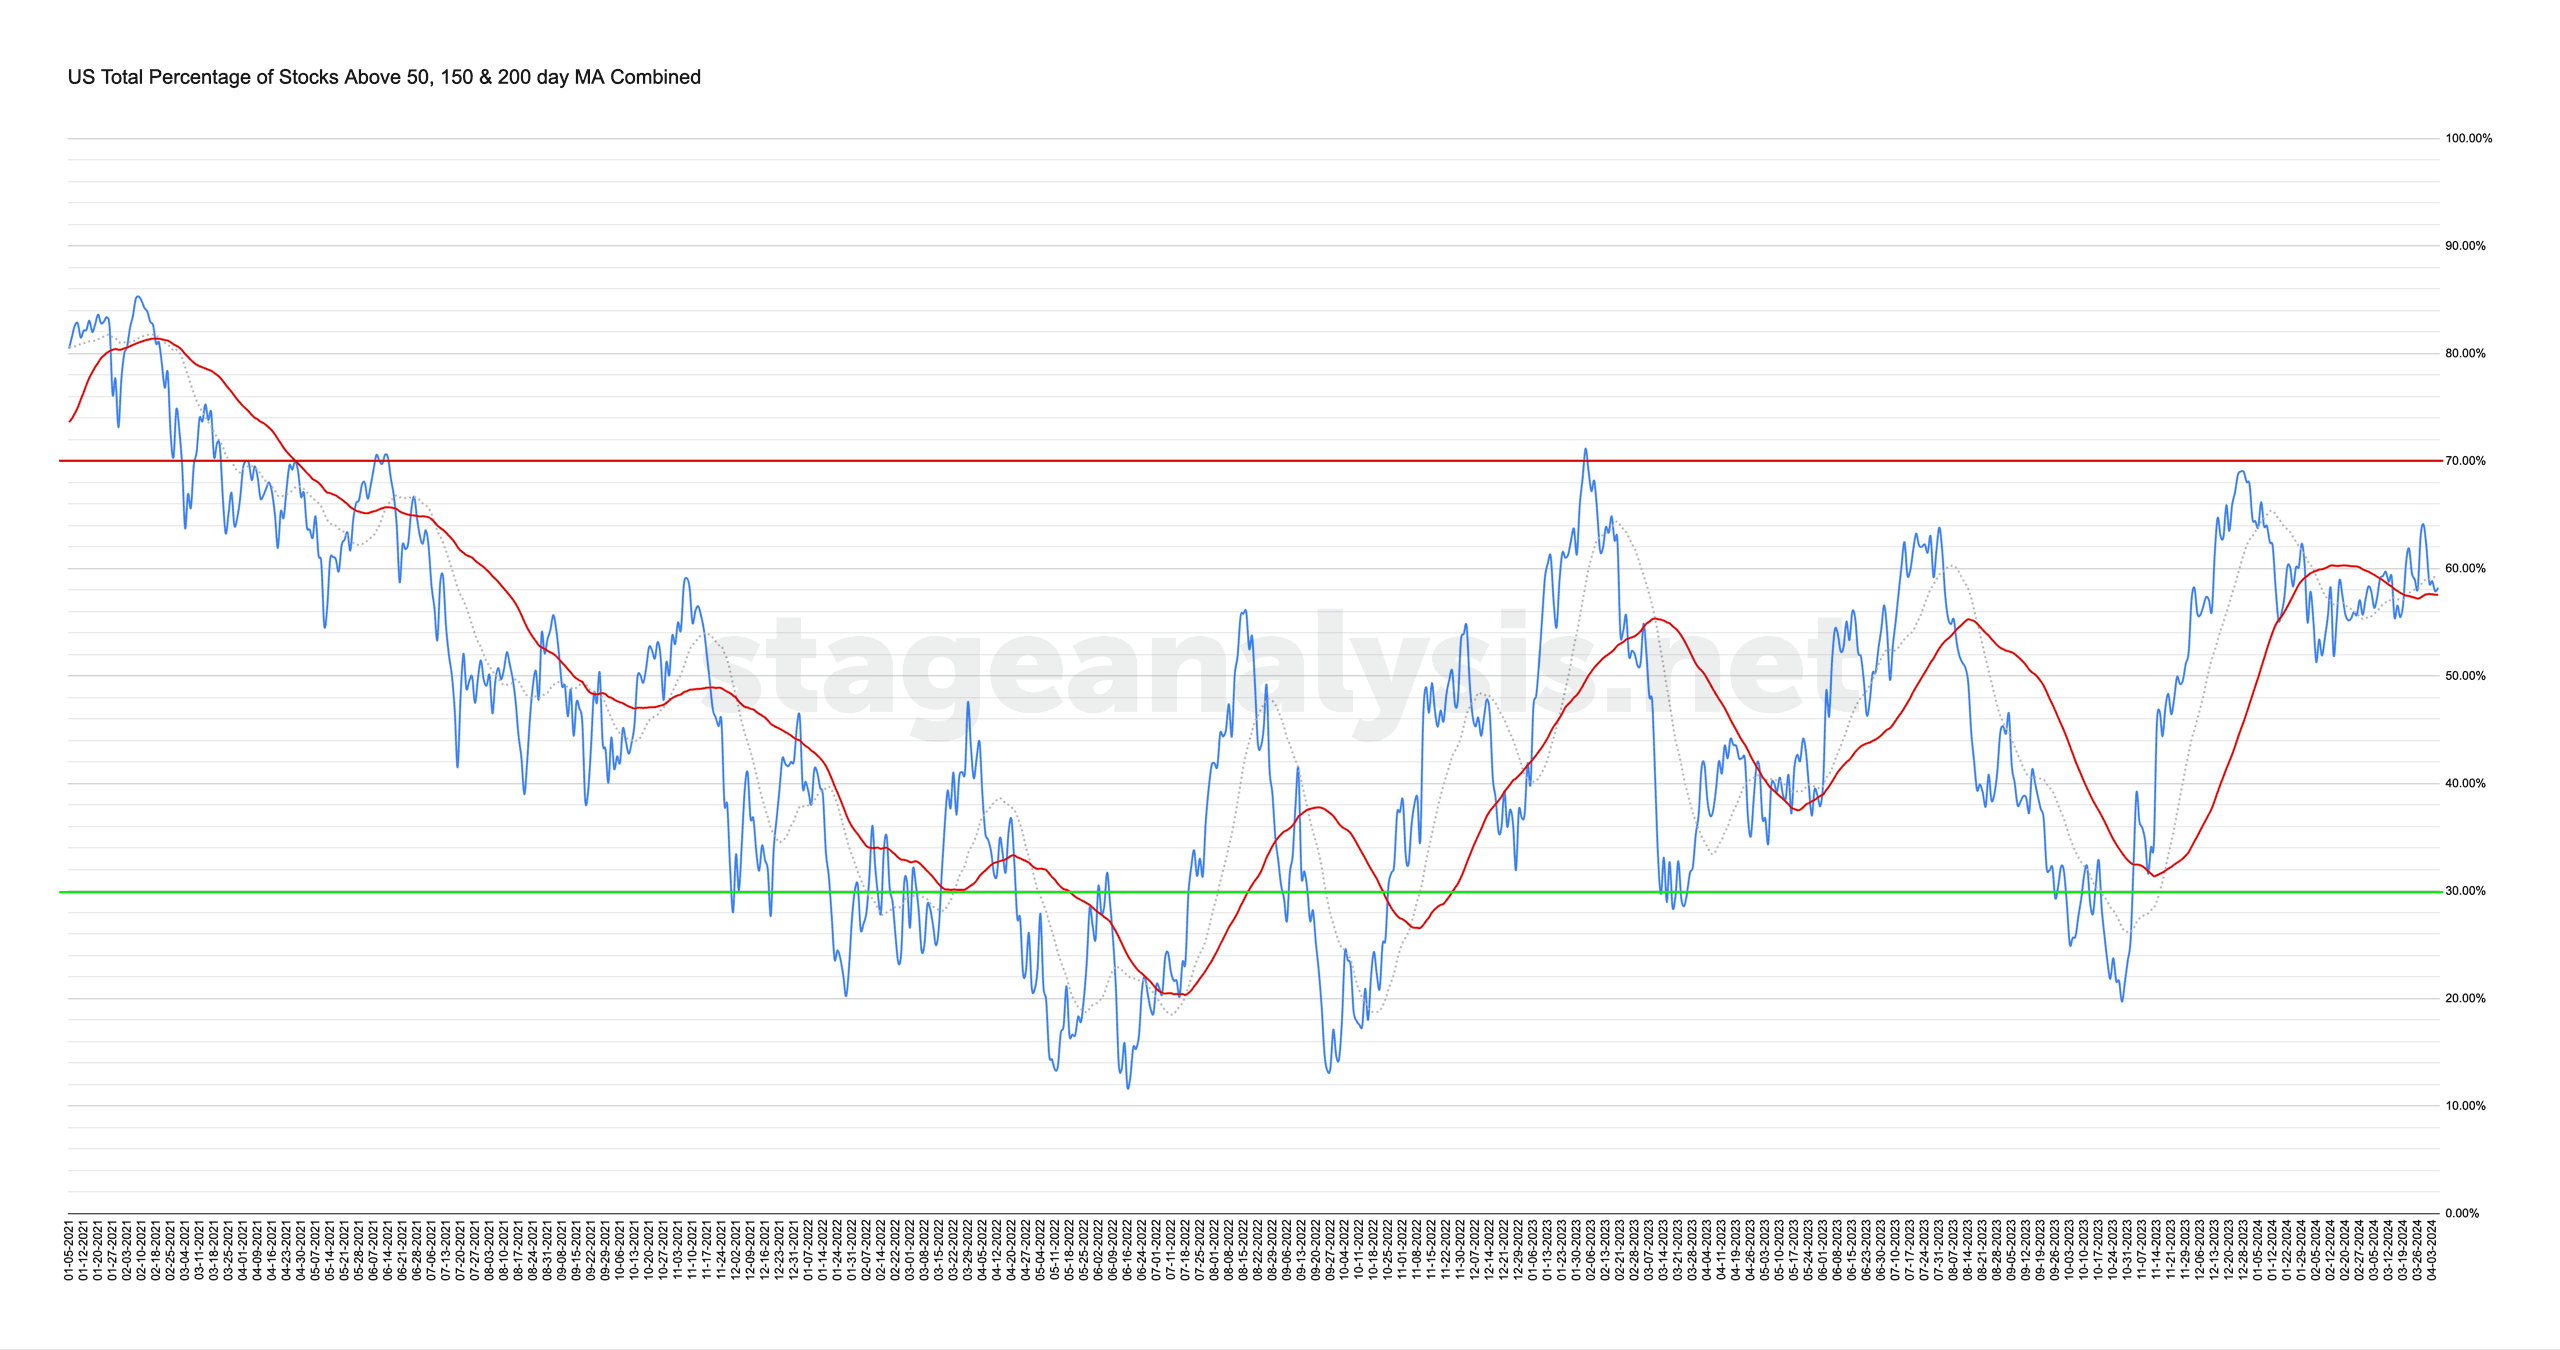
58.23% (-5.87% 1wk)
Status: Neutral Environment
The US Total Percentage of Stocks above their 50 Day, 150 Day & 200 Day Moving Averages (shown above) decreased by -5.87% this week.
Therefore, the overall combined average is at 58.23% in the US market (NYSE and Nasdaq markets combined) above their short, medium and long term moving averages.
Yet another sharp pullback in the combined average this week, which has failed to launch into the strong zone (60%+) twice in a short amount of time, and closed the week back below its 20 day MA and just above its 50 day MA (signal line). Hence, it has returned to a Neutral Environment status in the upper-middle range of the field, with the MAs in close proximity. So it's very likely that there will be a further status change in the coming week. So need to remain nimble here.
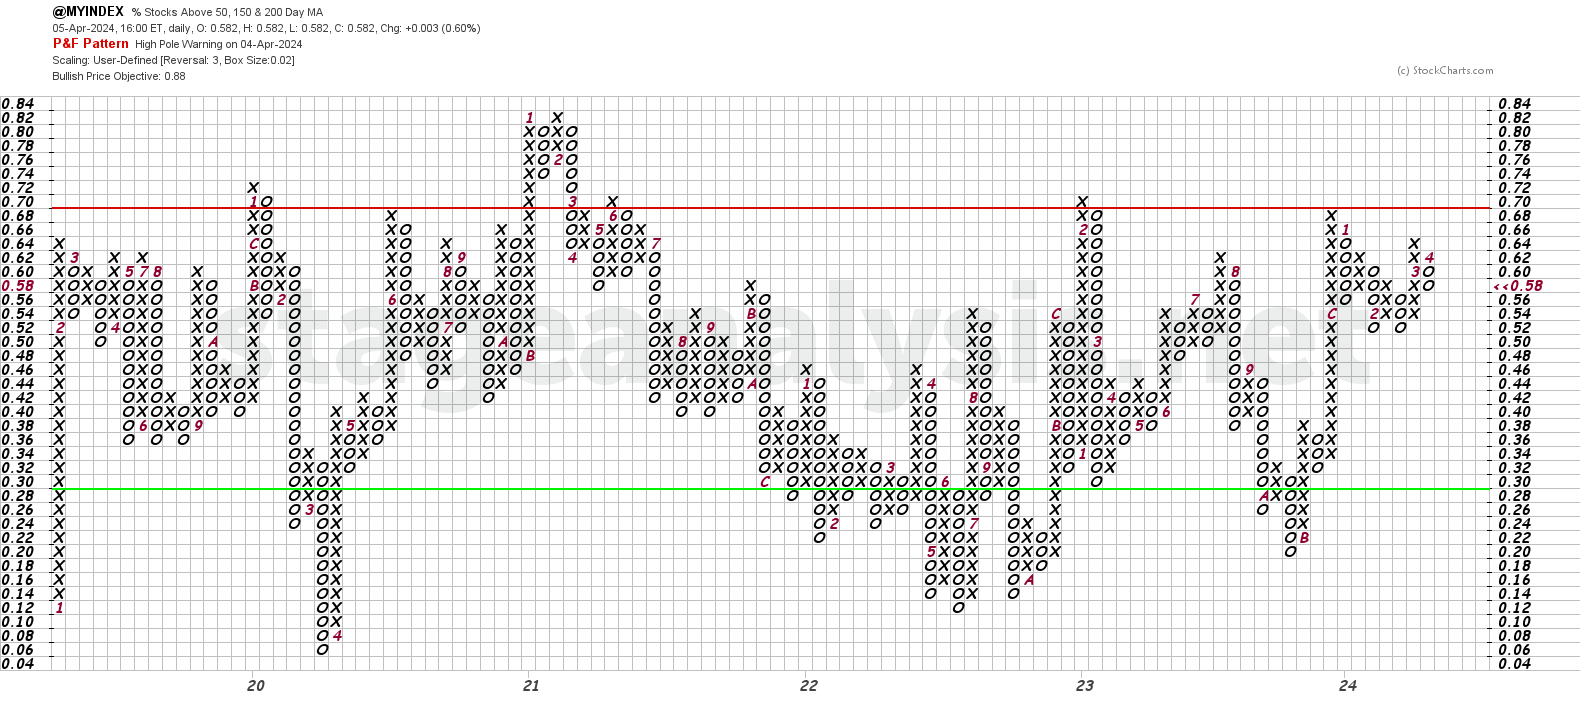
The Point and Figure (P&F) chart (shown above) reversed to a column of Os by 3 boxes on Thursday and so the P&F strategy changed to Defense (as it is in a column of Os), and the P&F status changed to Bull Correction status in the upper-middle range with a high-pole warning on the chart, as it reversed more than half of the previous column.
See the Bullish Percent article for more information on the P&F statuses.
Become a Stage Analysis Member:
To see more like this – US Stocks watchlist posts, detailed videos each weekend, use our unique Stage Analysis tools, such as the US Stocks & ETFs Screener, Charts, Market Breadth, Group Relative Strength and more...
Join Today
Disclaimer: For educational purpose only. Not investment advice. Seek professional advice from a financial advisor before making any investing decisions.