
Market Breadth: Percentage of Stocks Above their 50 Day, 150 Day & 200 Day Moving Averages Combined
The full post is available to view by members only. For immediate access:
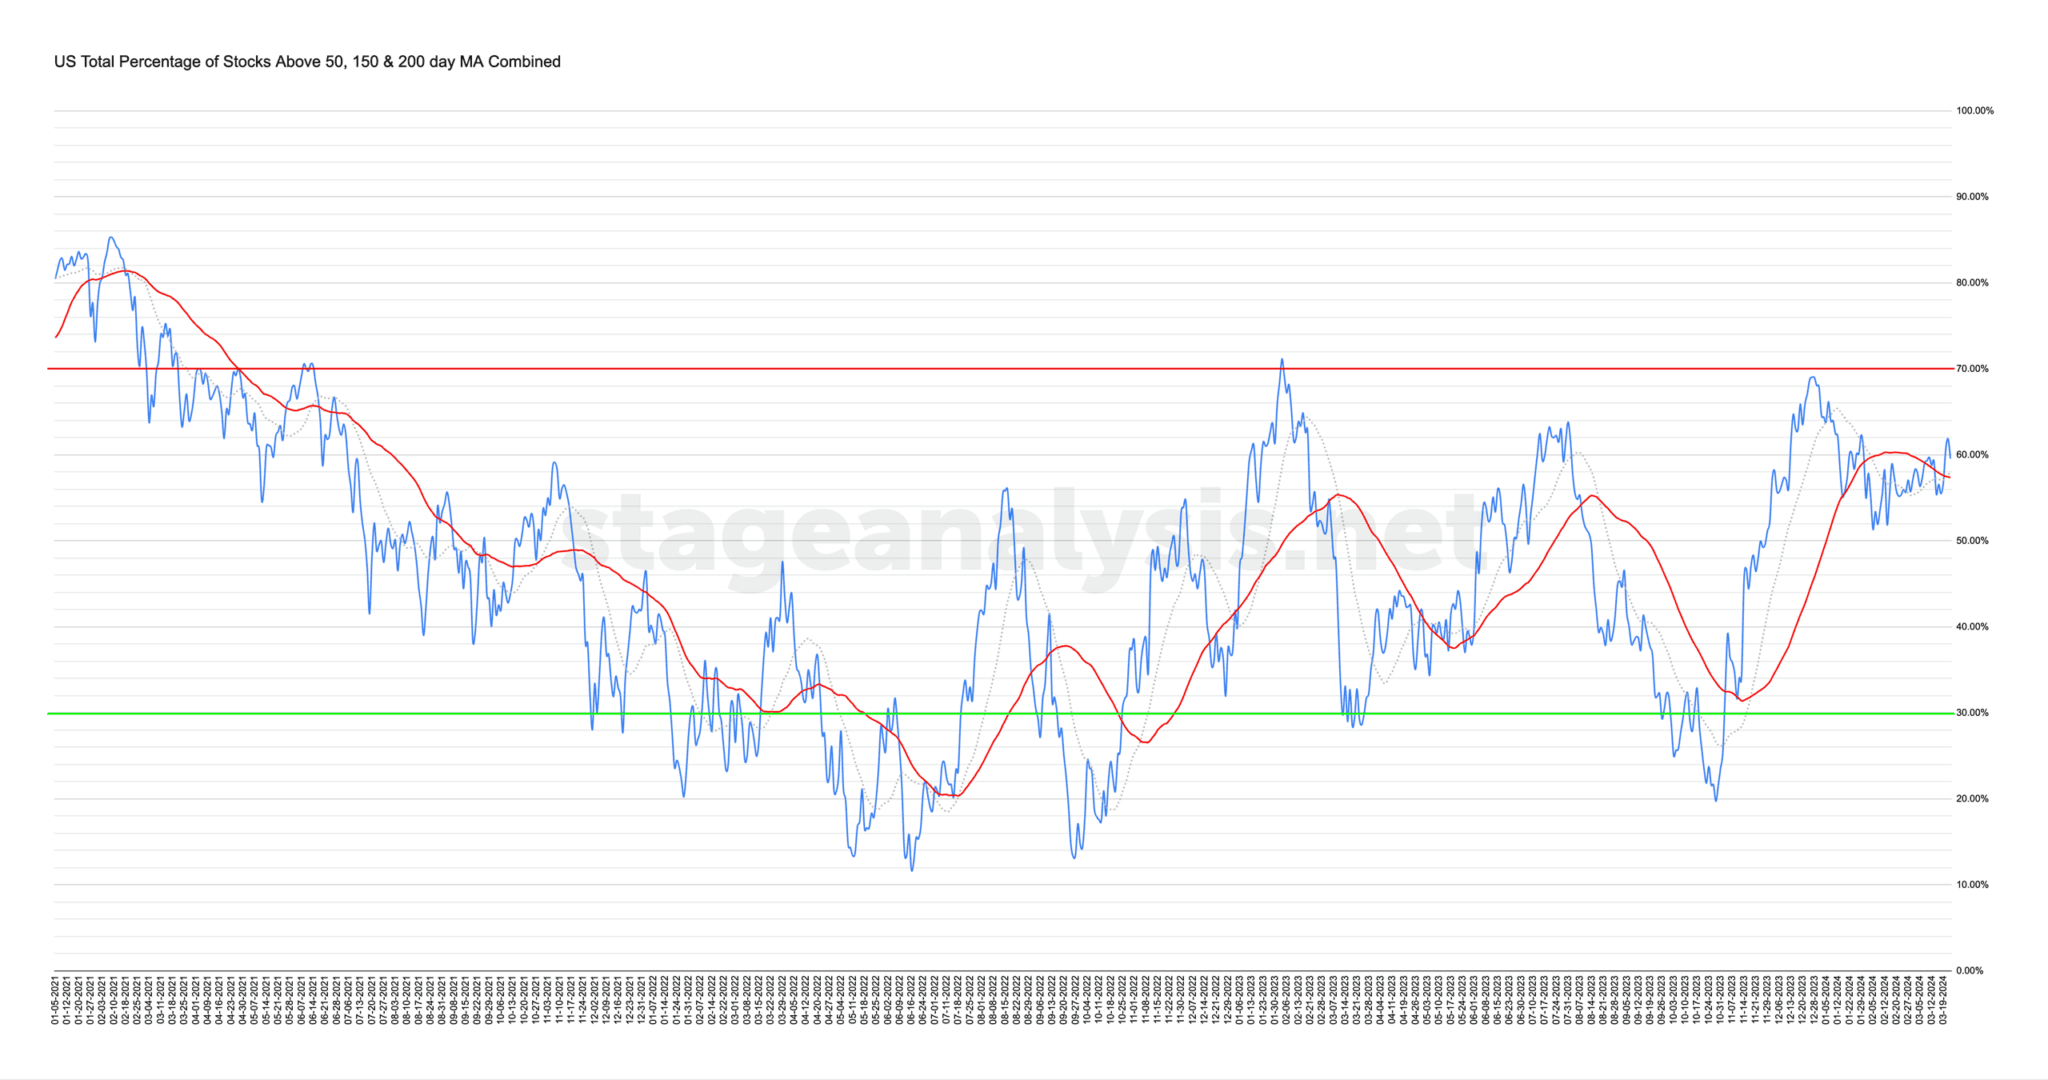
59.56% (+3.00% 1wk)
Status: Neutral / Tentative Positive Environment
The US Total Percentage of Stocks above their 50 Day, 150 Day & 200 Day Moving Averages (shown above) increased by +3.00% this week.
Therefore, the overall combined average is at 59.56% in the US market (NYSE and Nasdaq markets combined) above their short, medium and long term moving averages.
The combined average rebounded this week, regaining both the moving averages and closing the week just under the 60% level (which is the border of the Neutral to Strong zone). So the status has technically changed to a Positive environment, but as per last weeks post, with the proximity to the moving averages still, it remains only a very tentative move and thus requires further confirmation, as its been chopping around the signal line for most of March. So I am keeping Neutral in the status for the time being, and thus upgrading it to a Neutral / Tentative Positive Environment. As that seems more appropriate considering the current position.
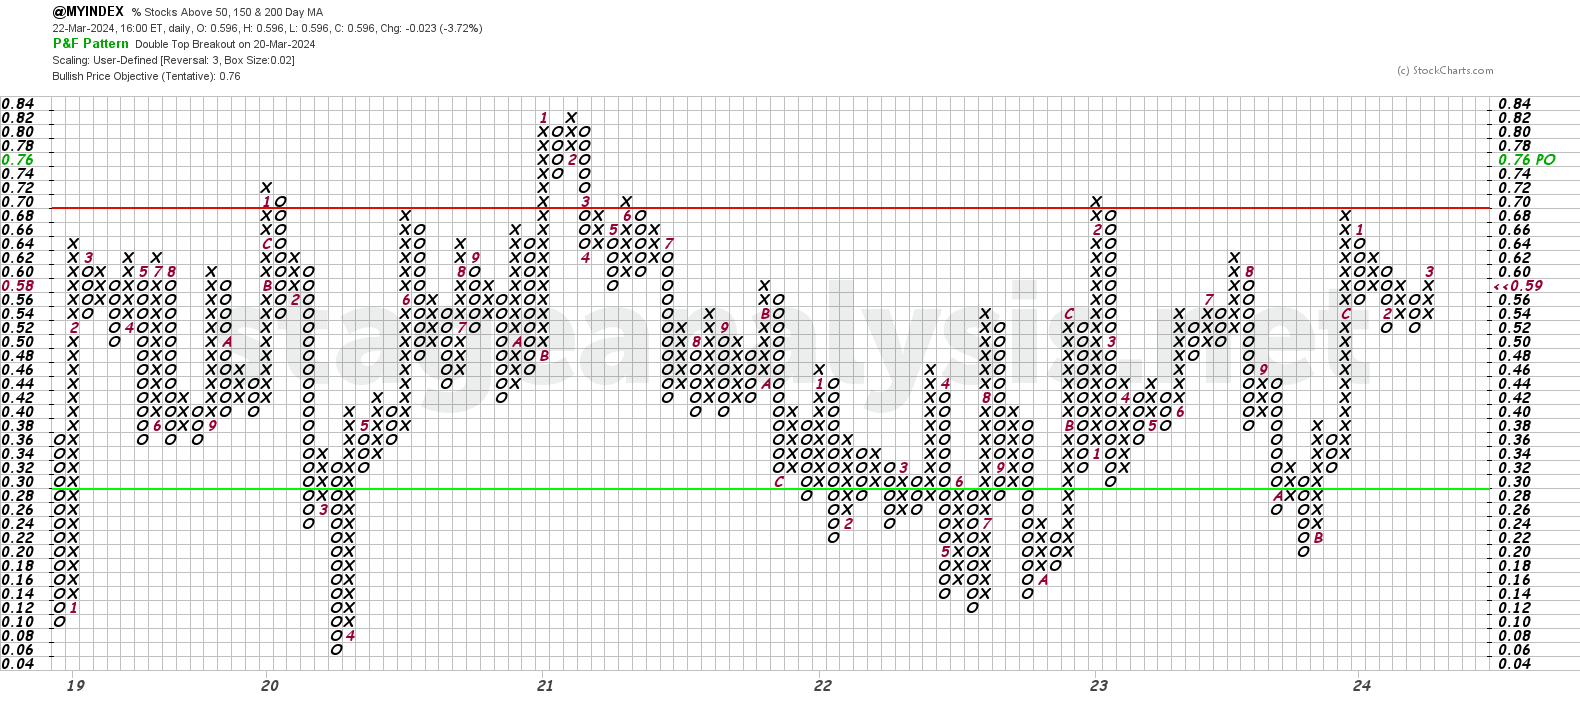
The Point and Figure (P&F) chart (shown above) made a double top breakout on Wednesday with the close above the 60% level and so the P&F strategy remains on Offense (as it is in a column of Xs), but the P&F status changes to Bull Confirmed status in the upper-middle range to start the new week.
See the Bullish Percent article for more information on the P&F statuses.
Become a Stage Analysis Member:
To see more like this – US Stocks watchlist posts, detailed videos each weekend, use our unique Stage Analysis tools, such as the US Stocks & ETFs Screener, Charts, Market Breadth, Group Relative Strength and more...
Join Today
Disclaimer: For educational purpose only. Not investment advice. Seek professional advice from a financial advisor before making any investing decisions.