
US Stocks Industry Groups Relative Strength Rankings
The full post is available to view by members only. For immediate access:
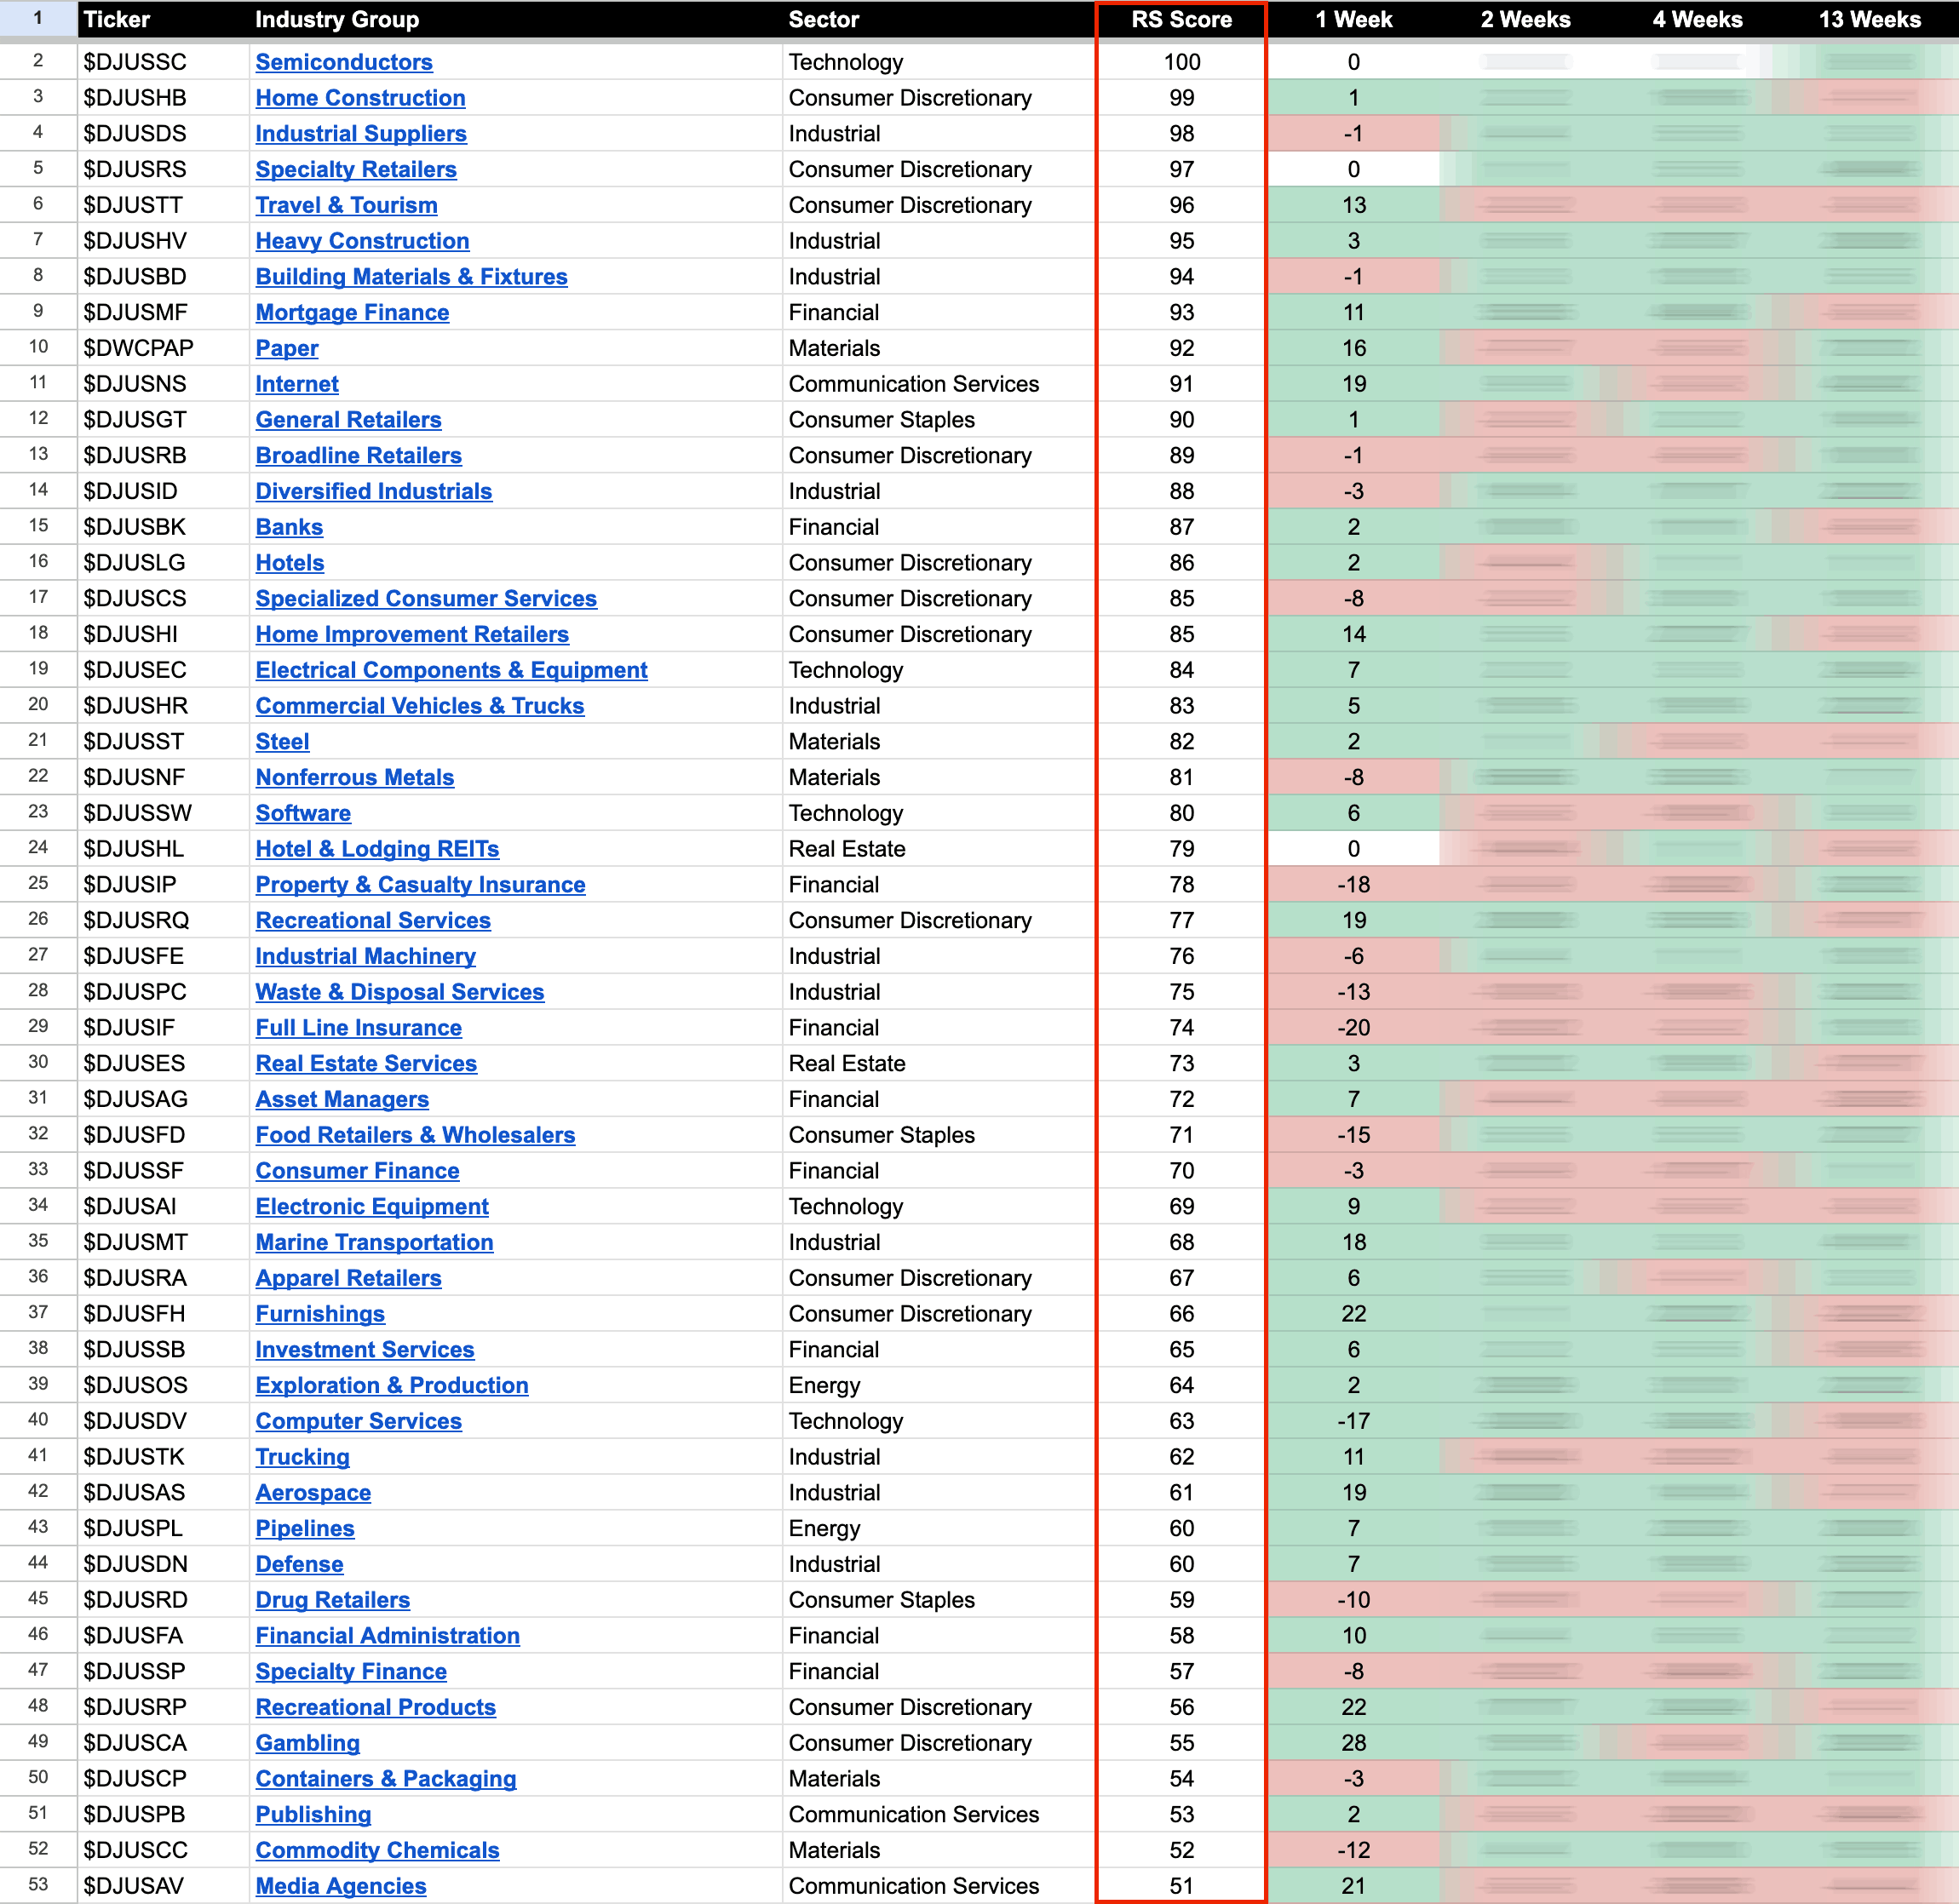
US Industry Groups by Highest RS Score
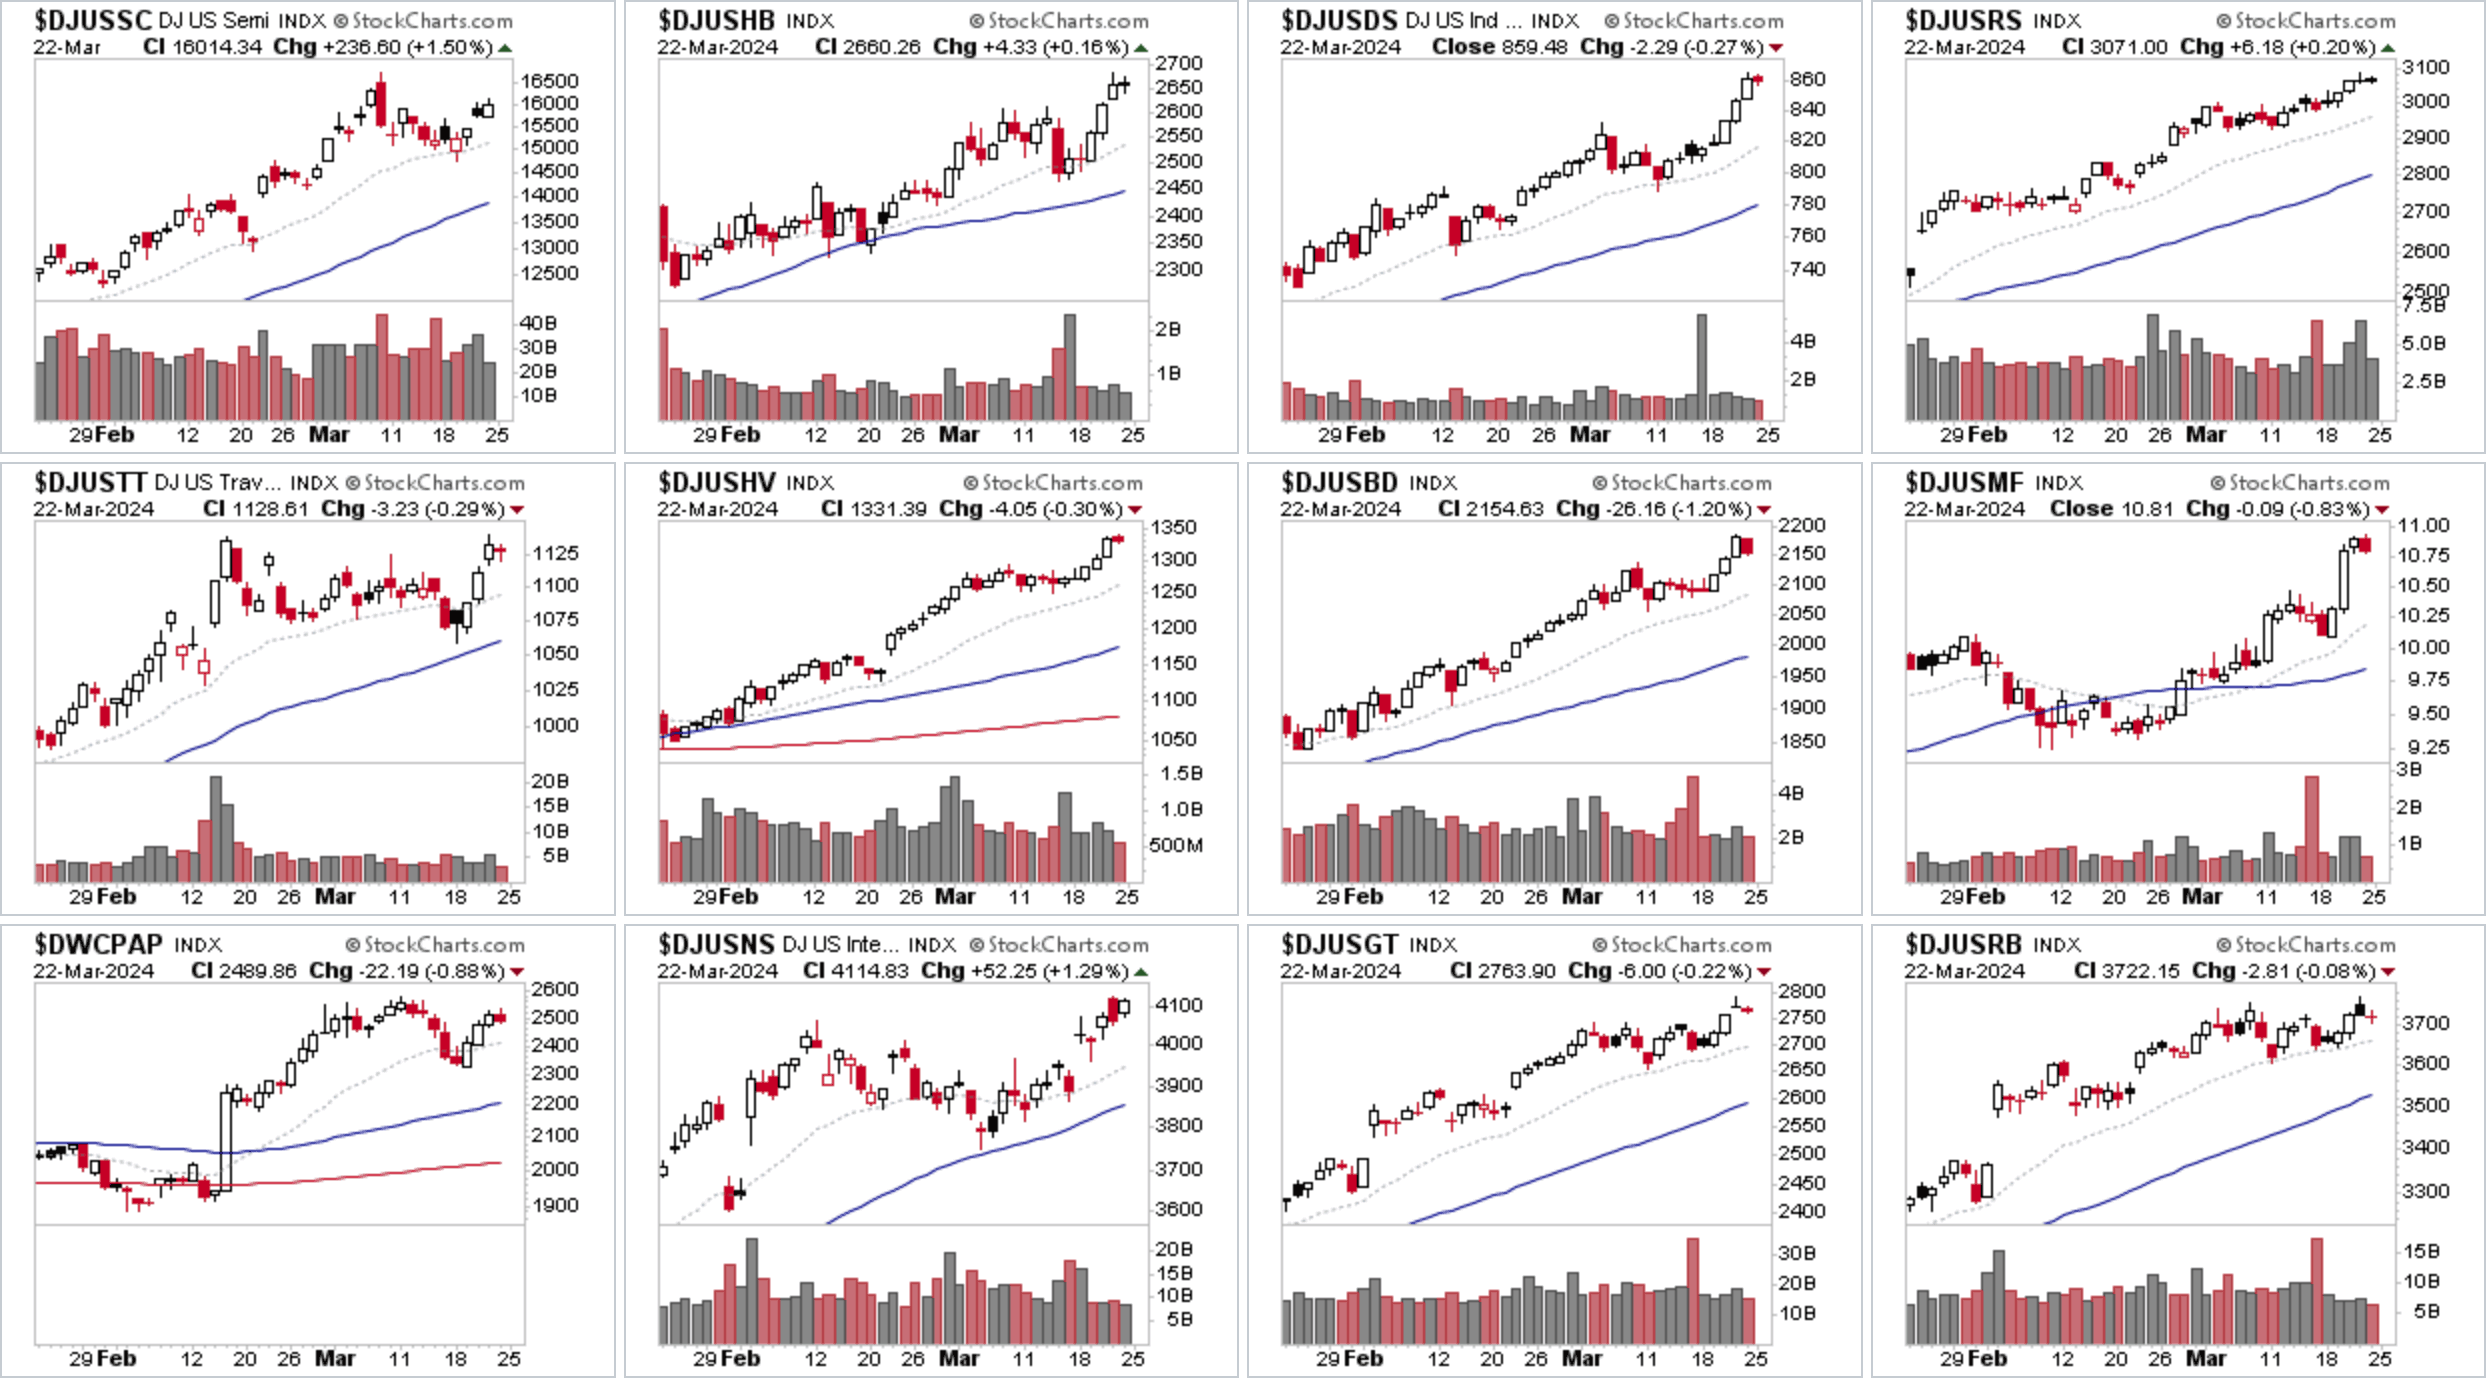
Semiconductors ($DJUSSC) holds onto its lead for yet another week in the Industry Groups Relative Strength (RS) Rankings. But another of 2023s leading groups is rising back towards the top again, with multiple Home Construction ($DJUSHB) stocks making Stage 2 continuation attempts and pushing to new 52 week highs. For example TPH, DHI, DFH, TMHC, PHM, TOL, CVCO.
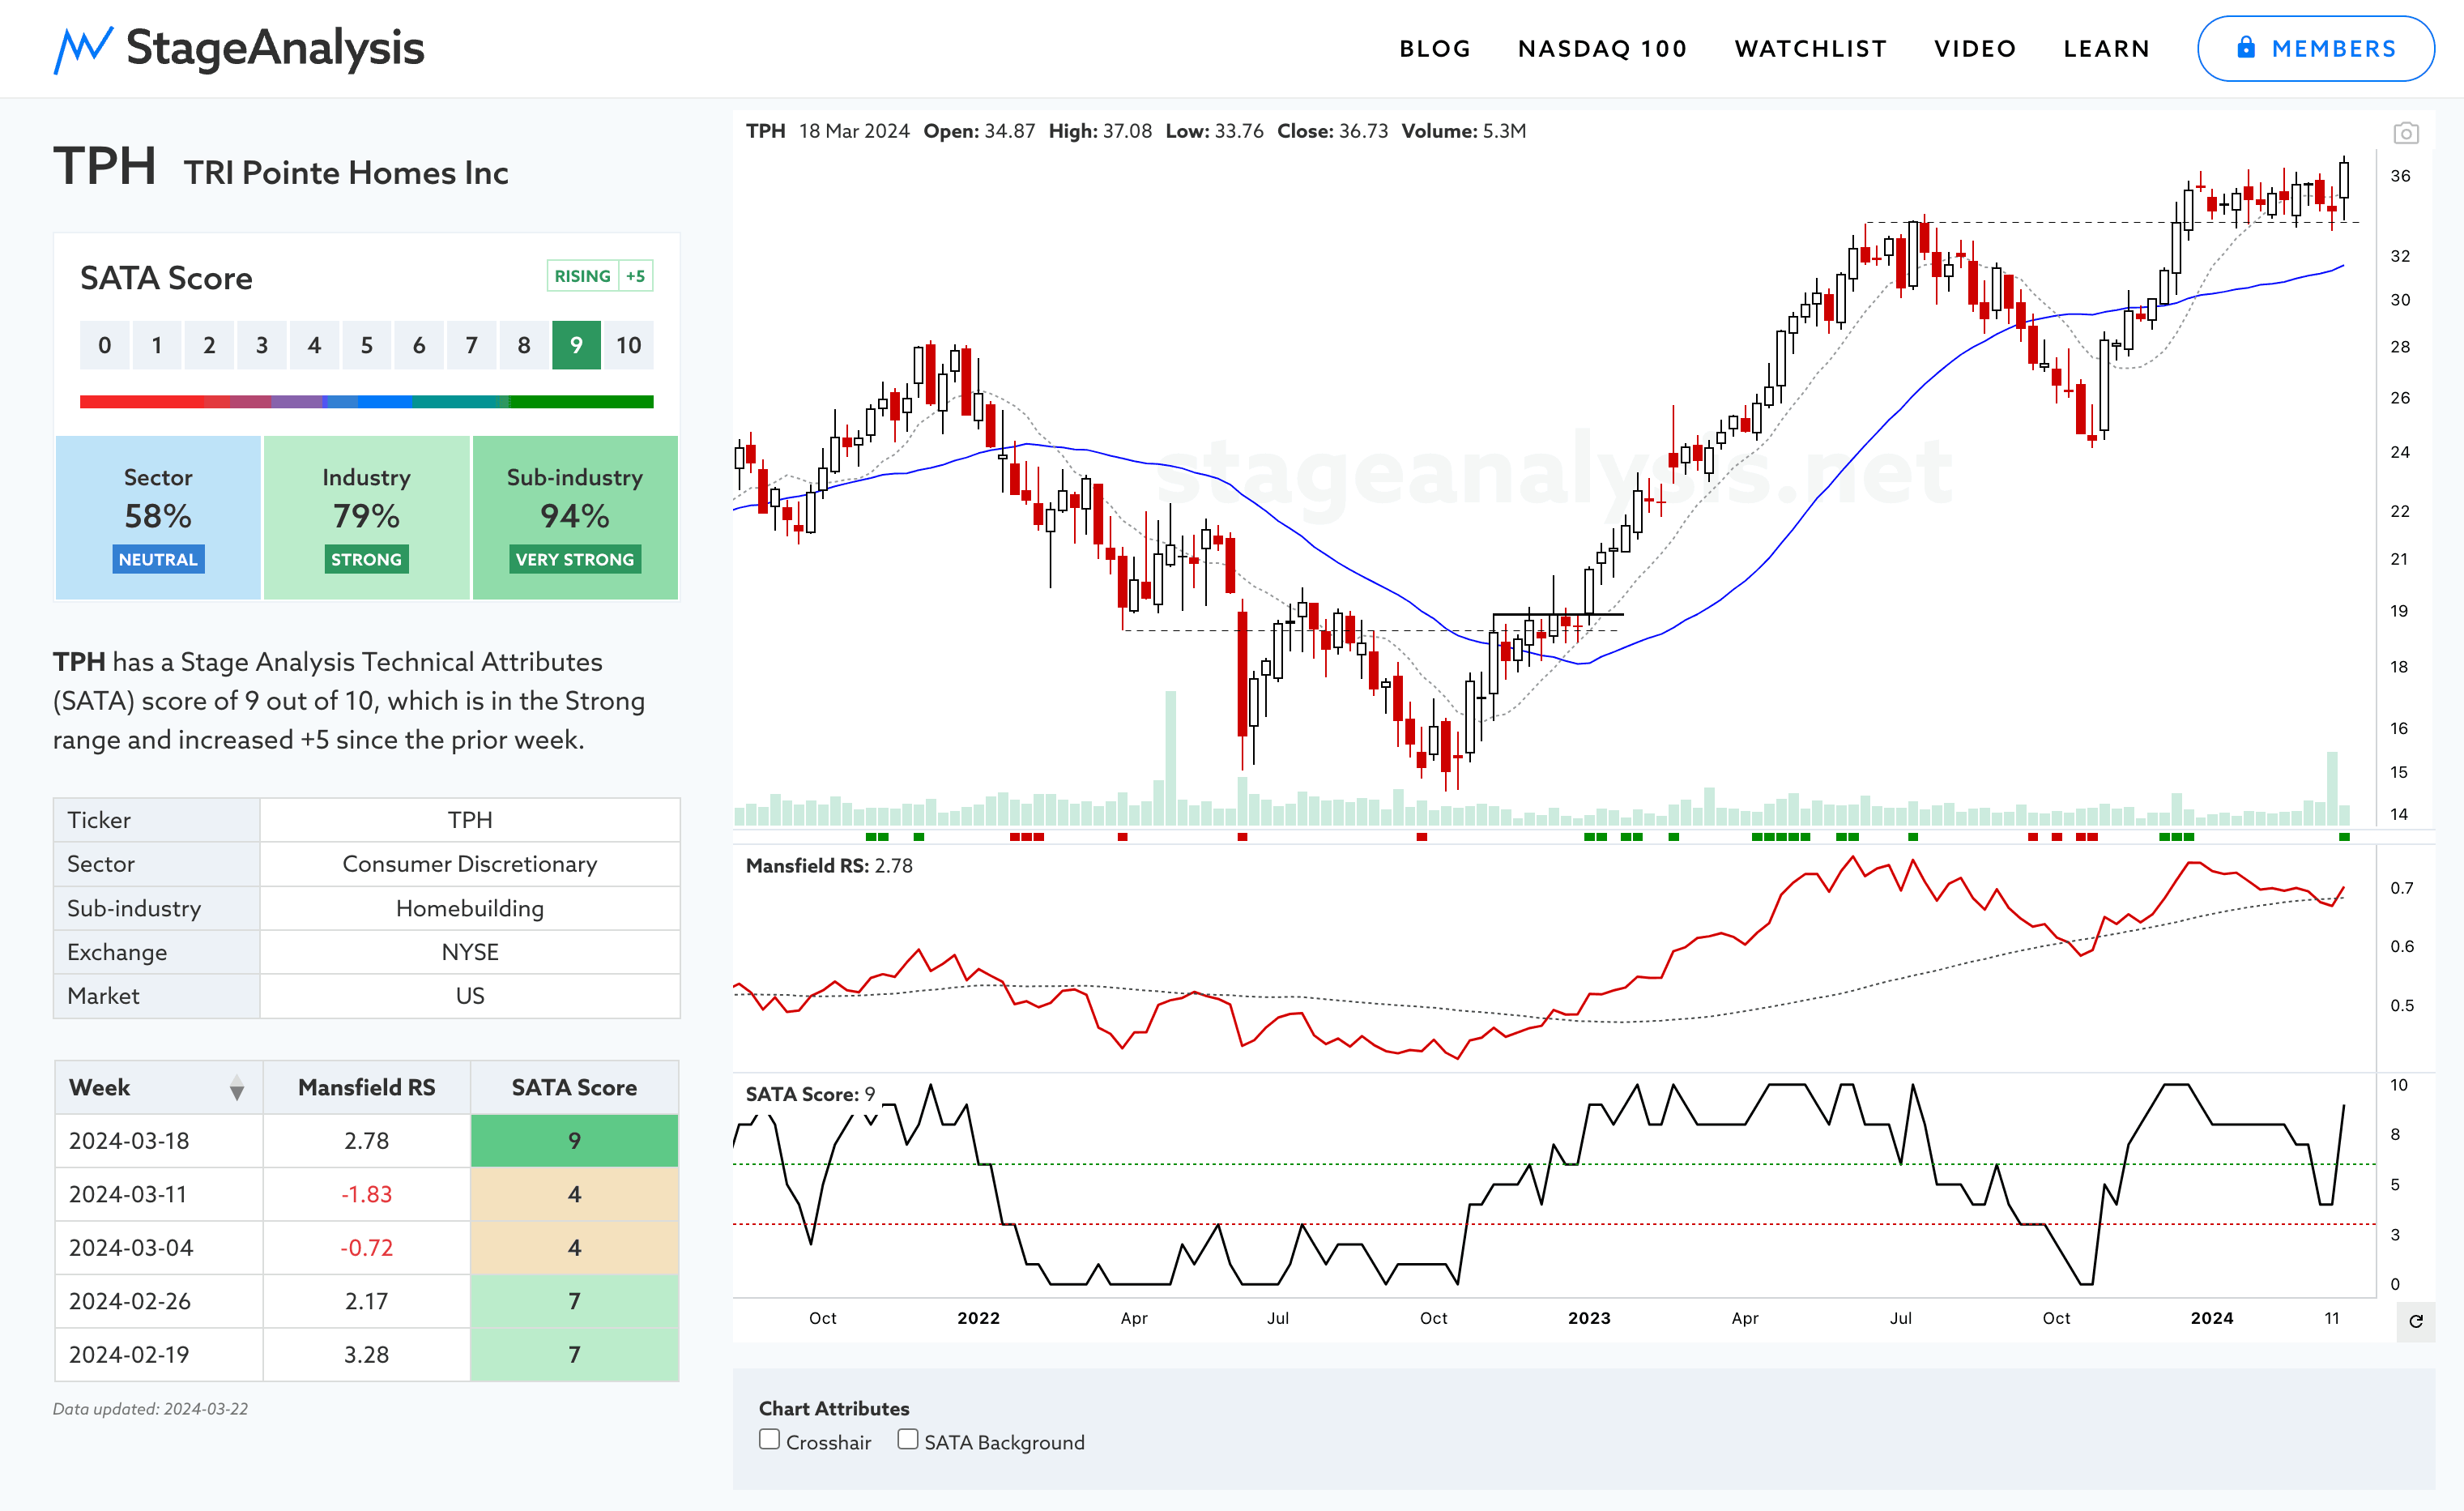
Below is a screenshot of TPH for example, from the NEW Stage Analysis stocks pages on the website for our members to use, which has the Stage Analysis Technical Attributes (SATA) and Mansfield Relative Strength (RS) scores for each stock (only S&P 1500 loaded currently, but the rest of the NYSE and Nasdaq Composite stocks are being loaded in the coming weeks). So you can get SATA and RS data for each group and quickly compare to find the leaders and laggards.
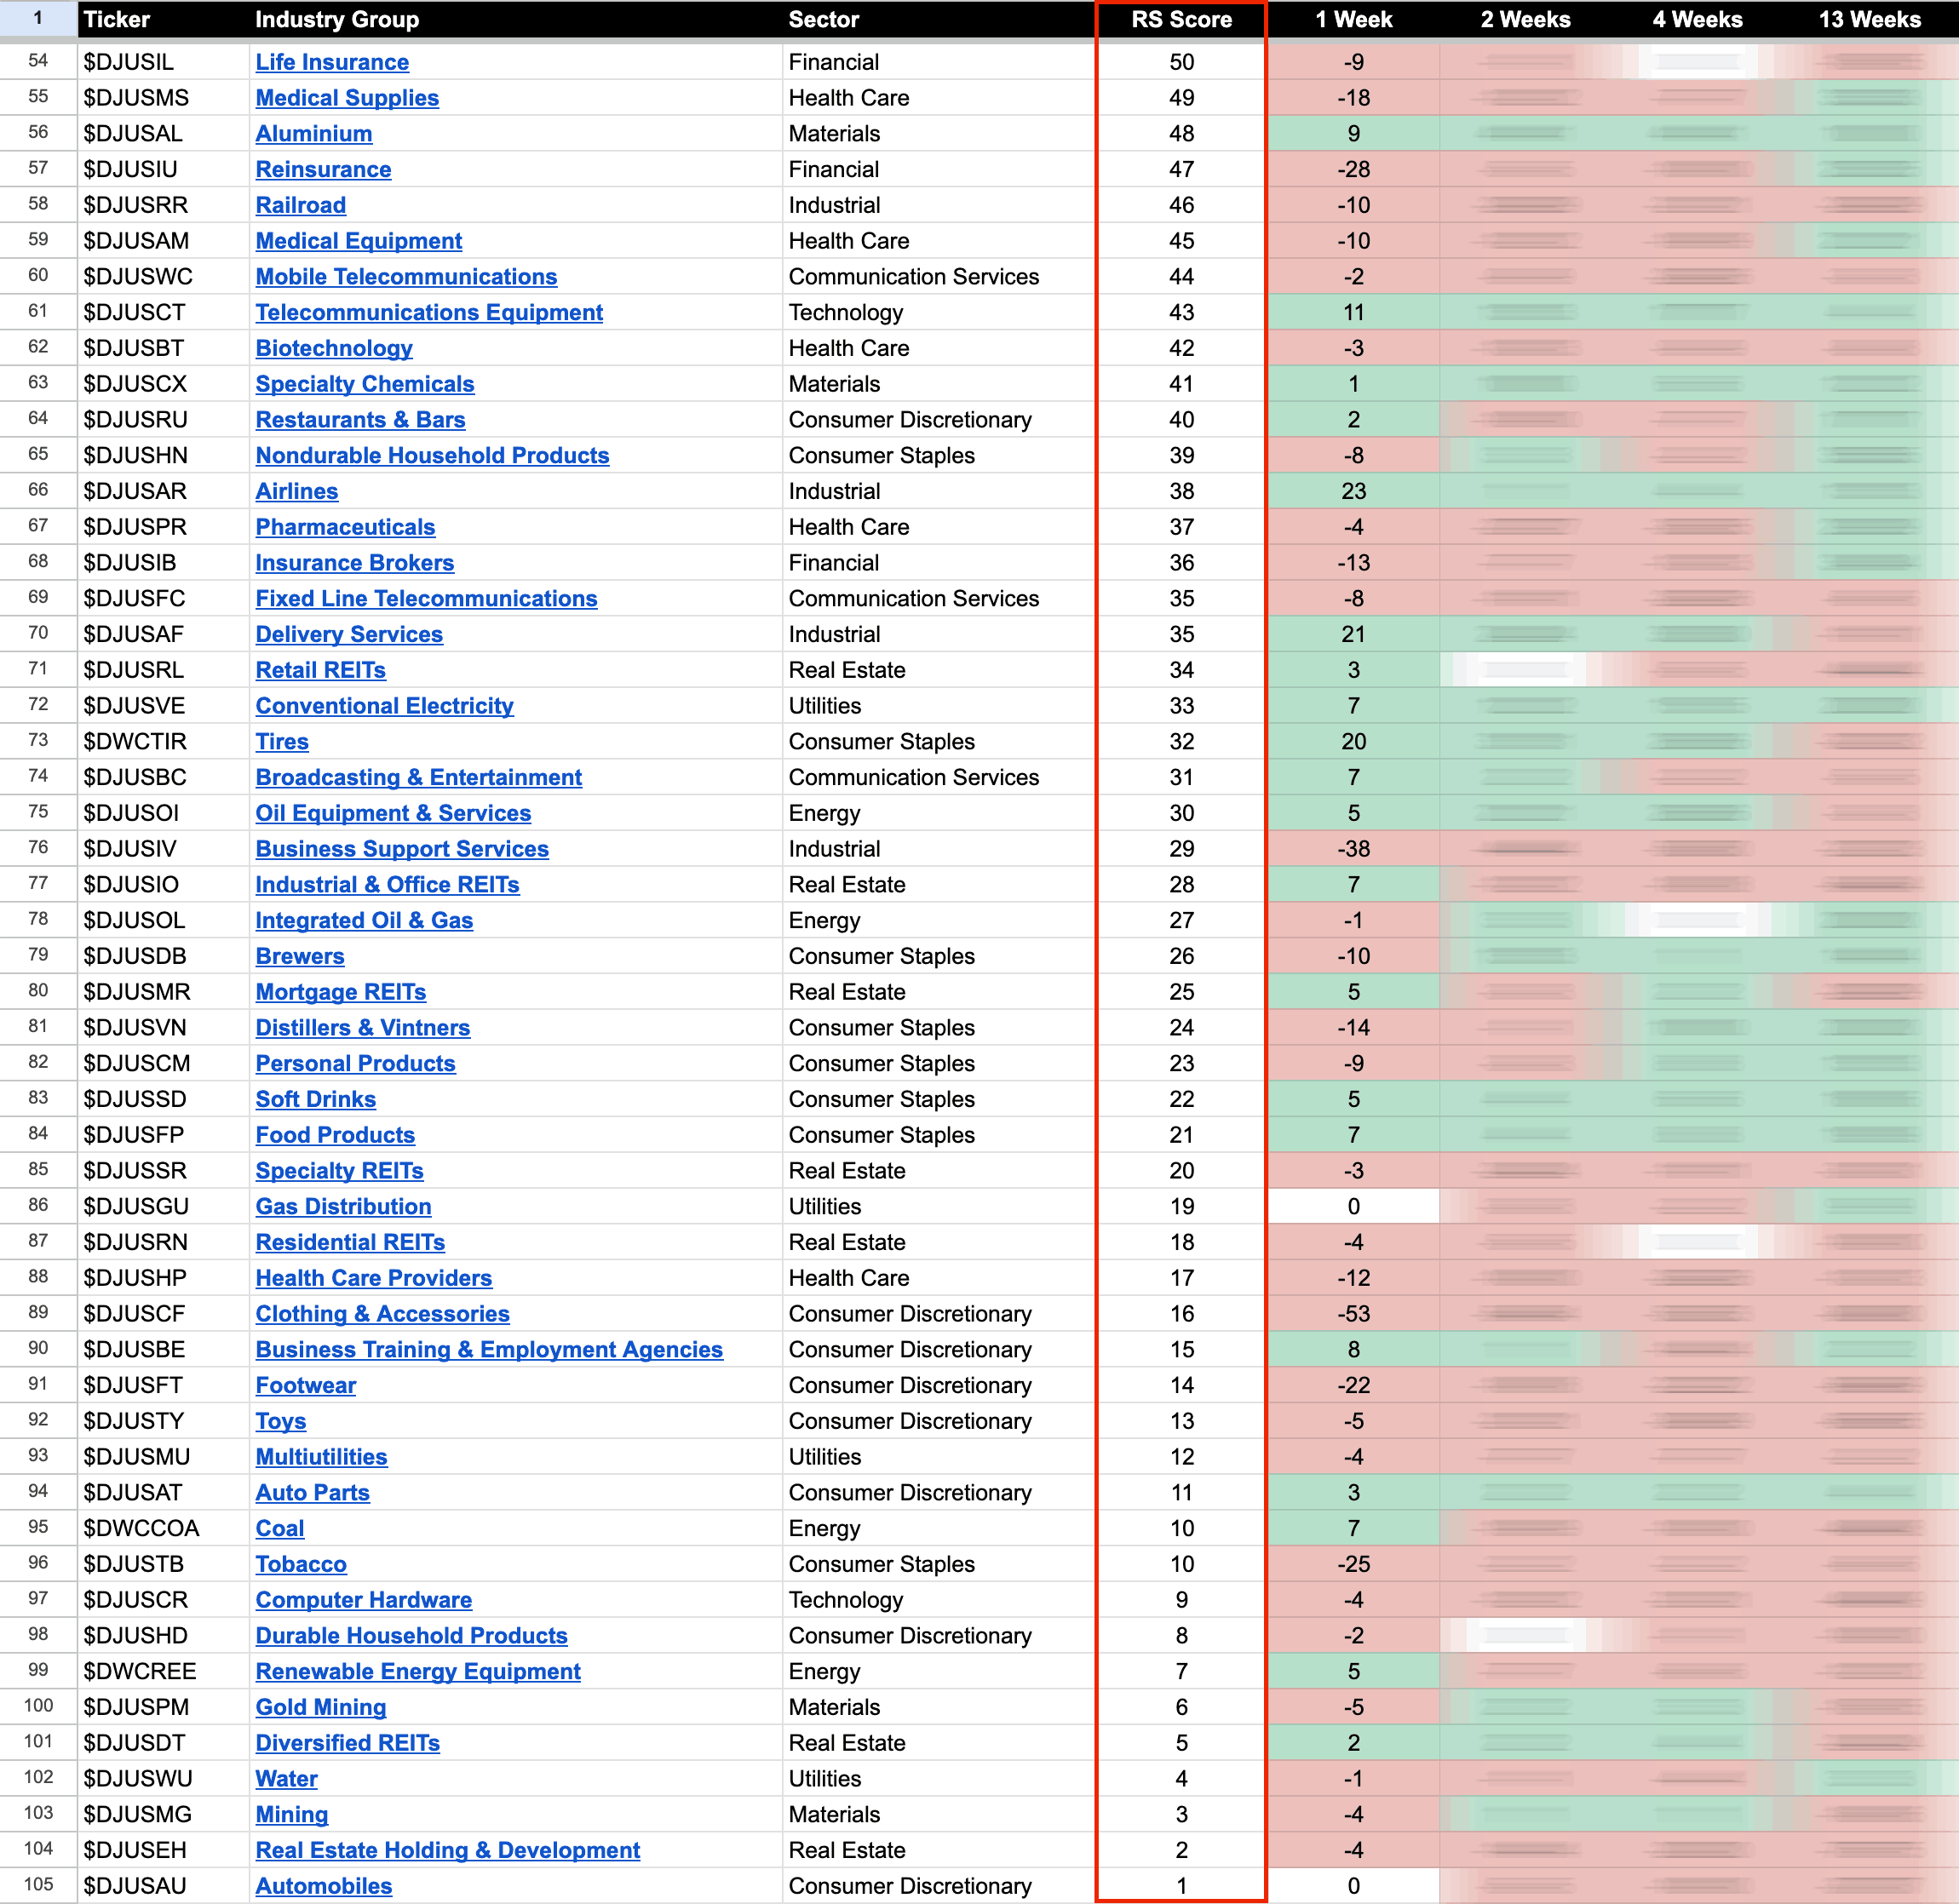
US Industry Groups by Weakest RS Score
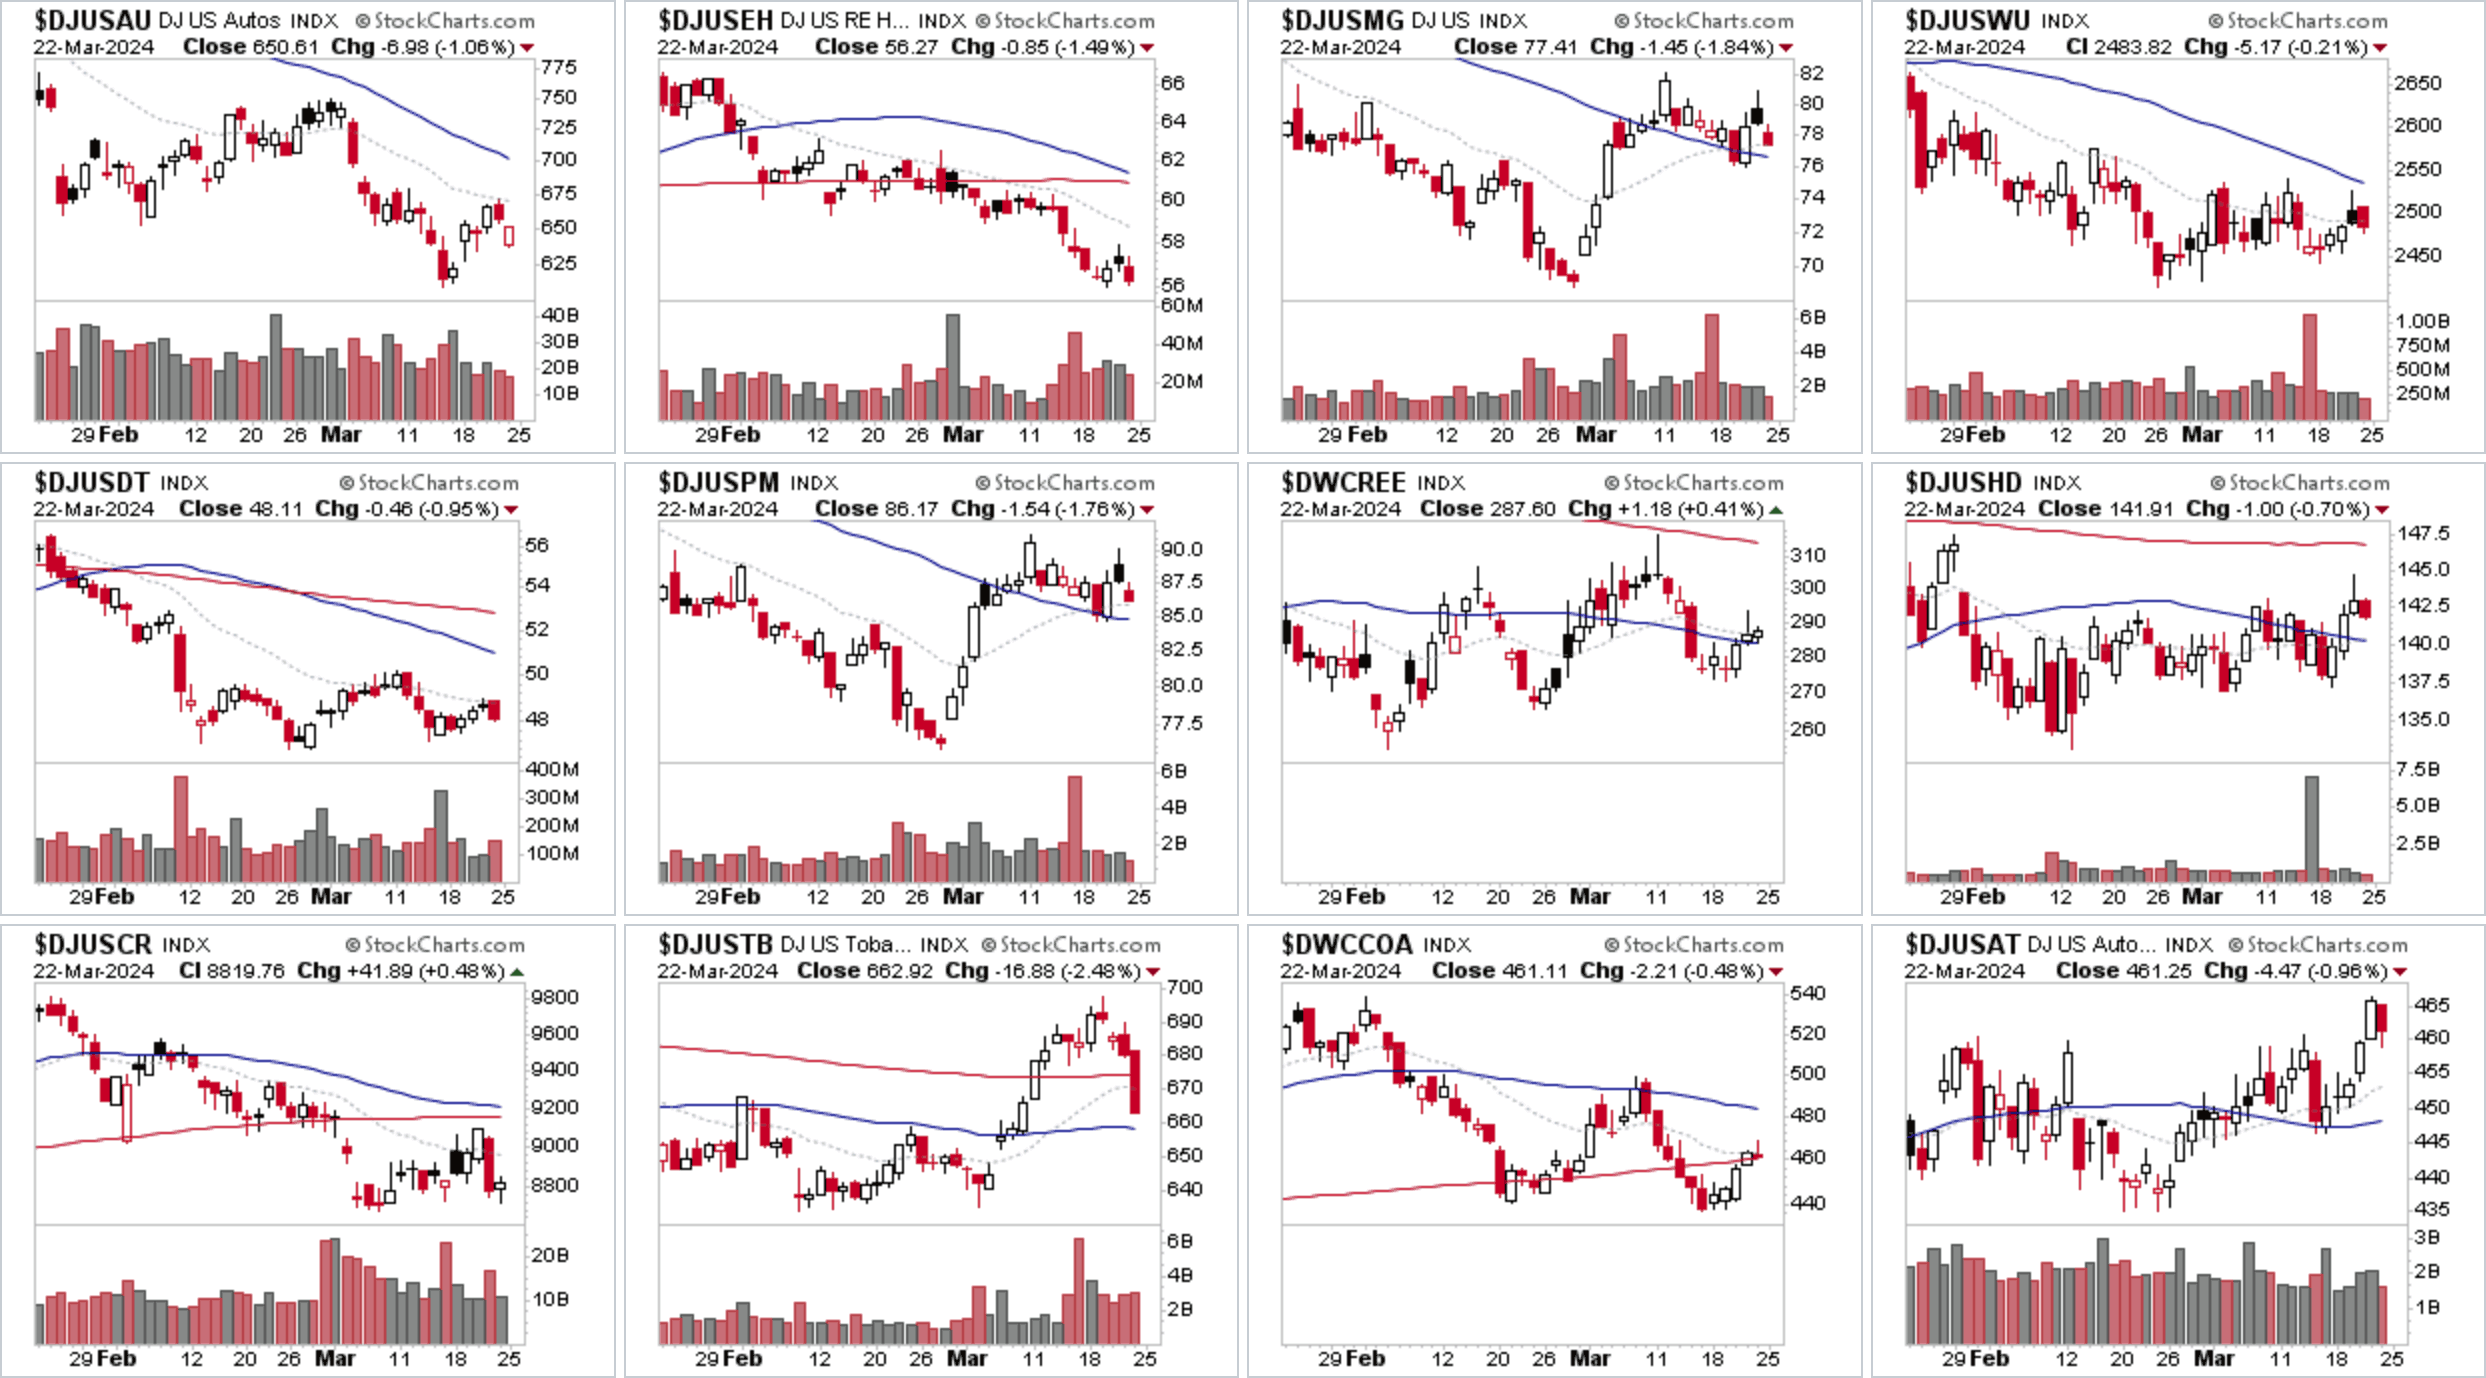
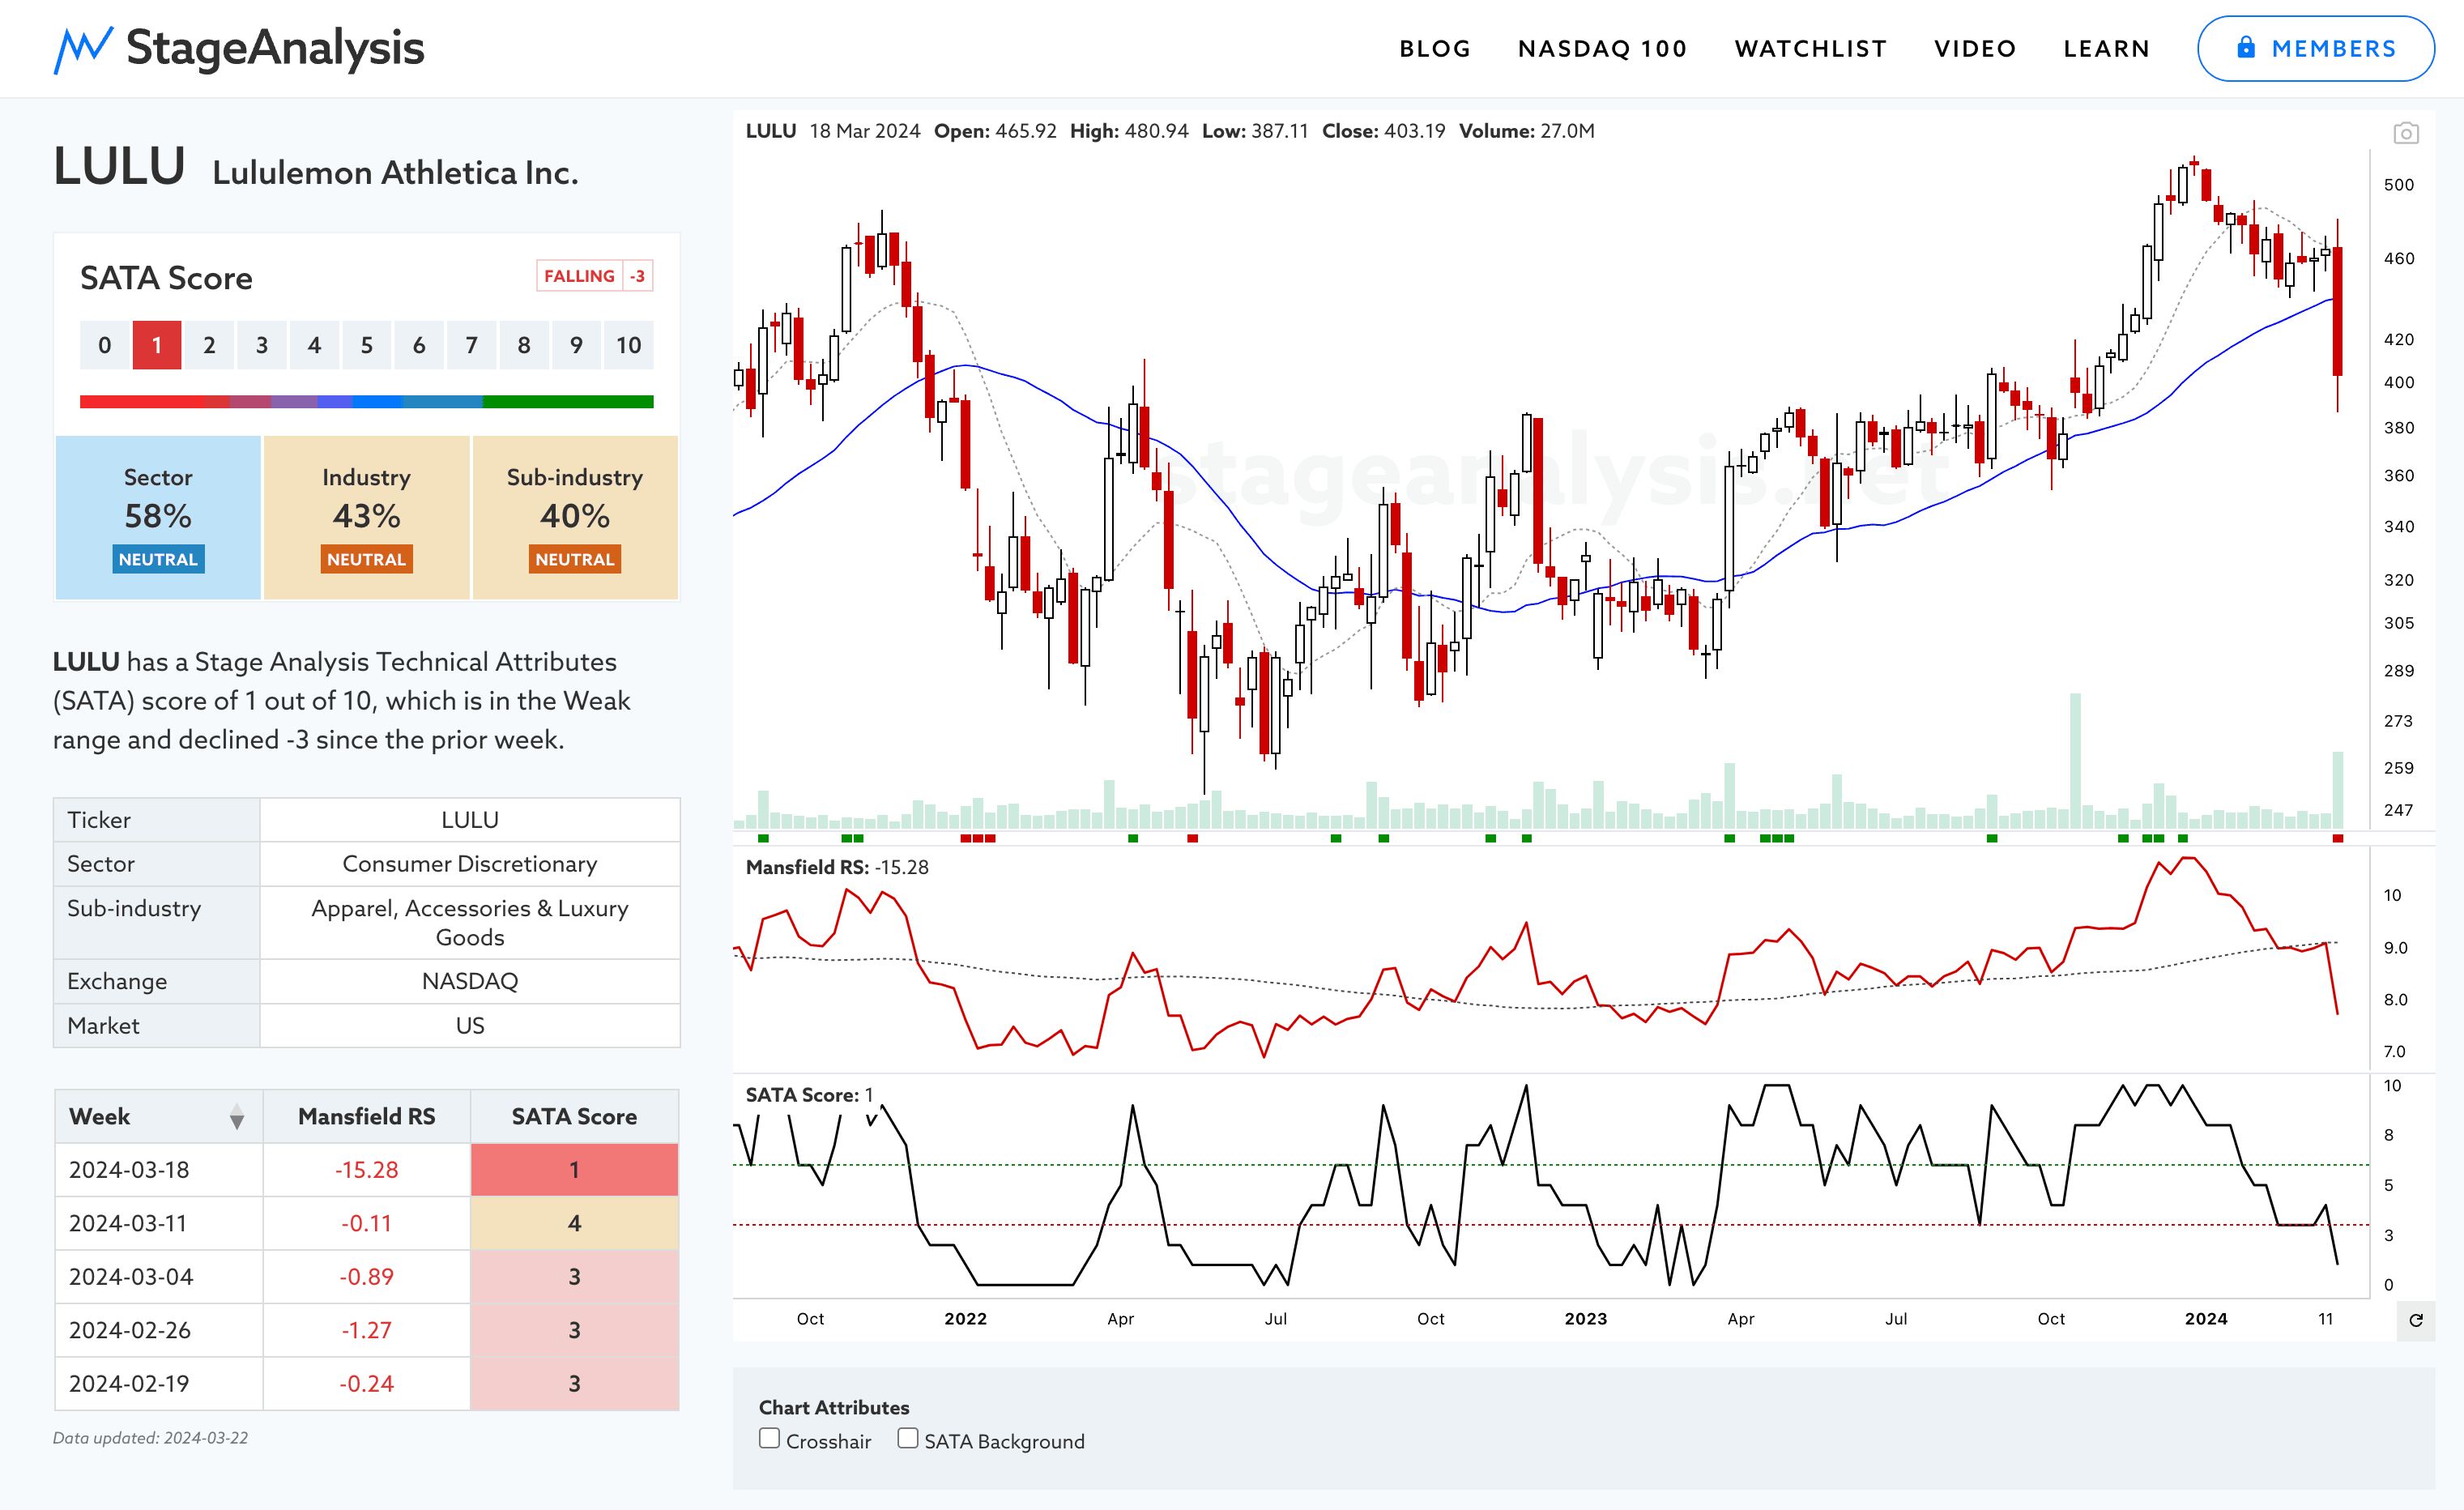
Automobiles ($DJUSAU) holds at the bottom of the RS rankings for another week. But Clothing & Accessories ($DJUSCF) had the weeks biggest decline in RS. Dropping a massive -53 RS places to 87th of 104 groups. Which was largely due to the big gap down in LULU that dropped in its Stage Analysis Technical Attributes (SATA) score to a very weak 1 of 10, and pushed its Mansfield RS a long way below its zero line – see its SATA chart below or visit the LULU stock page. Which is accessible by non-members, because it's in the Nasdaq 100.
US Industry Groups sorted by Relative Strength
The purpose of the Relative Strength (RS) tables is to track the short, medium and long-term RS changes of the individual groups to find the new leadership earlier than the crowd.
RS Score of 100 is the strongest, and 0 is the weakest.
In the Stage Analysis method we are looking to focus on the strongest groups, as what is strong, tends to stay strong for a long time. But we also want to find the improving / up and coming groups that are starting to rise up strongly through the RS table from the lower zone, in order to find the future leading stocks before they break out from a Stage 1 base and move into a Stage 2 advancing phase.
Each week I go through the most interesting groups on the move in more detail during the Stage Analysis Members weekend video – as Industry Group analysis is a key part of Stan Weinstein's Stage Analysis method.
Become a Stage Analysis Member:
To see more like this – US Stocks watchlist posts, detailed videos each weekend, use our unique Stage Analysis tools, such as the US Stocks & ETFs Screener, Charts, Market Breadth, Group Relative Strength and more...
Join Today
Disclaimer: For educational purpose only. Not investment advice. Seek professional advice from a financial advisor before making any investing decisions.