
Market Breadth: Percentage of Stocks Above their 50 Day, 150 Day & 200 Day Moving Averages Combined
The full post is available to view by members only. For immediate access:
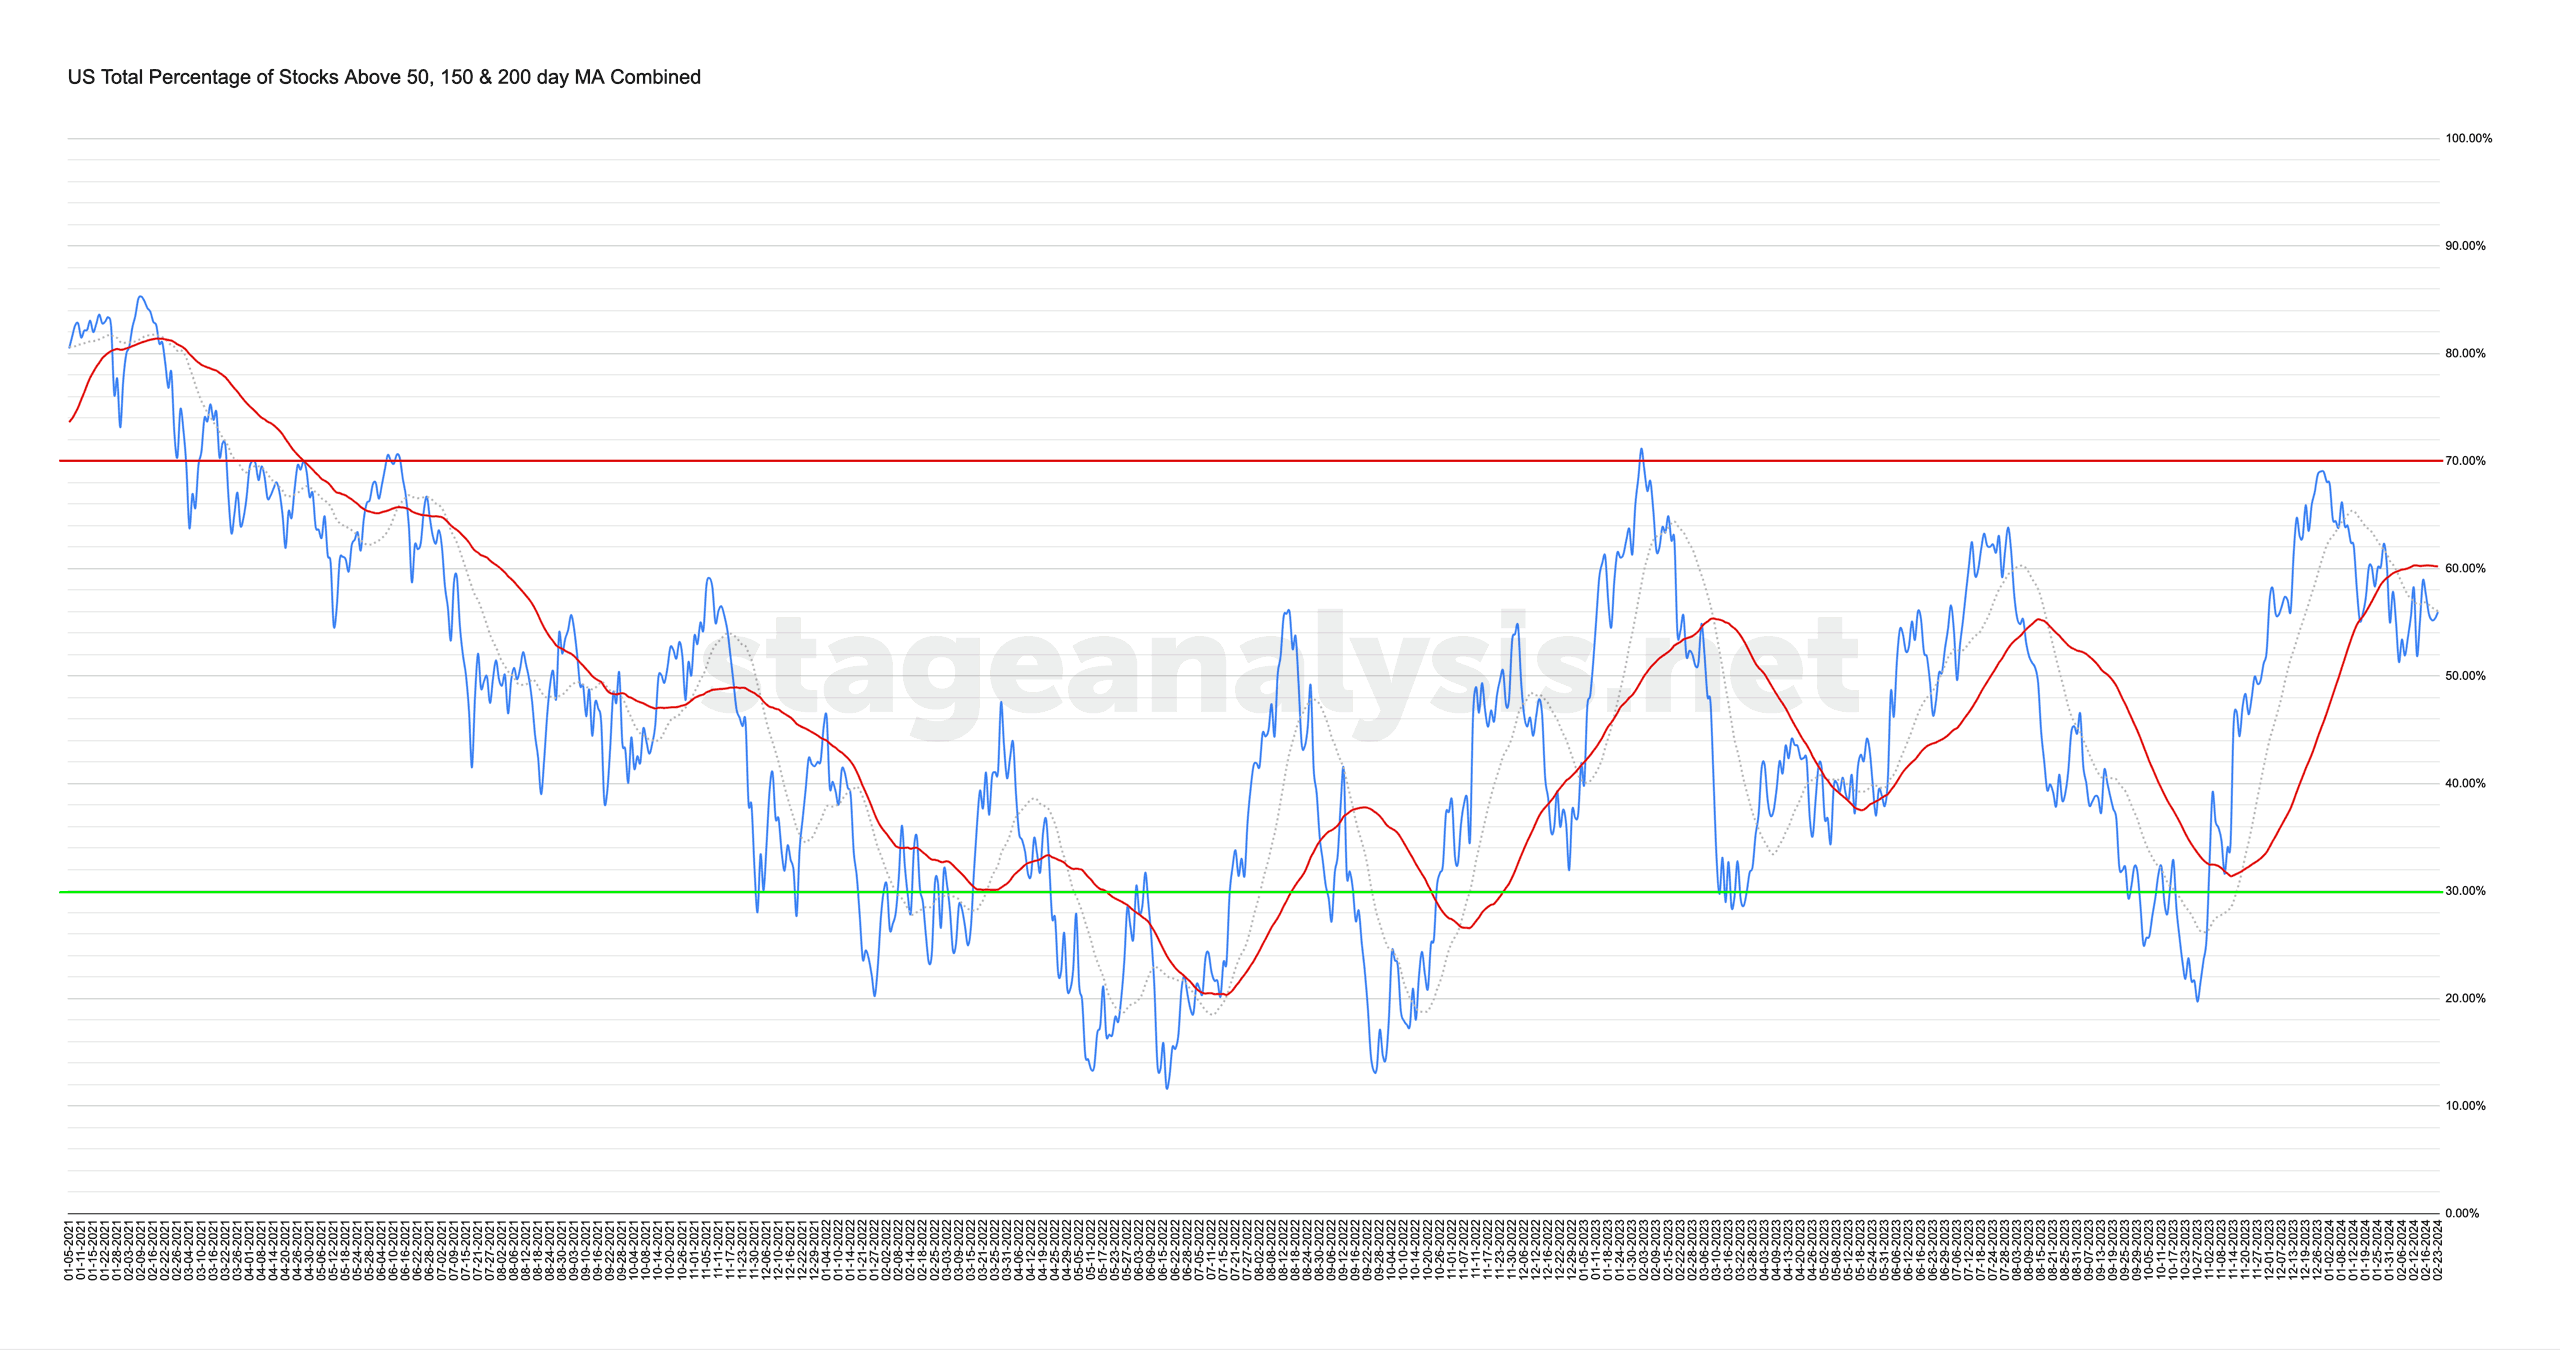
55.96% (-1.58% 1wk)
Status: Neutral / Difficult Environment (on the borderline between the two)
The US Total Percentage of Stocks above their 50 Day, 150 Day & 200 Day Moving Averages (shown above) decreased by -1.58% this week.
Therefore, the overall combined average is at 55.96% in the US market (NYSE and Nasdaq markets combined) above their short, medium and long term moving averages.
The combined average made a small move back below its 20 day MA on Tuesday, but ended the week slightly stronger back within -0.06% of the 20 day MA, but still -4.24% below it's 50 day MA (signal line), and so while technically on Difficult Environment status. With the consolidation around the MA I'd still class it as Neutral, with a field position remaining in the Neutral+ range (50% to 59.99%).
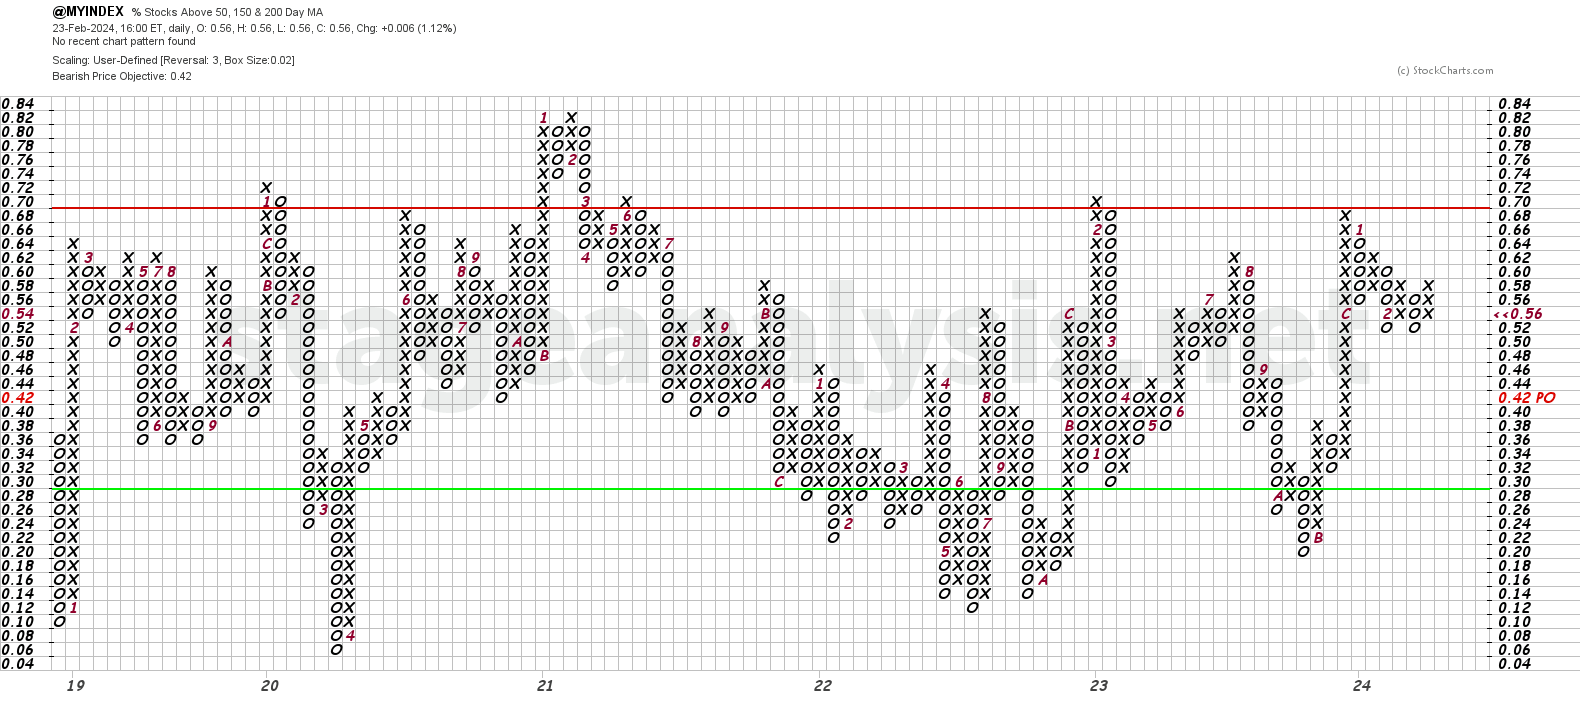
The Point and Figure (P&F) chart (shown above) was unchanged this week, remaining in Xs, and so the P&F strategy remains on Offense (as it is in a column of Xs), and the P&F status continues to be on Bear Correction status in the upper-middle range.
As last week, from its current position, a close above 60% would make a double top breakout, and change to Bull Confirmed, and a close below 52 would change it to Bear Confirmed. So remains in a very neutral spot currently, with the field position still leaning slightly on positive side at the moment.
See the Bullish Percent article for more information on the P&F statuses.
Become a Stage Analysis Member:
To see more like this – US Stocks watchlist posts, detailed videos each weekend, use our unique Stage Analysis tools, such as the US Stocks & ETFs Screener, Charts, Market Breadth, Group Relative Strength and more...
Join Today
Disclaimer: For educational purpose only. Not investment advice. Seek professional advice from a financial advisor before making any investing decisions.