
Stage Analysis Technical Attributes Scores – Nasdaq 100
The full post is available to view by members only. For immediate access:
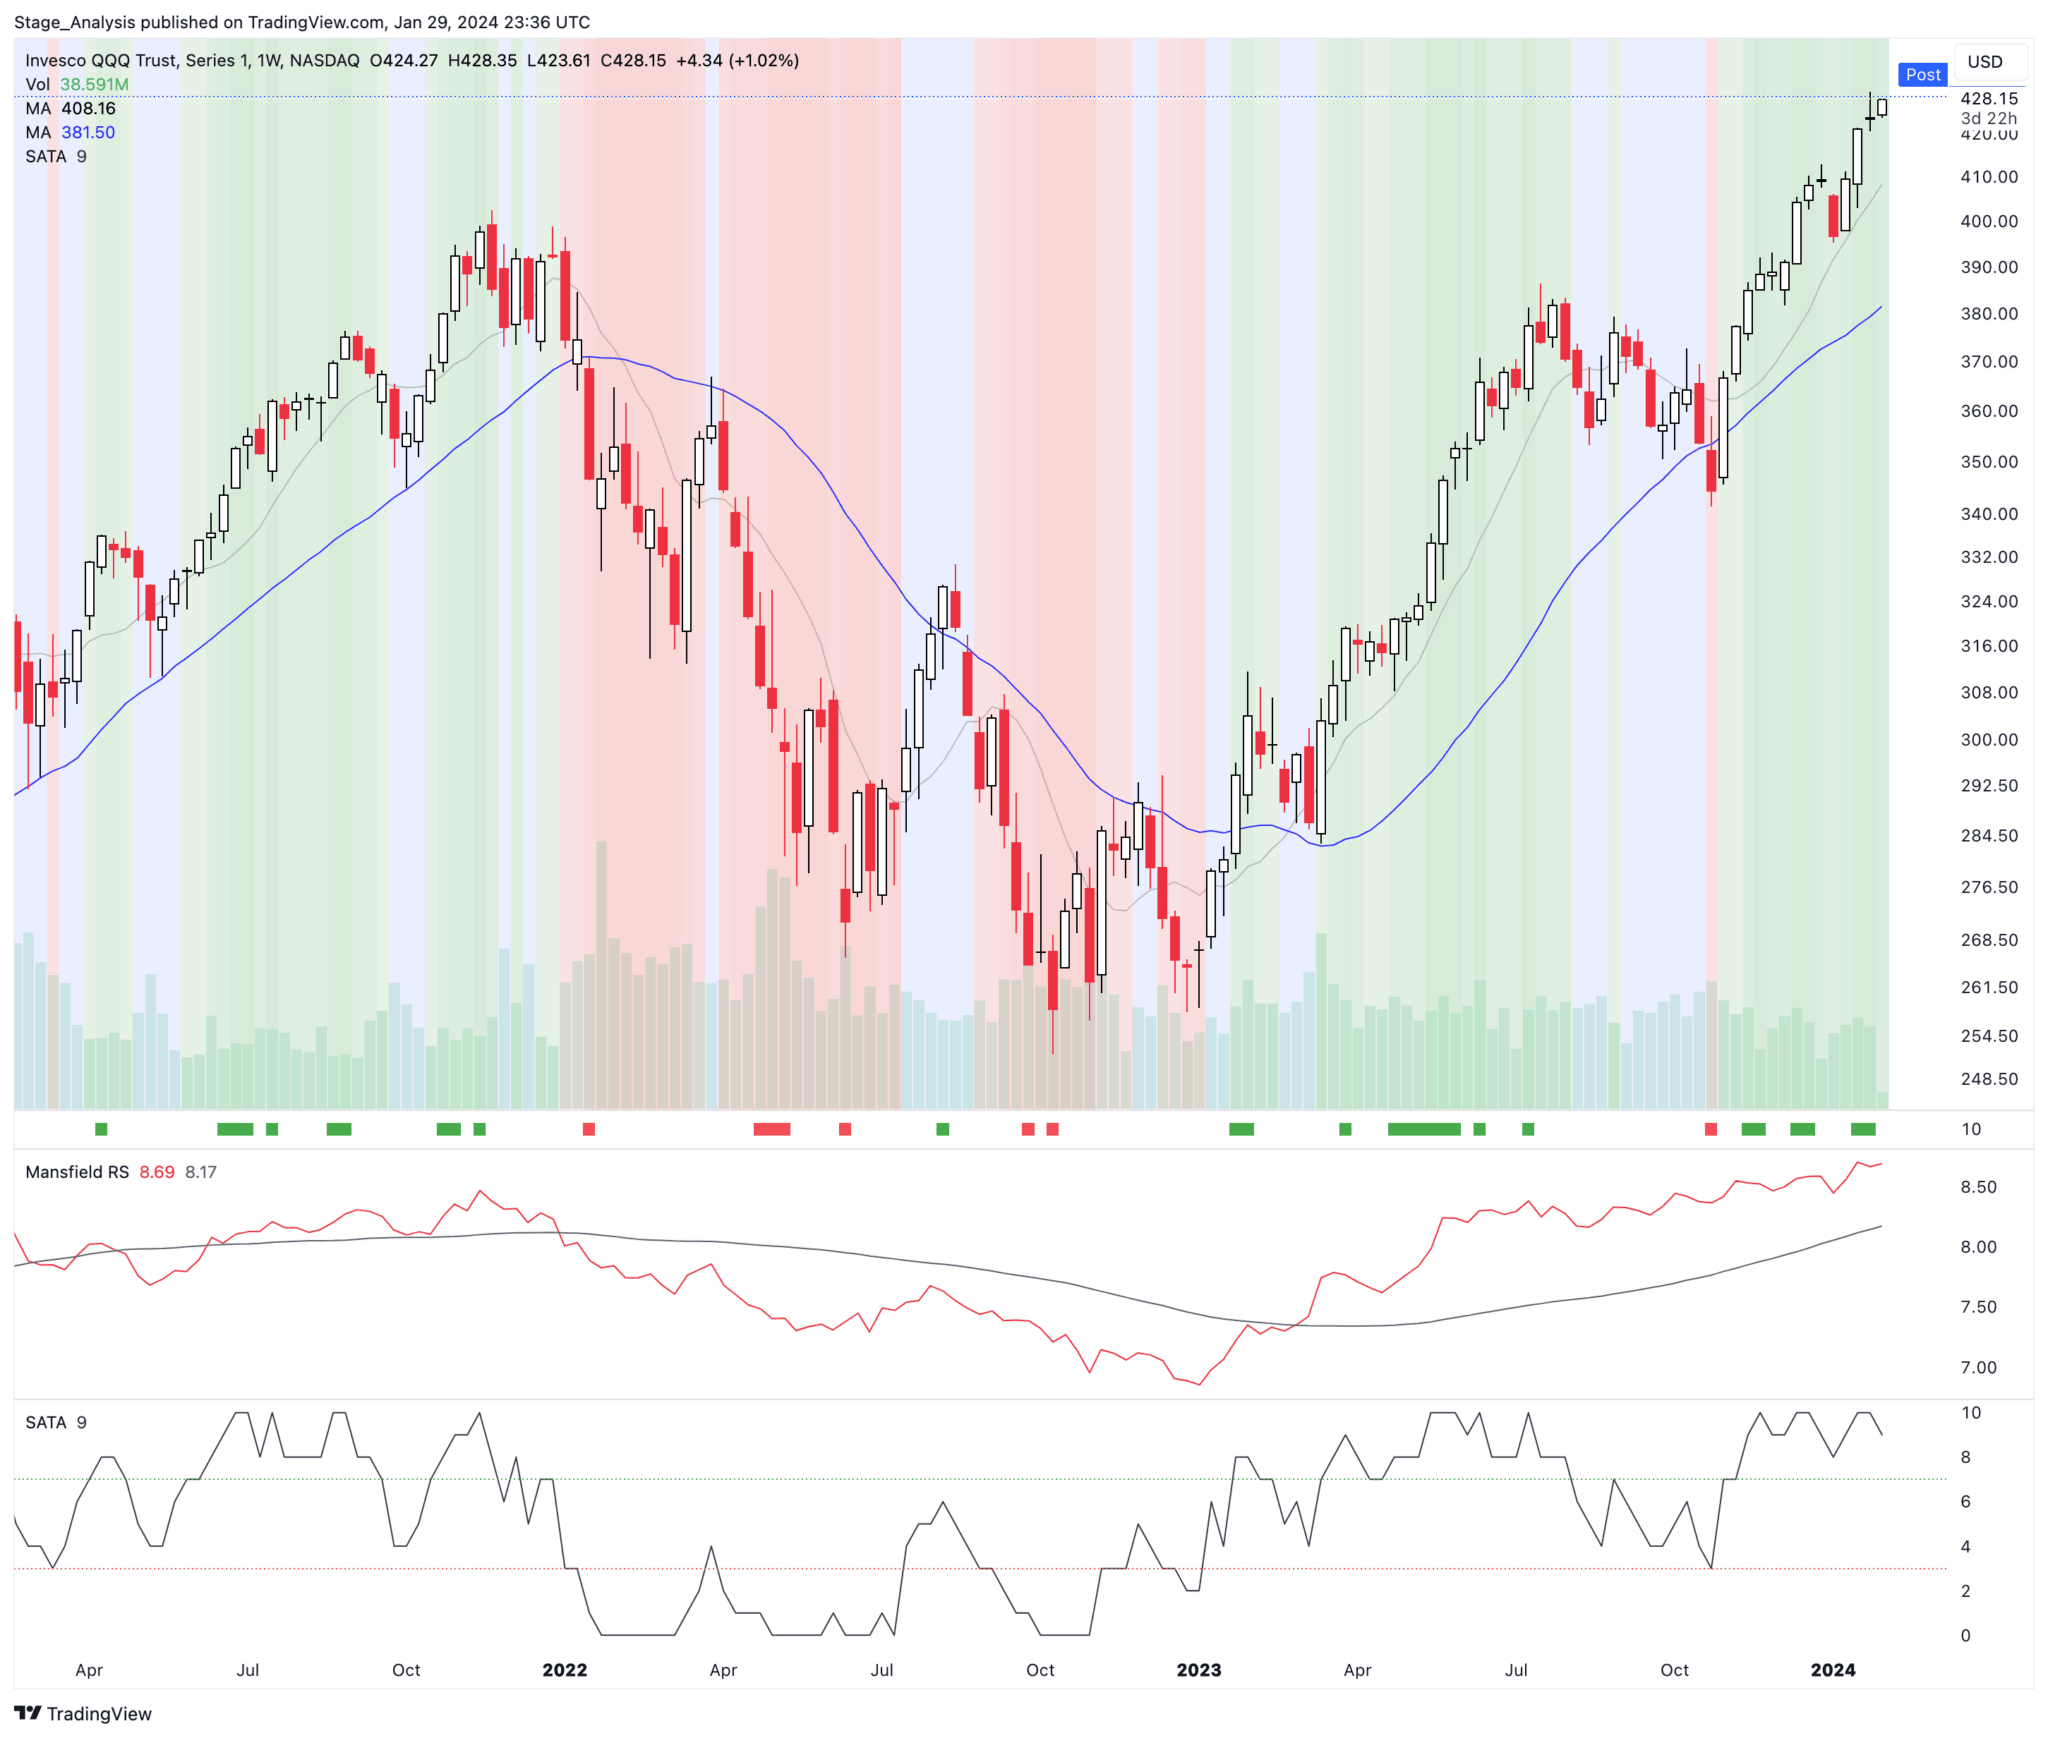
The Stage Analysis Technical Attributes (SATA) score is our proprietary indicator that helps to identify the four stages from Stan Weinstein's Stage Analysis method, using a scoring system from 0 to 10 that rates ten of the key technical characteristics that we look for when analysing the weekly charts.
We last covered the weekly SATA scores for the Nasdaq 100 back on 15th January, which gives a rough guide of the Stages of the individual stocks within the Nasdaq 100. i.e. everything above a 7 would be considered in the Stage 2 zone (Strong), 4-6 in the Stage 1 or Stage 3 zone (Neutral), and 3 or below is the Stage 4 zone (Weak).
Currently the Nasdaq 100 consists of:
- 60% Stage 2 zone (Strong)
- 26% Stage 1 or Stage 3 zone (Neutral)
- 14% Stage 4 zone (Weak)
Percentage of stocks with a technically healthy SATA Score (6+): 72%
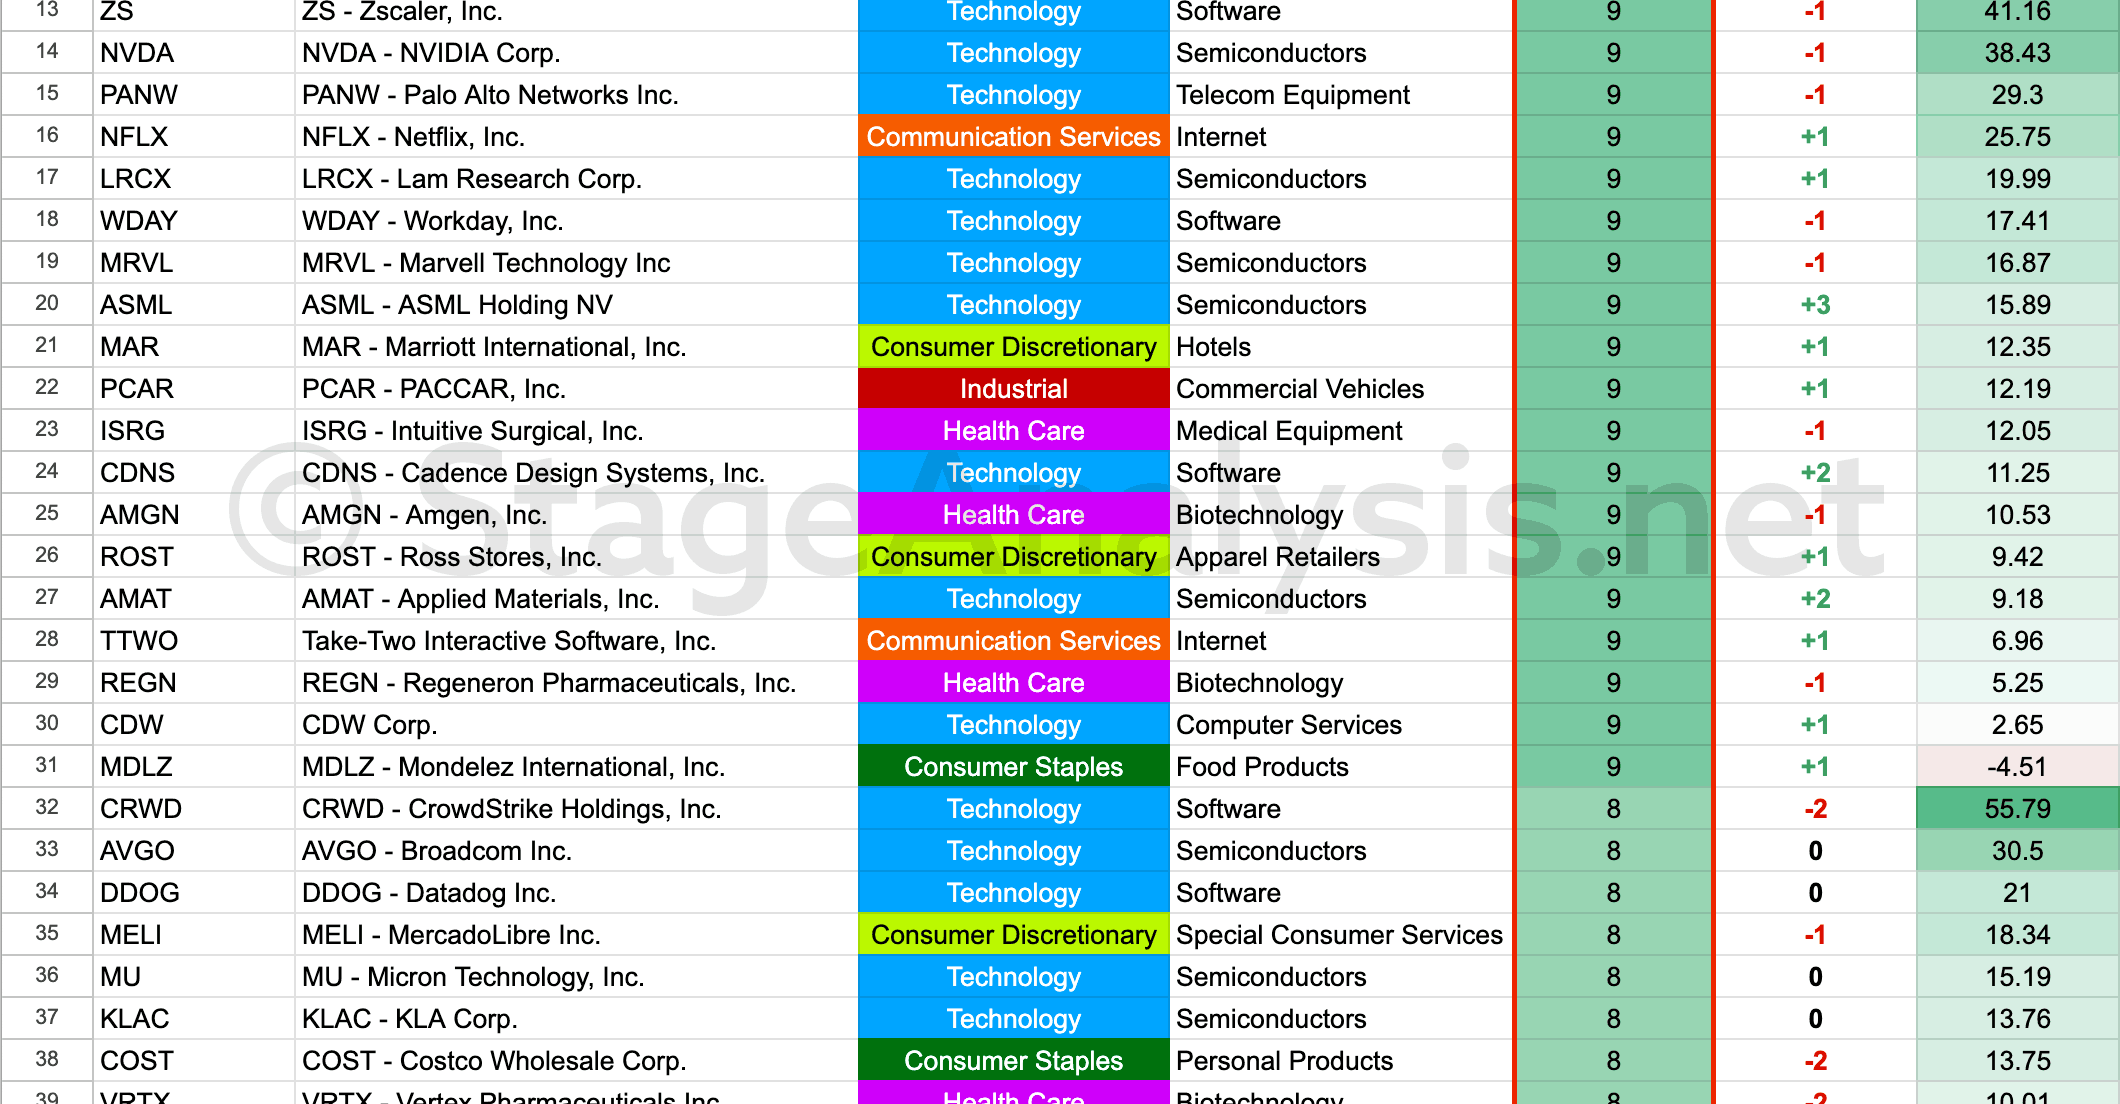
Sample of the SATA scores
This weeks full length post is for Stage Analysis Members only, but you can see a full, unlocked post from early October as an example if you are interested in seeing this very useful data regularly. Go to: Stage Analysis Technical Attributes Scores – Nasdaq 100 – 2nd October 2023
SATA Scores and Screener Update
We've been making some good progress since the last update, and are starting to get the stock, SATA and Mansfield RS data into the main website currently. We are only using a small sample set of the US market at the moment via the Nasdaq 100 for testing purposes. But once that's been approved and updating daily, we'll get that live, and expand to the broader US market once it's stable, and then start to consider some international markets too.
You may have seen some of the Twitter / X posts last week where some of the SATA screens were highlighted, but if you didn't, here's a few of the initial screens that have already been coded and have been working via the local app so far:
- SATA Score of 10 in current week
- Stocks with SATA score in the 0 to 3 range (Weak)
- Percentage on stocks on SATA 6+ (Technically Healthy)
- Stocks where SATA Score dropped three to ten SATA points in last four weeks
- Stocks that have moved above SATA 7 (i.e. into the Strong zone) this week
The numbers and ranges can be adjusted between 0 and 10 on all, so a lot of possibilities just in these initial scans to help to find stocks that meet the Stage Analysis methods criteria on both the long and short side.
Become a Stage Analysis Member:
To see more like this – US Stocks watchlist posts, detailed videos each weekend, use our unique Stage Analysis tools, such as the US Stocks & ETFs Screener, Charts, Market Breadth, Group Relative Strength and more...
Join Today
Disclaimer: For educational purpose only. Not investment advice. Seek professional advice from a financial advisor before making any investing decisions.