
Stage Analysis Technical Attributes Scores – Nasdaq 100
The full post is available to view by members only. For immediate access:
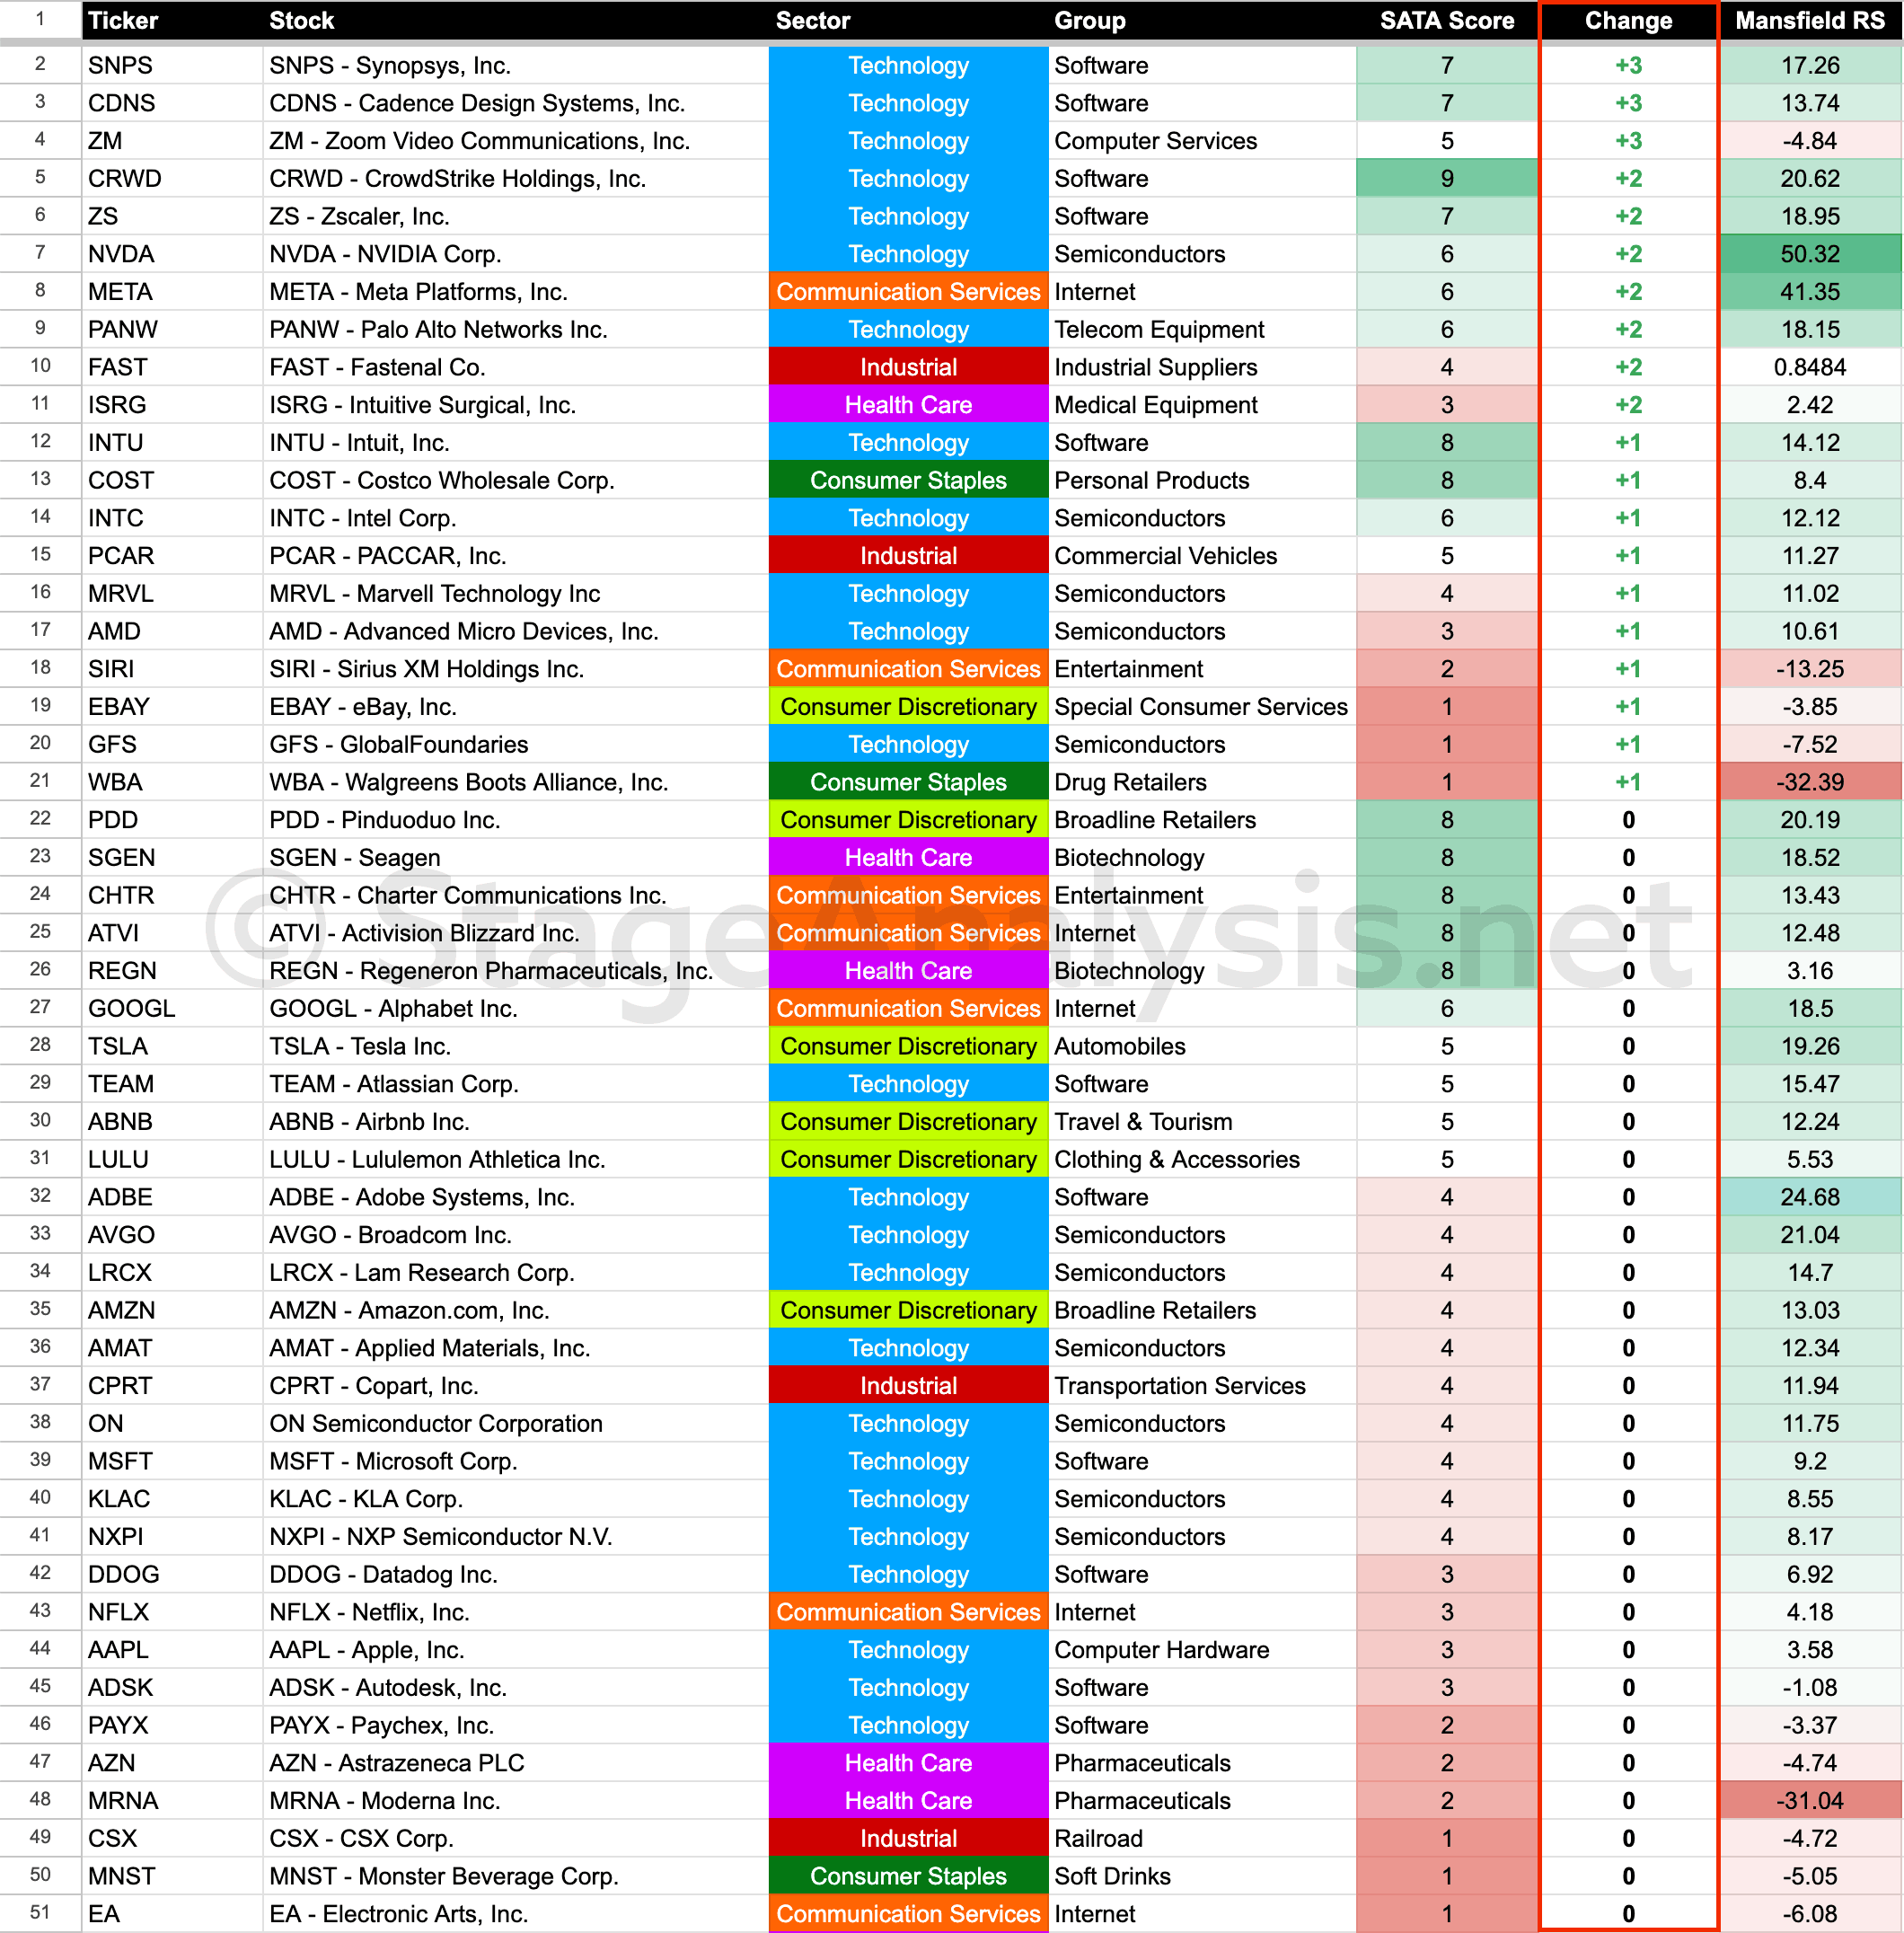
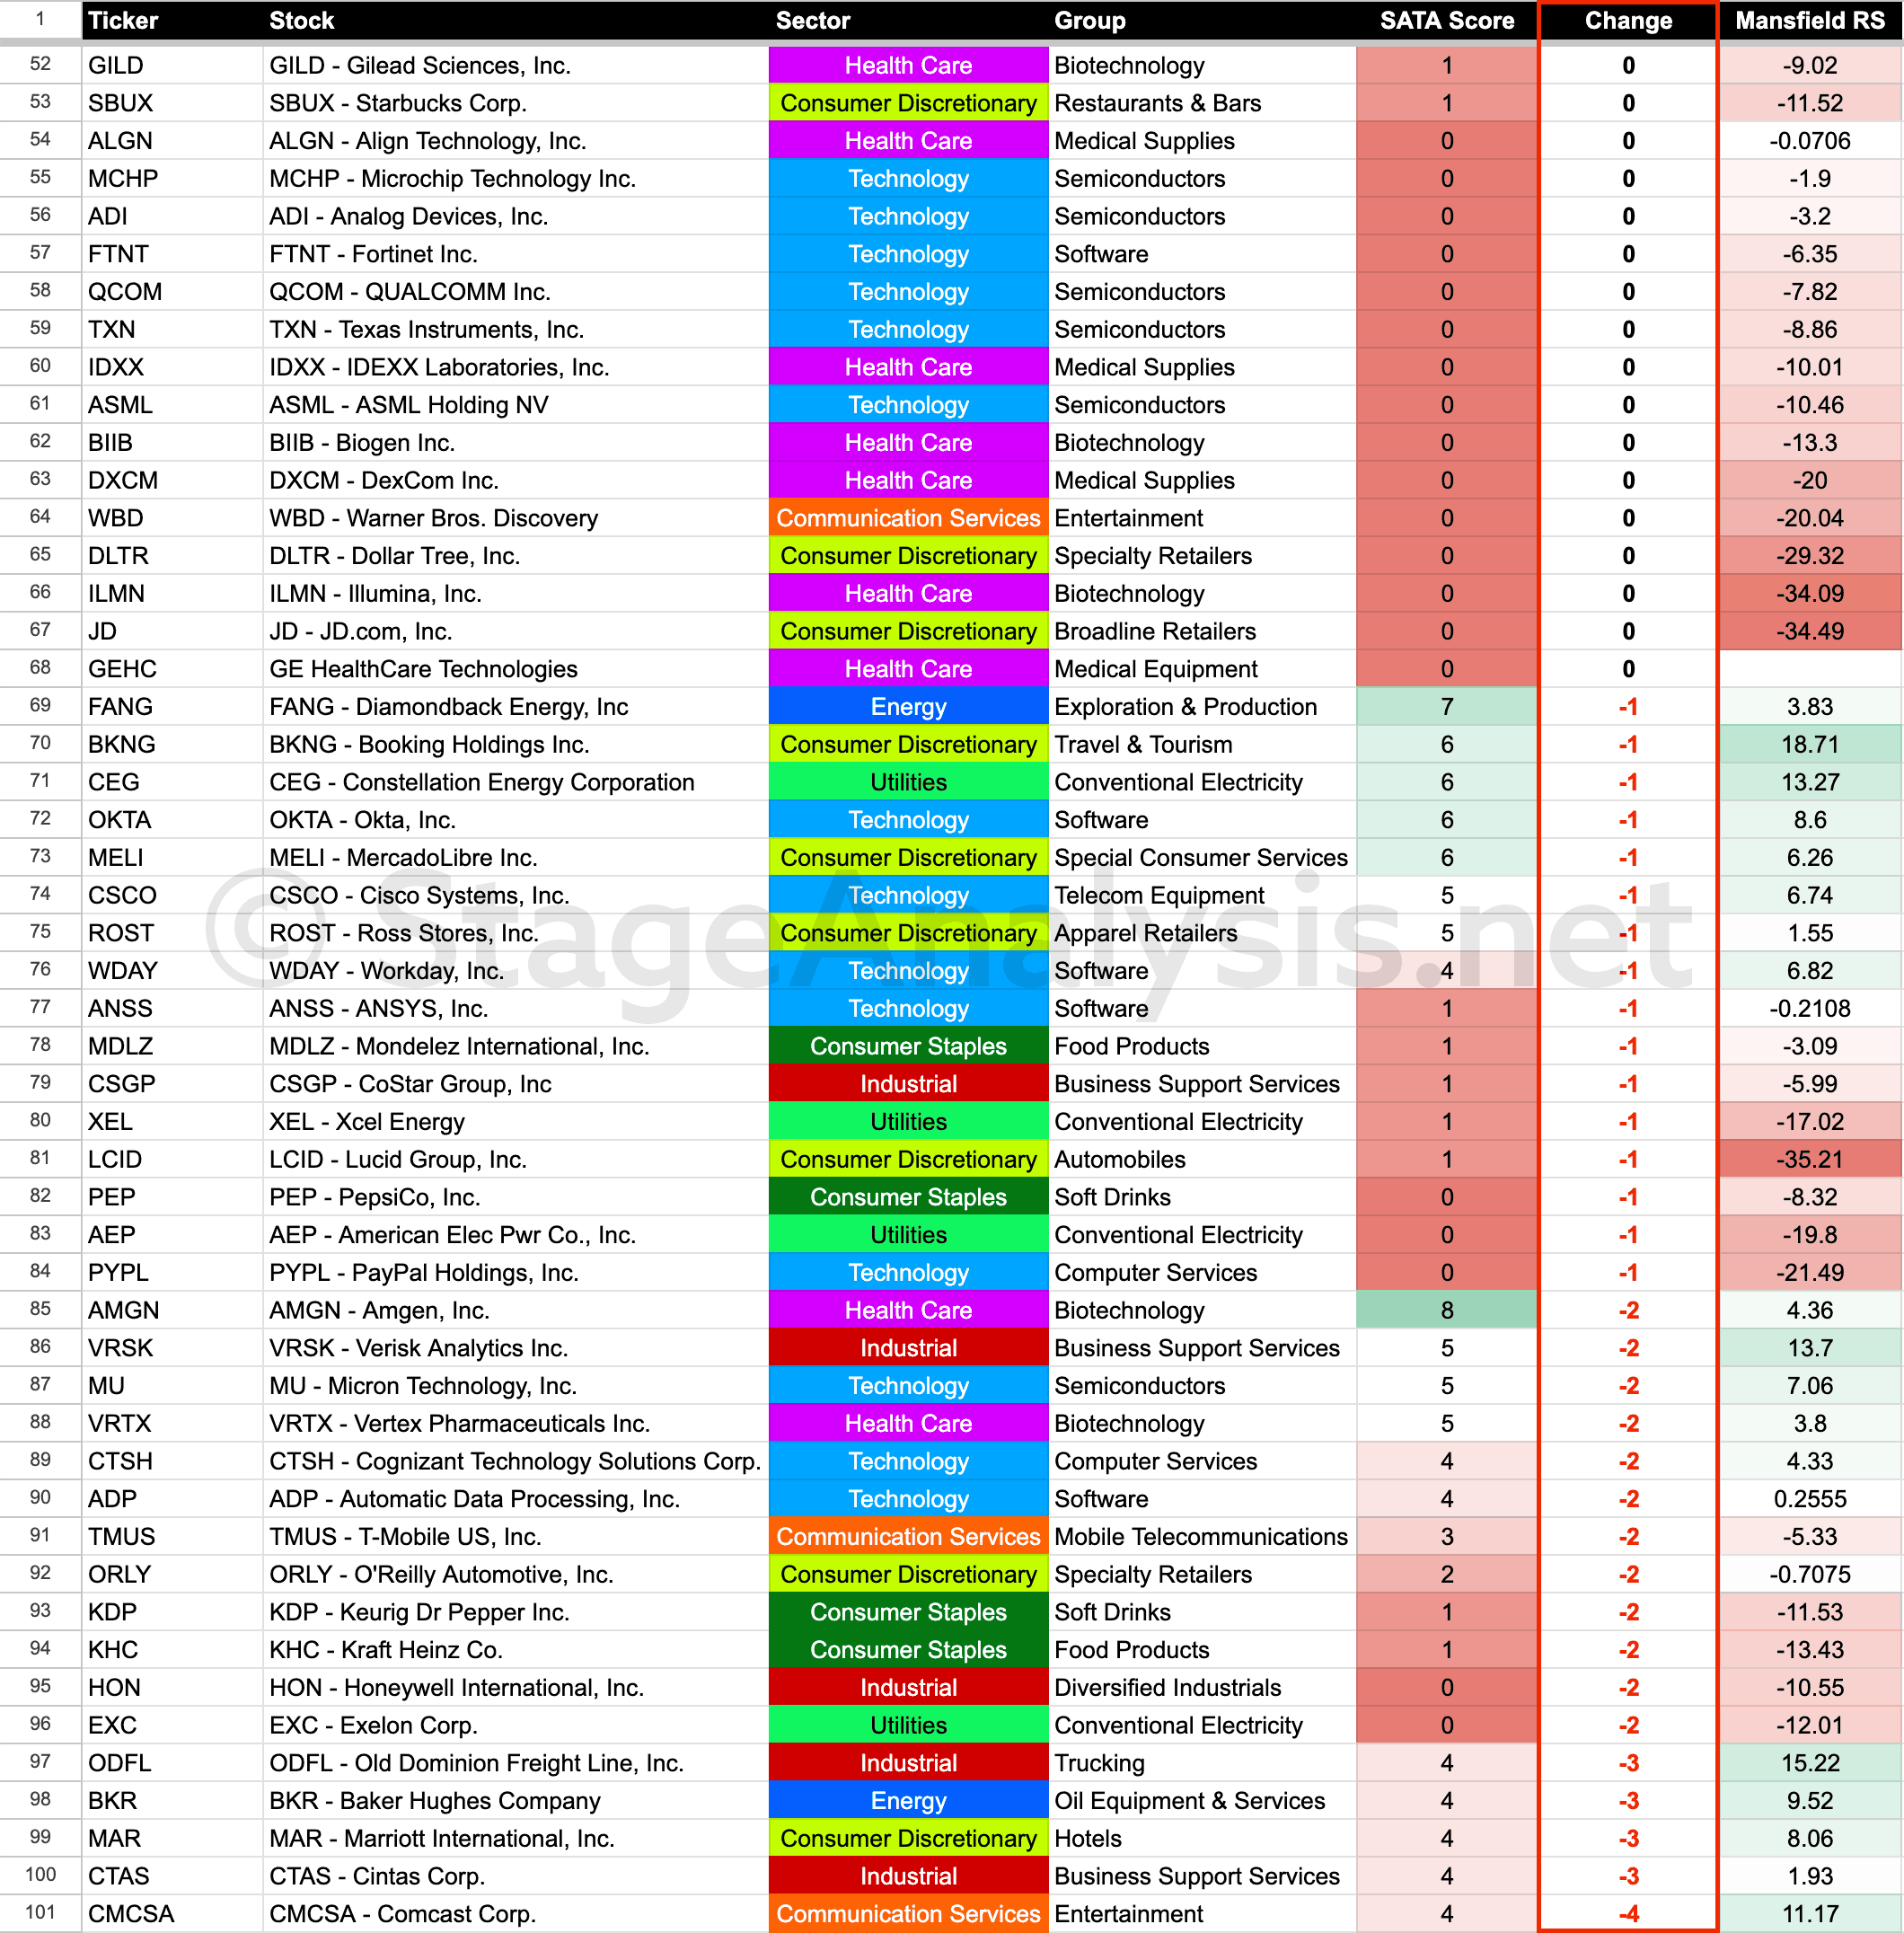
The Stage Analysis Technical Attributes (SATA) score is our proprietary indicator that helps to identify the four stages from Stan Weinstein's Stage Analysis method, using a scoring system from 0 to 10 that rates ten of the key technical characteristics that we look for when analysing the weekly charts.
We last covered the weekly SATA scores for the Nasdaq 100 back on 21st September, which gives a rough guide of the Stages of the individual stocks within the Nasdaq 100. i.e. everything above a 7 would be considered in the Stage 2 zone (Strong), 4-6 in the Stage 1 or Stage 3 zone (Neutral), and 3 or below is the Stage 4 zone (Weak).
Currently the Nasdaq 100 consists of:
- 13% Stage 2 zone (Strong)
- 40% Stage 1 or Stage 3 zone (Neutral)
- 47% Stage 4 zone (Weak)
Percentage of stocks with a technically healthy SATA Score (6+): 22%
Compared to the 21st September post there was a decline of -9% of stocks in the Stage 2 zone, +10% more stocks in the Stage 1 or Stage 3 zone, and -1% less stocks in the Stage 4 zone, with the overall weighting continuing to decline into the negative territory with only 22% of the Nasdaq 100 stocks in a technically healthy position (based on their SATA score data). So that's a further decline of -5% since a few weeks ago.
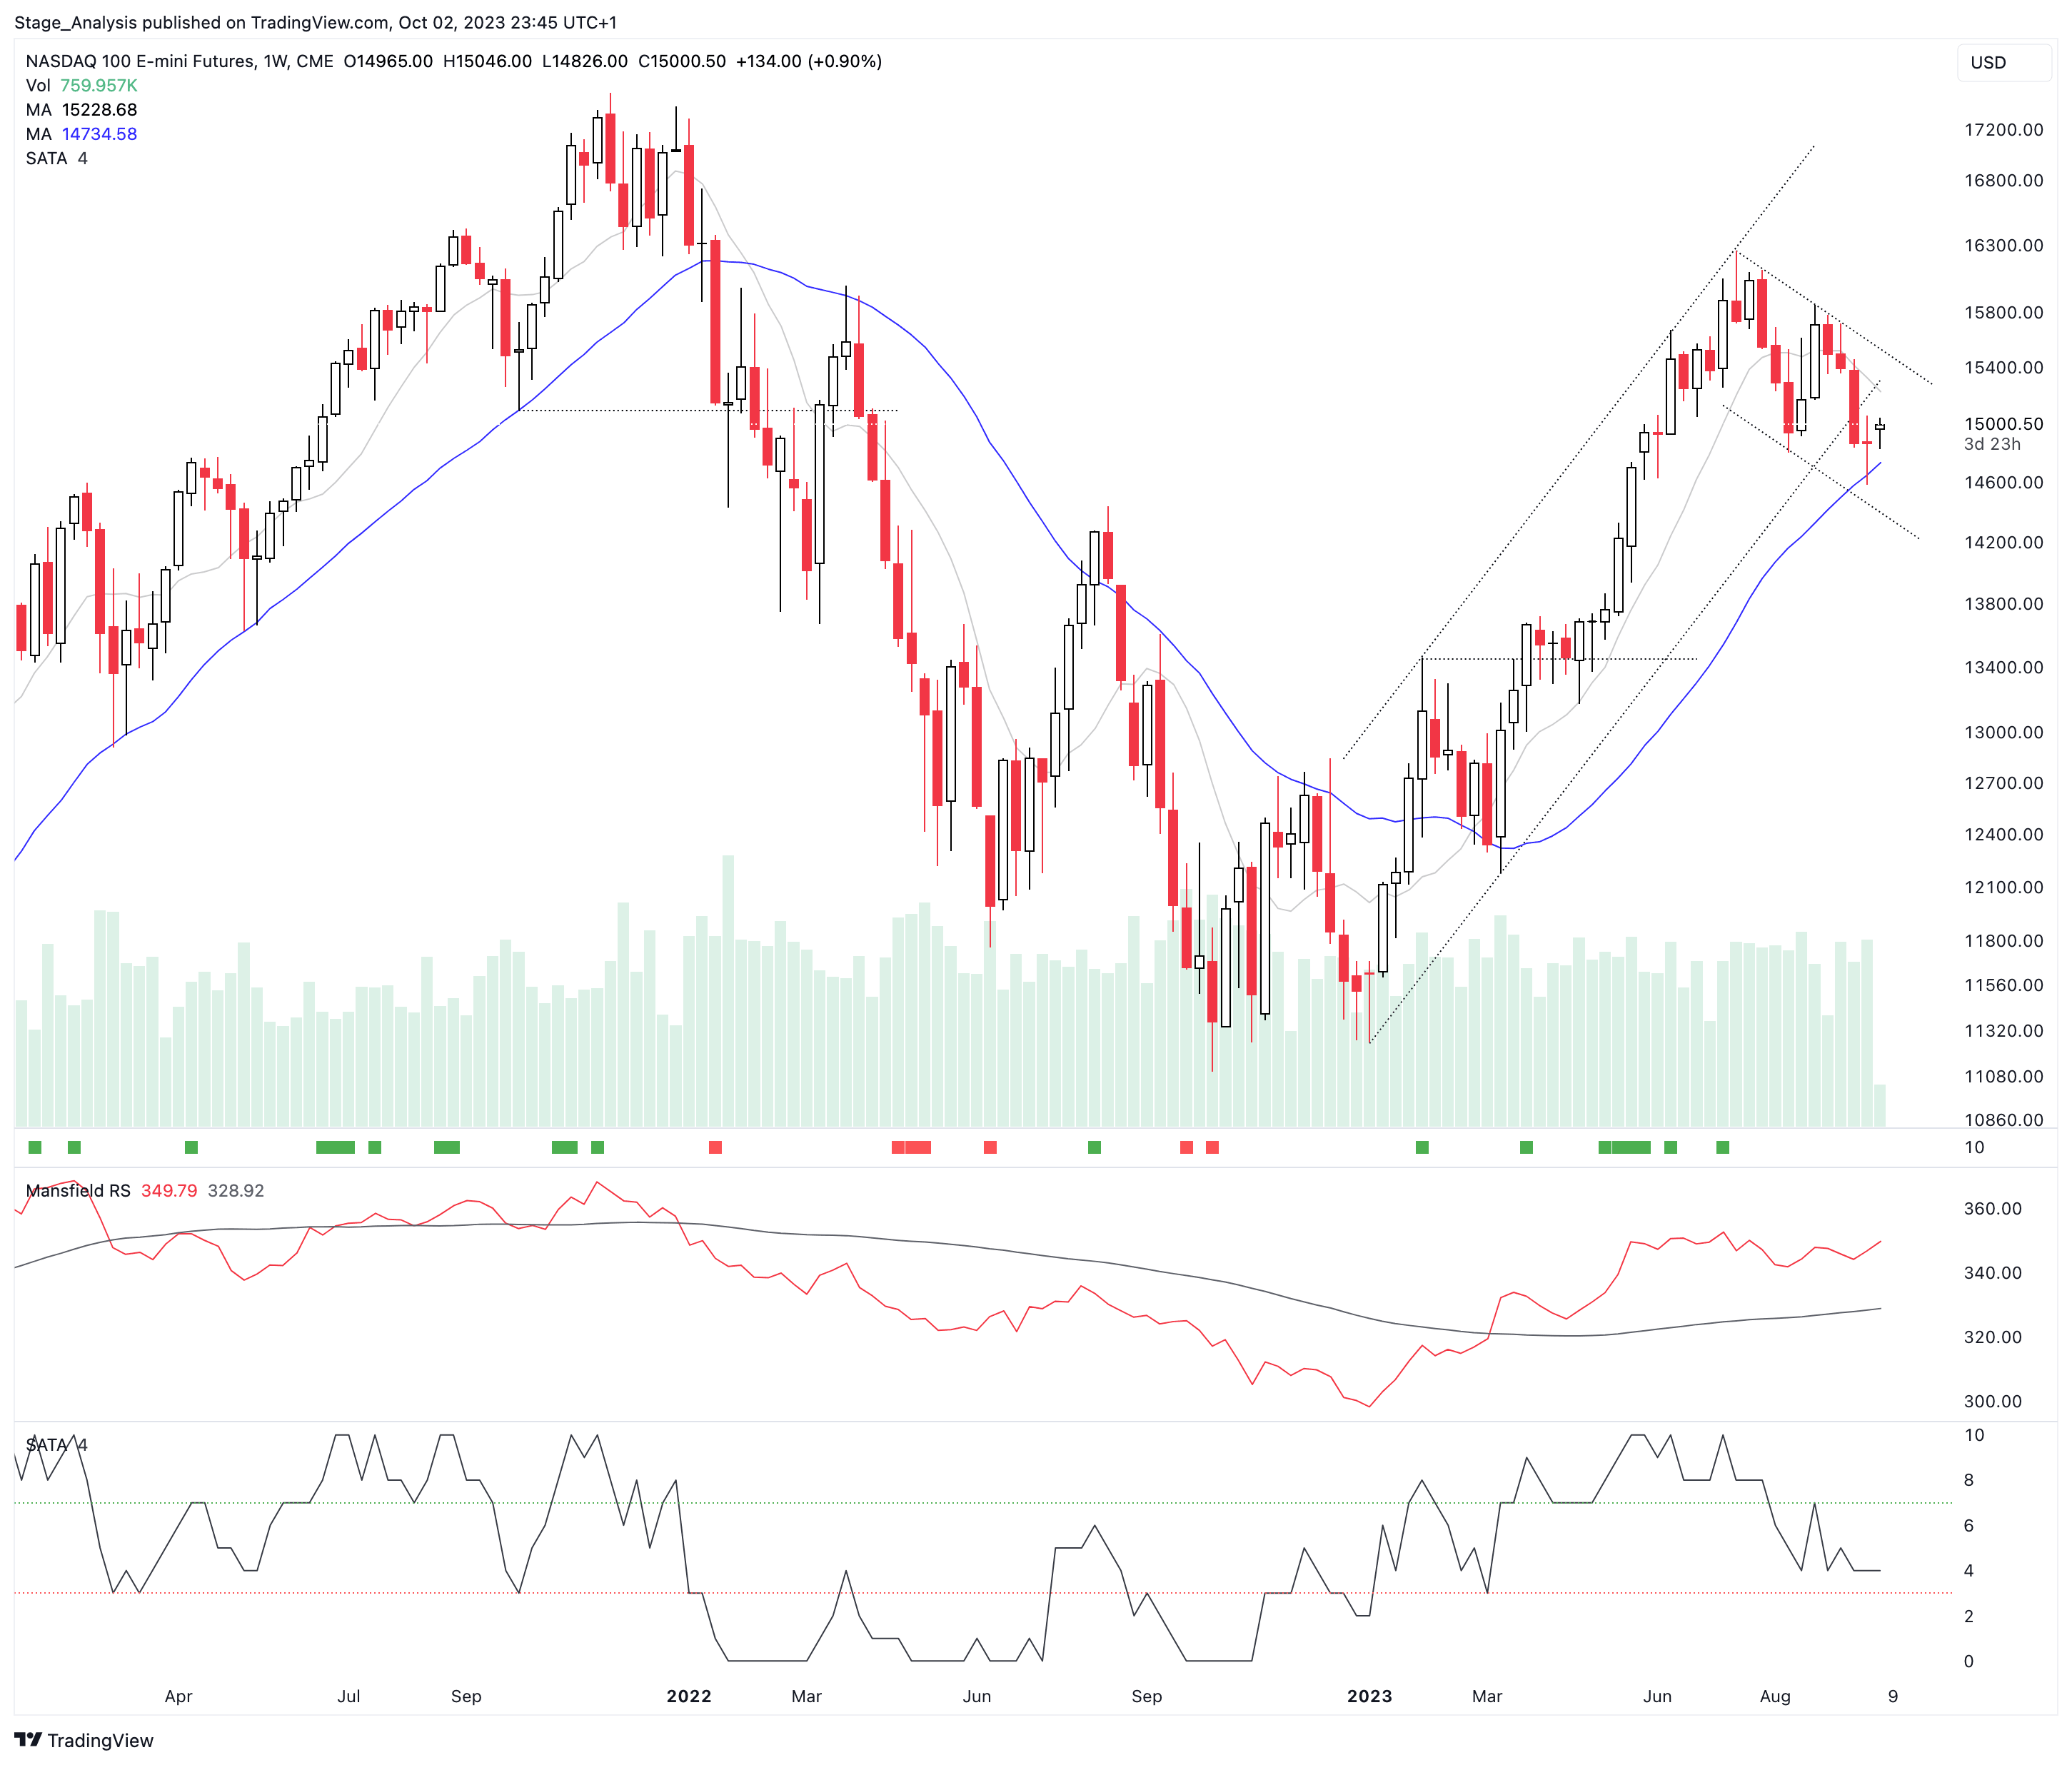
Nasdaq 100 E-mini Futures (NQ):
Weekly SATA Score: 4 (Neutral-)
Daily SATA Score: 2 (Weak)
Combined Score: 30% (Weak)
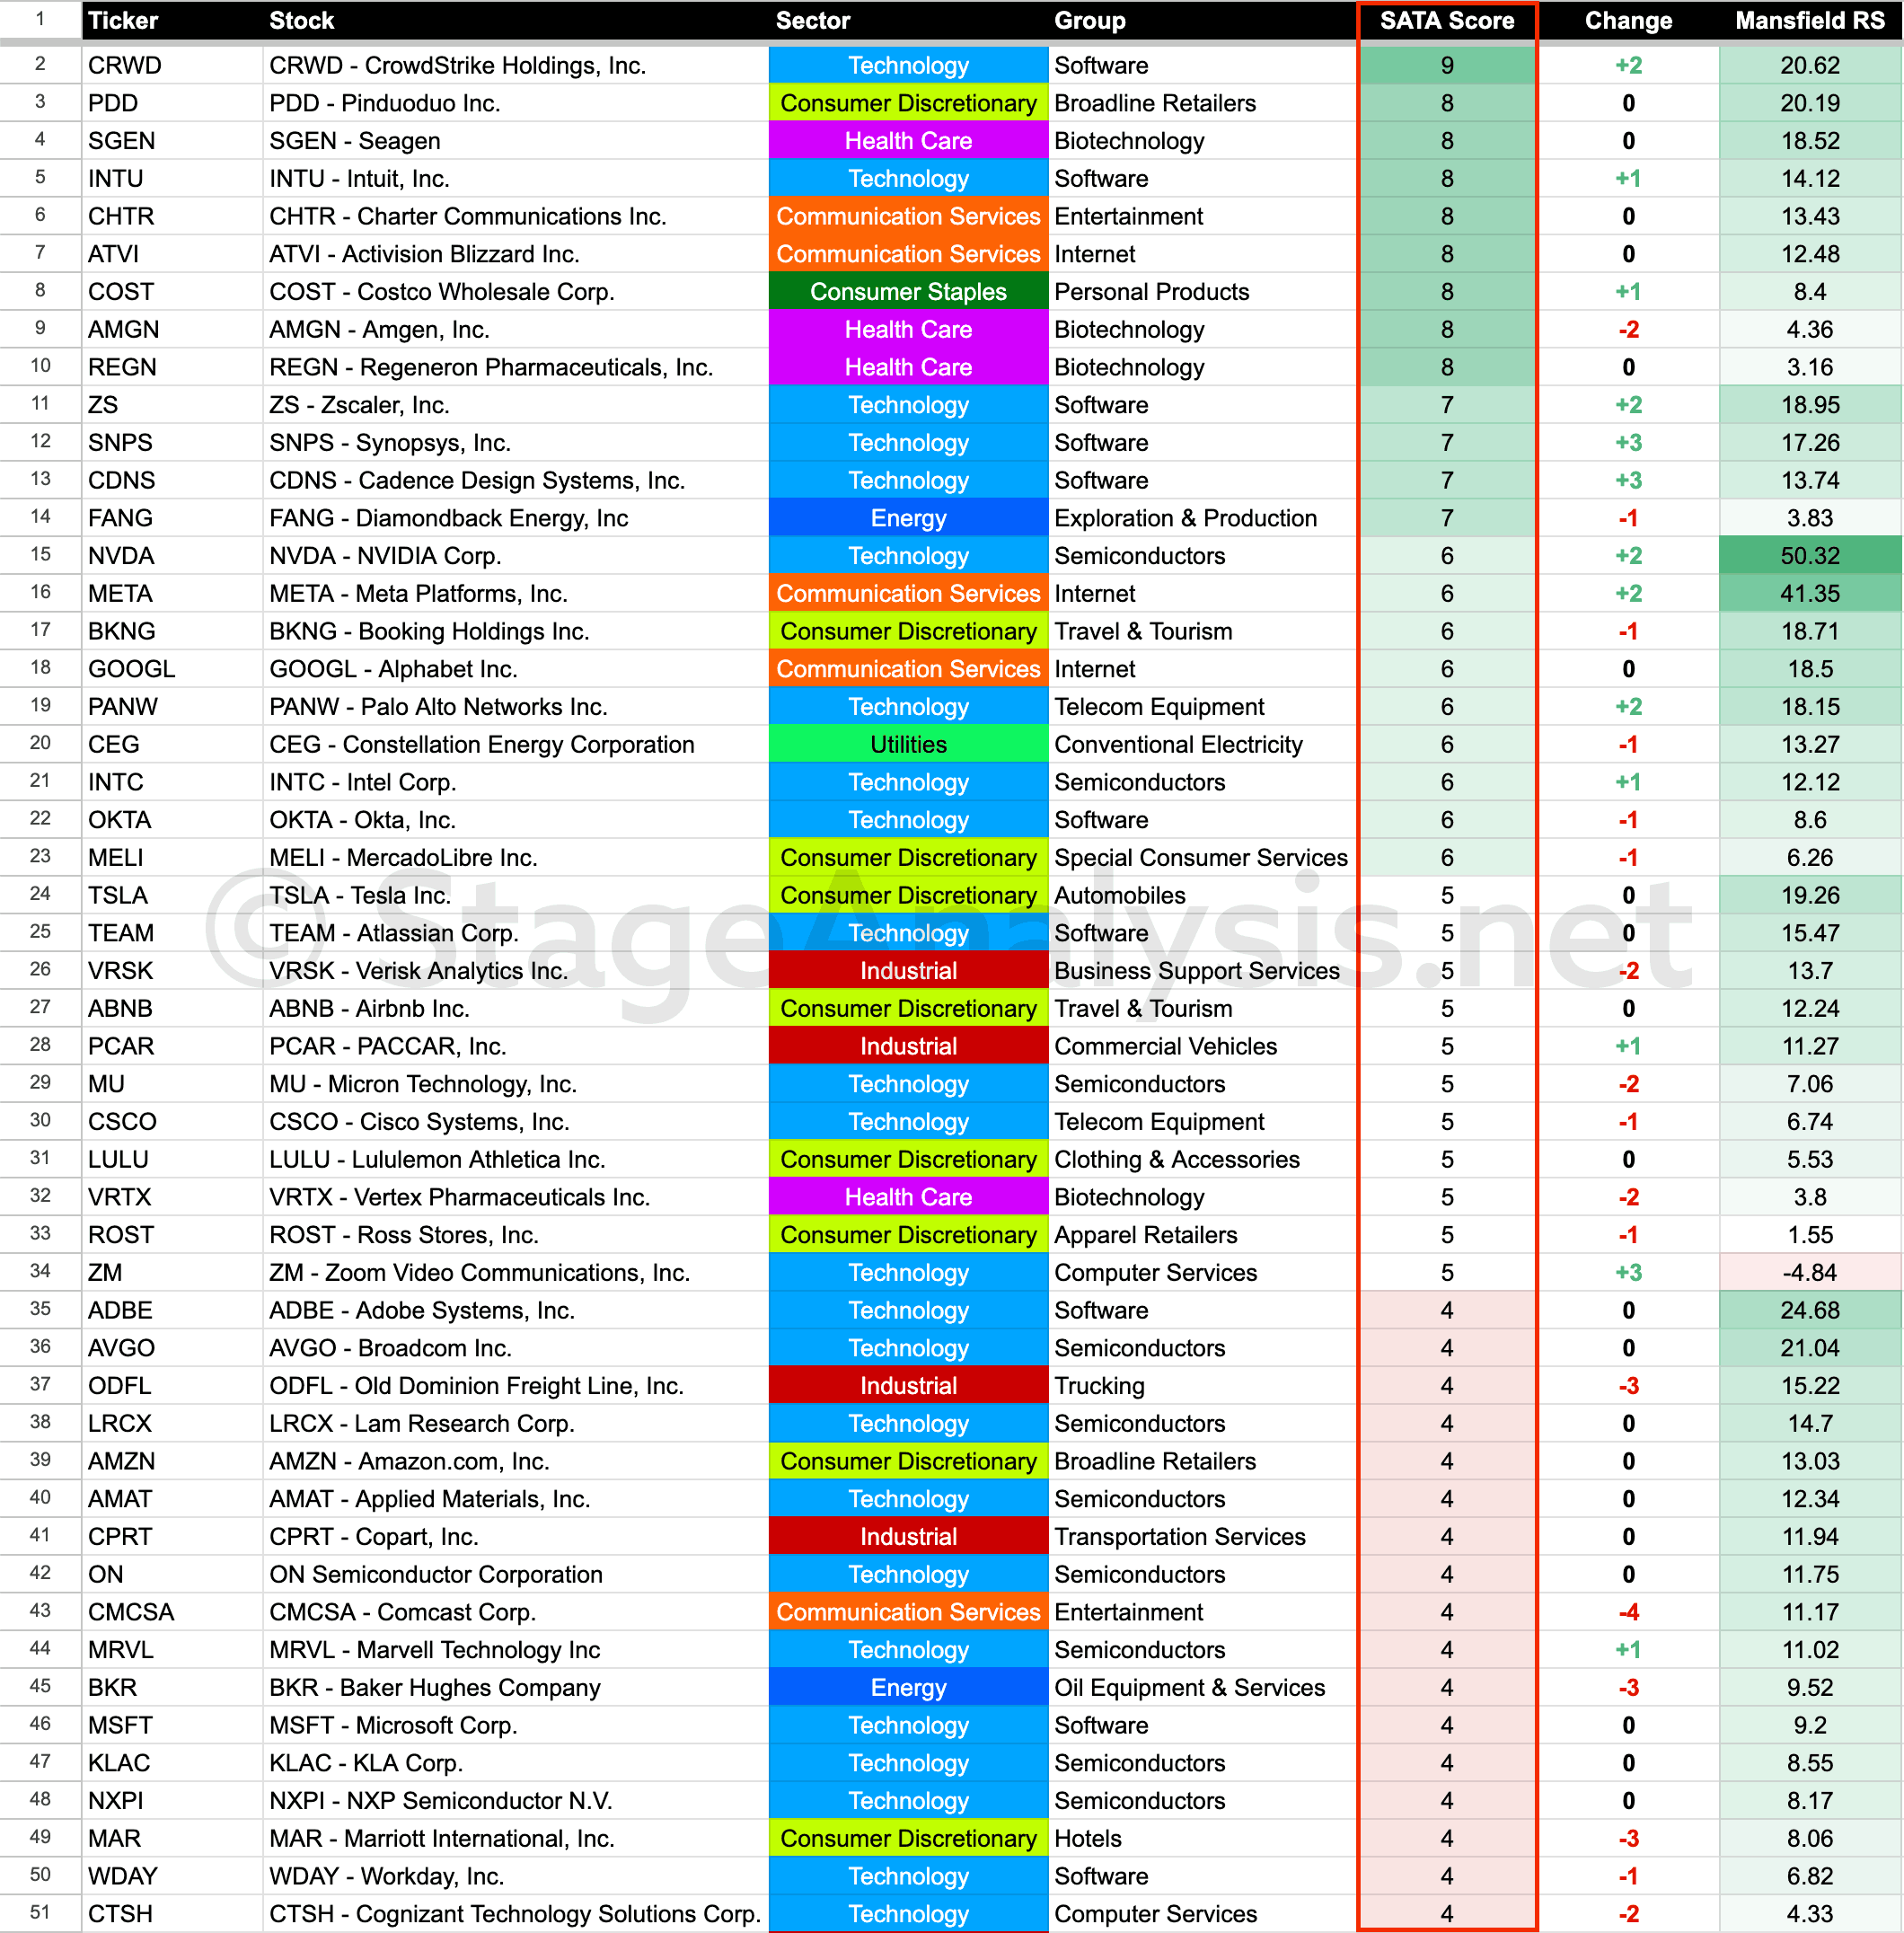
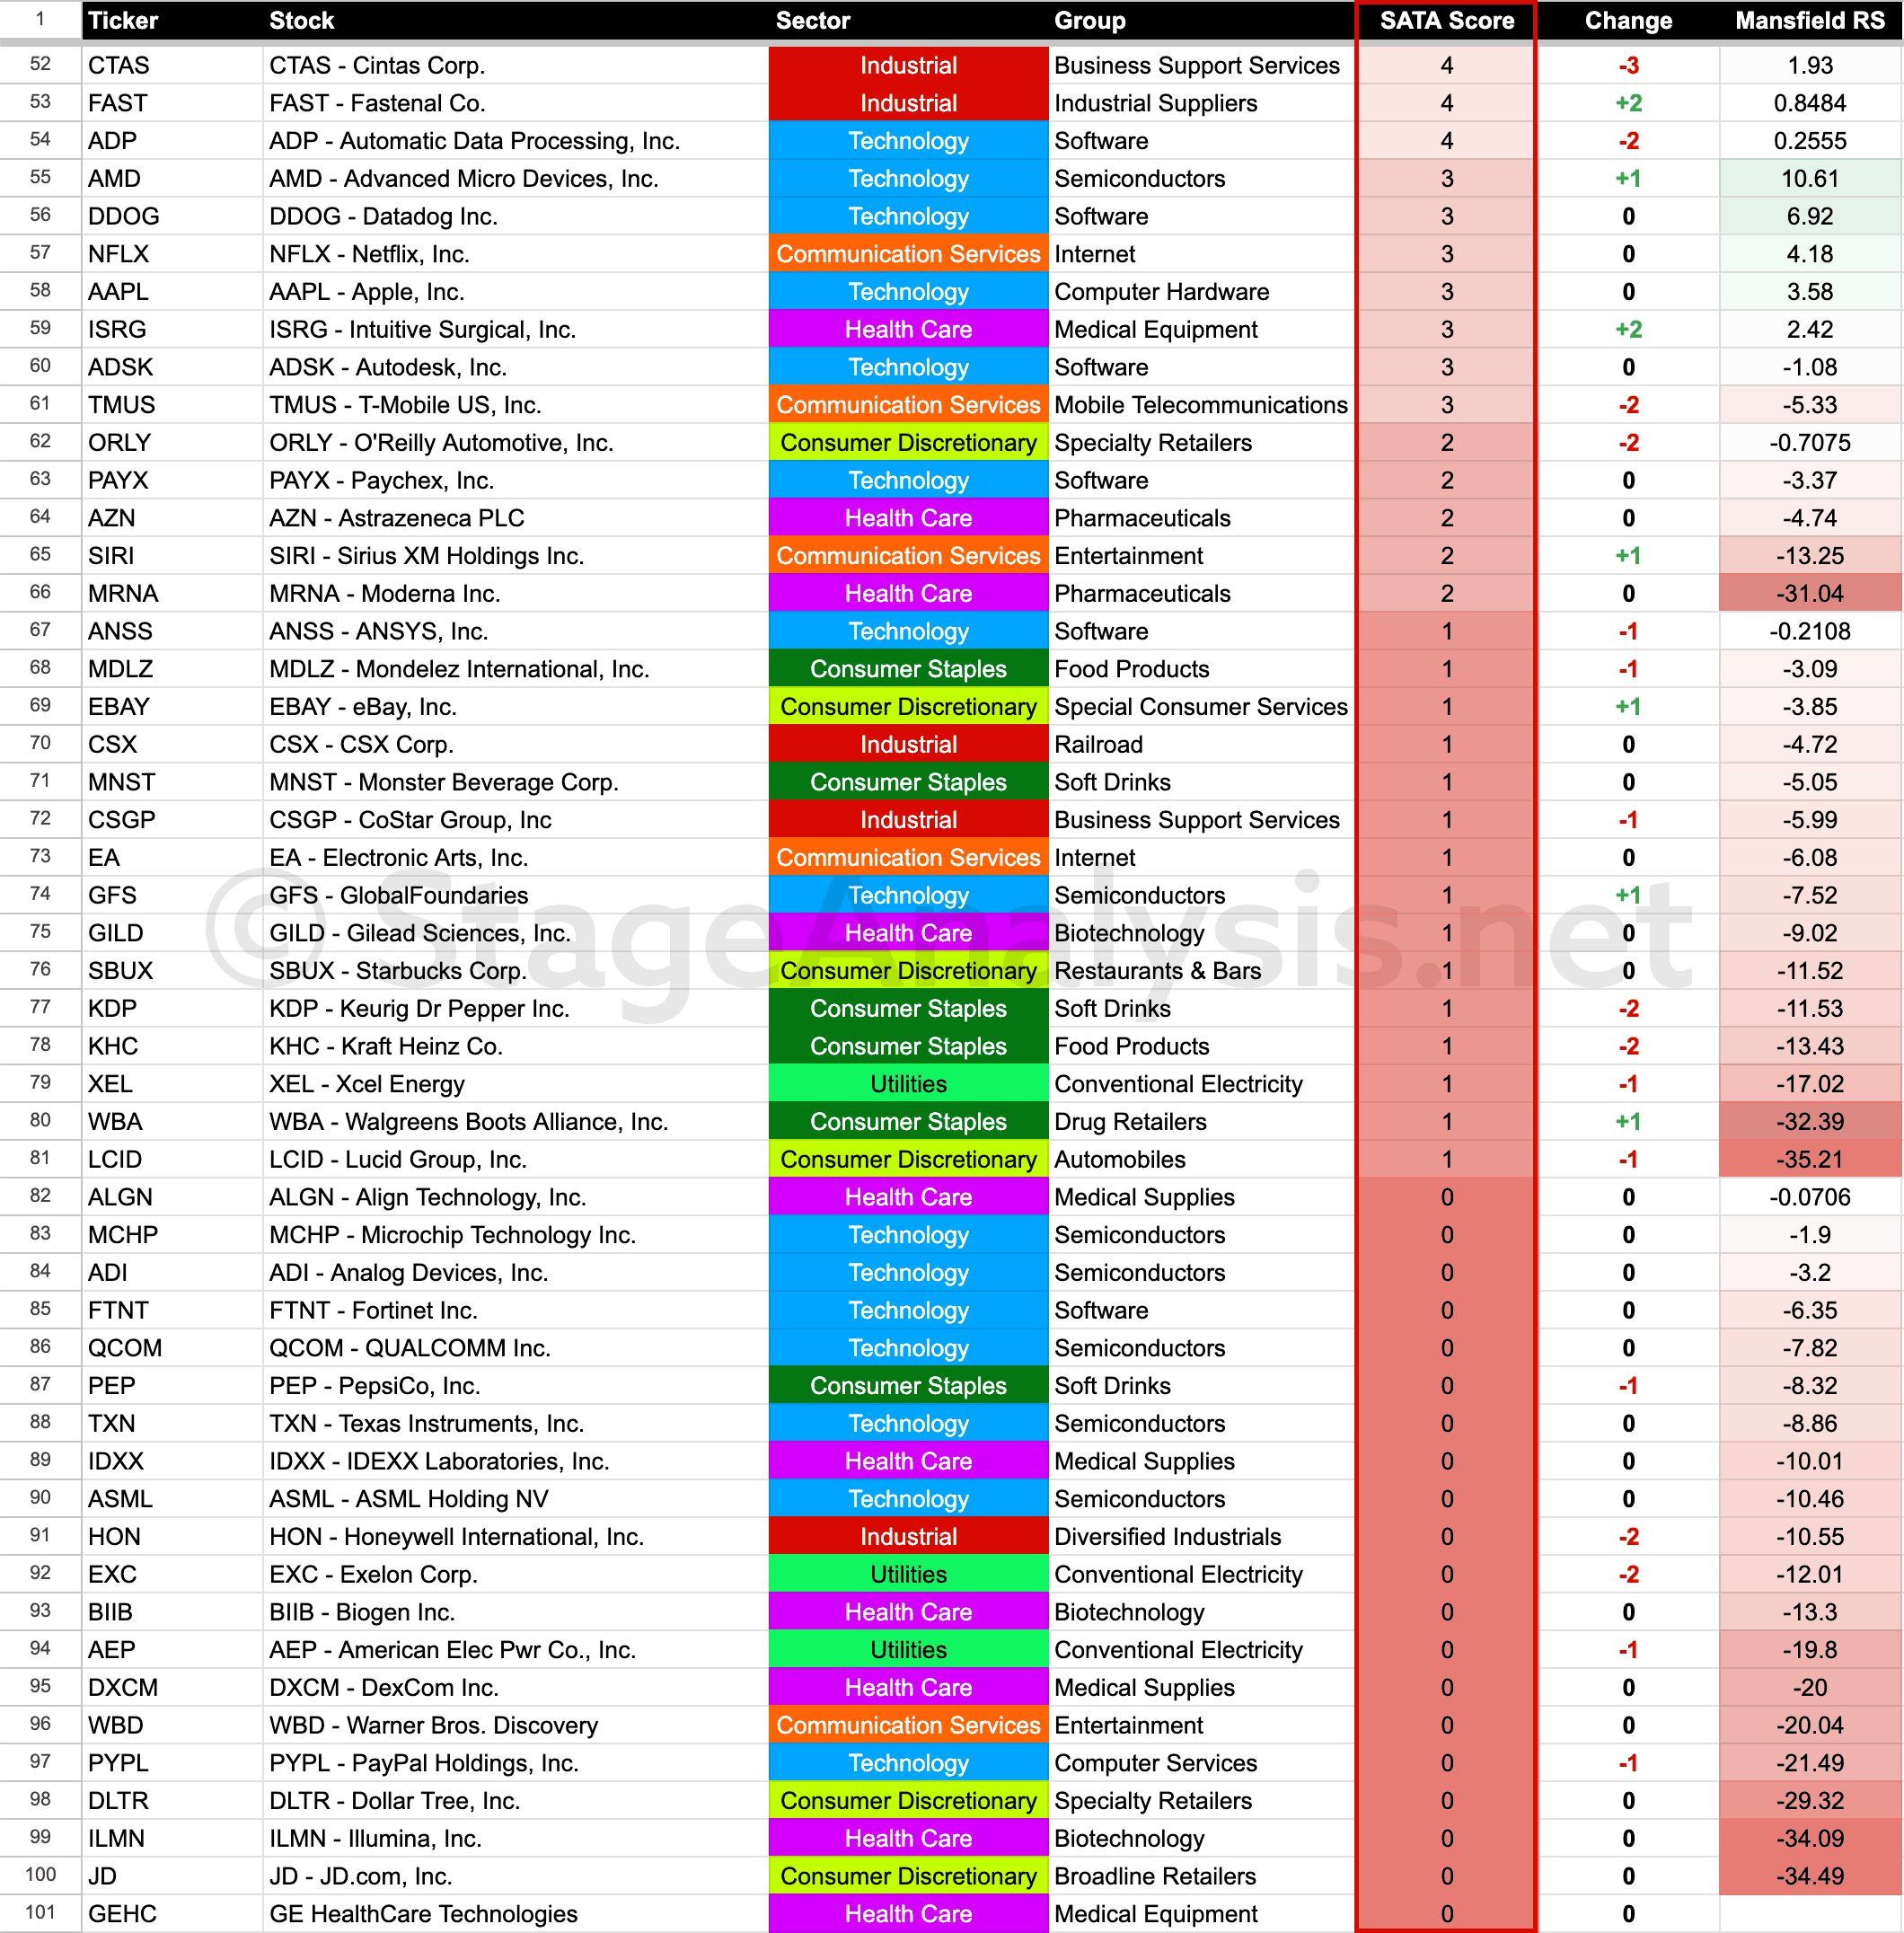
Below are the updated SATA data tables for the Nasdaq 100, sorted in three different ways to help you see the technical positions as well as relative strength and the SATA changes. As each gives a different perspective.
Nasdaq 100 Stocks – Ordered by Highest SATA Score + Mansfield Relative Strength
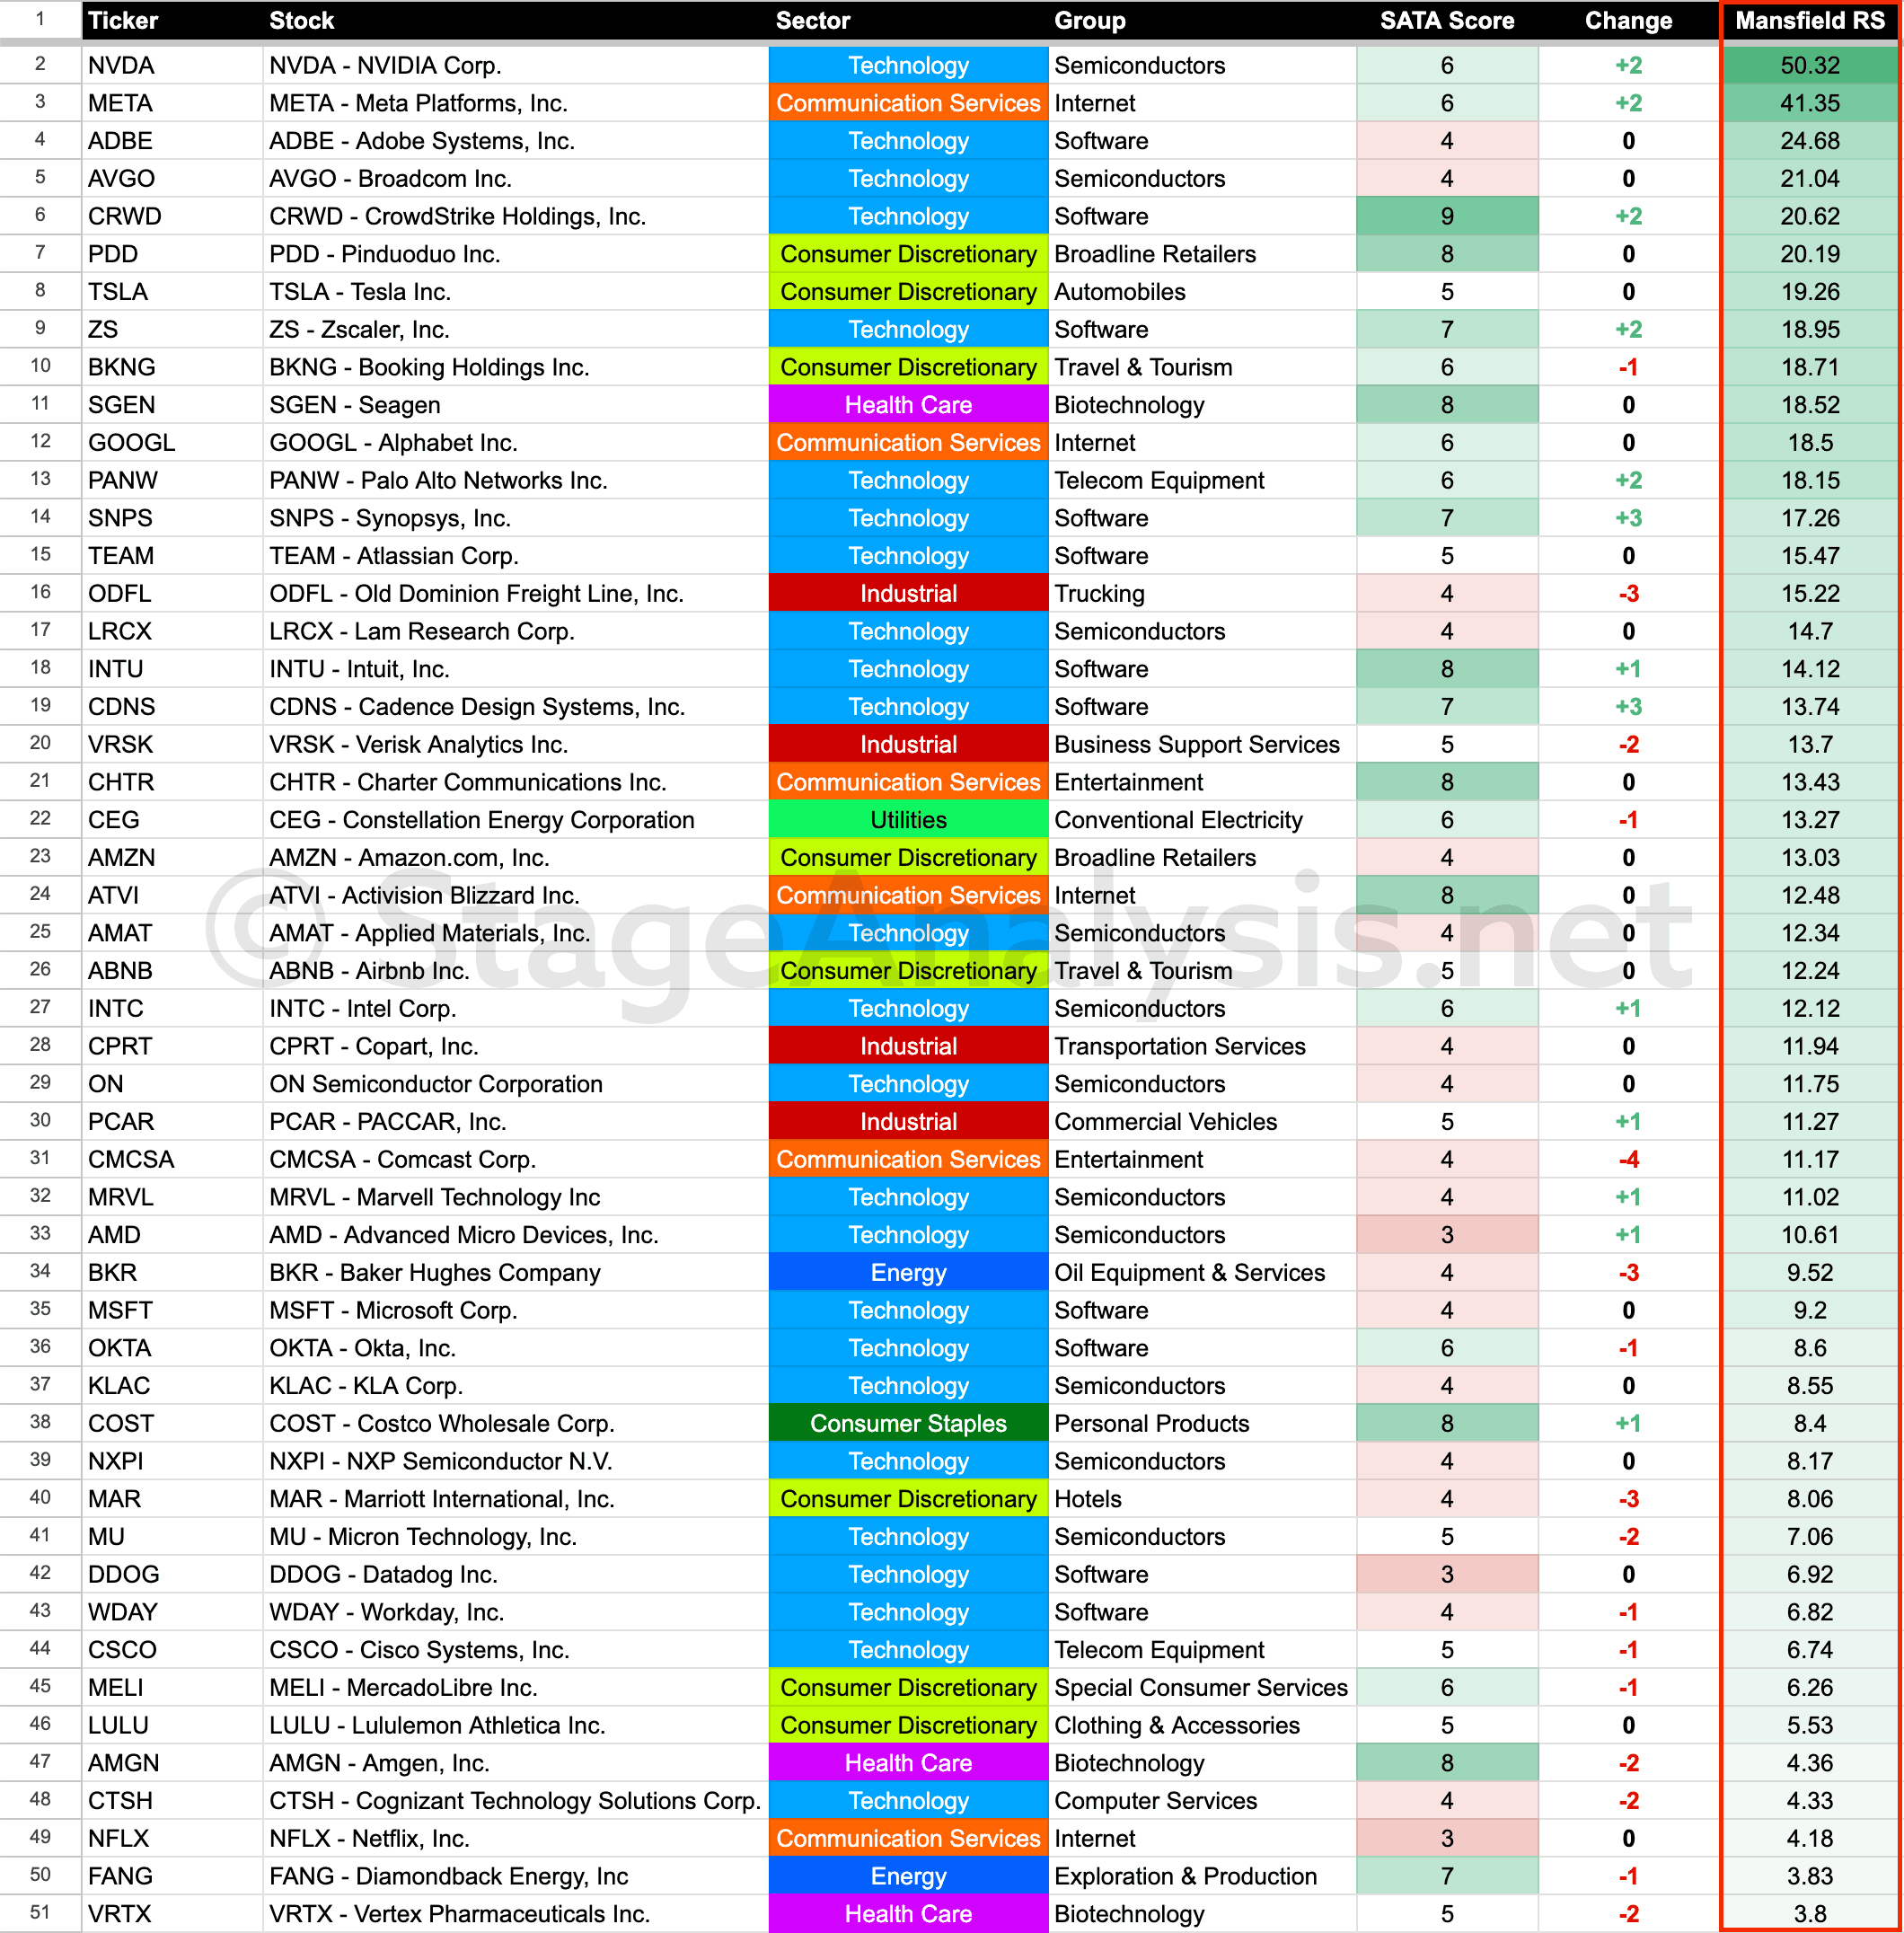
Ordered by Mansfield Relative Strength (RS) Score
The below table shows the Nasdaq 100 stocks ordered by relative strength using the Mansfield Relative Strength score.

Ordered by SATA Change
Become a Stage Analysis Member:
To see more like this – US Stocks watchlist posts, detailed videos each weekend, use our unique Stage Analysis tools, such as the US Stocks & ETFs Screener, Charts, Market Breadth, Group Relative Strength and more...
Join Today
Disclaimer: For educational purpose only. Not investment advice. Seek professional advice from a financial advisor before making any investing decisions.