
Market Breadth: Percentage of Stocks Above their 50 Day, 150 Day & 200 Day Moving Averages Combined
The full post is available to view by members only. For immediate access:
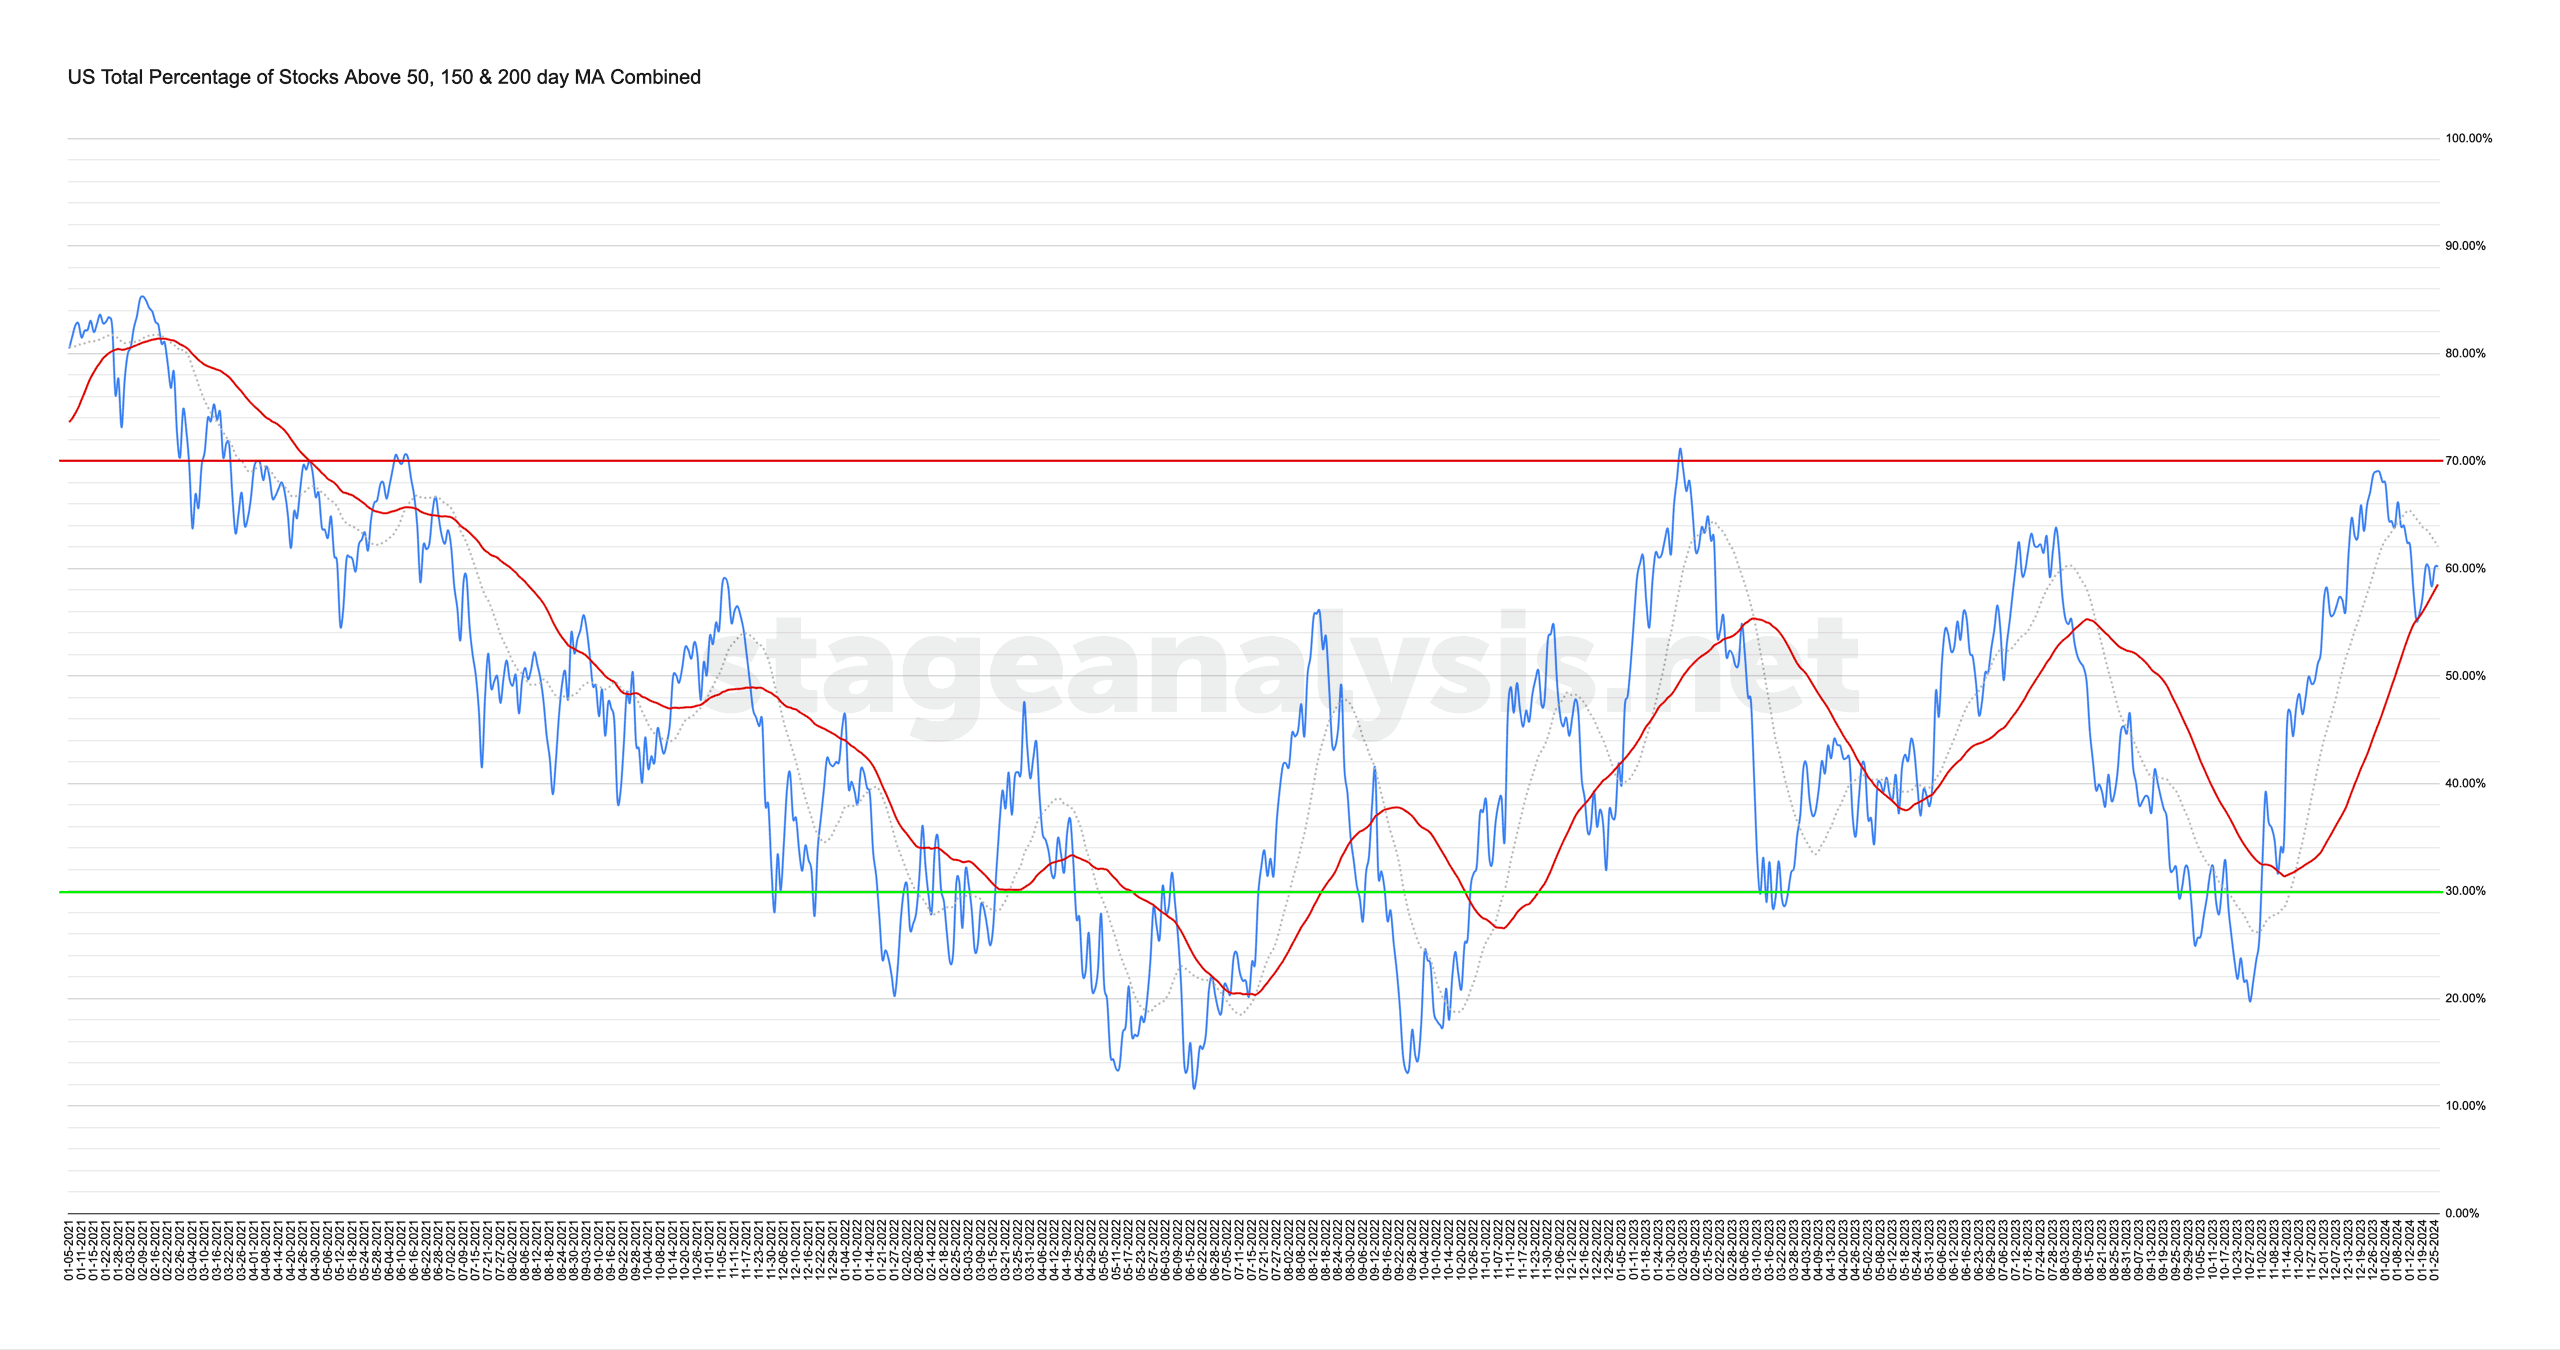
60.15% (+2.85% 1wk)
Status: Neutral Environment
The US Total Percentage of Stocks above their 50 Day, 150 Day & 200 Day Moving Averages (shown above) increased by +2.85% this week.
Therefore, the overall combined average is at 60.15% in the US market (NYSE and Nasdaq markets combined) above their short, medium and long term moving averages.
The moving average breadth improved slightly over the last week, holding above its 50 day MA by +1.64%, but still -1.92% below its short-term 20 day MA, and so it remains on a Neutral Environment status to start another week. But with the moving averages tightening up towards the combined line, and so a potential status change is a possibility in the coming week.
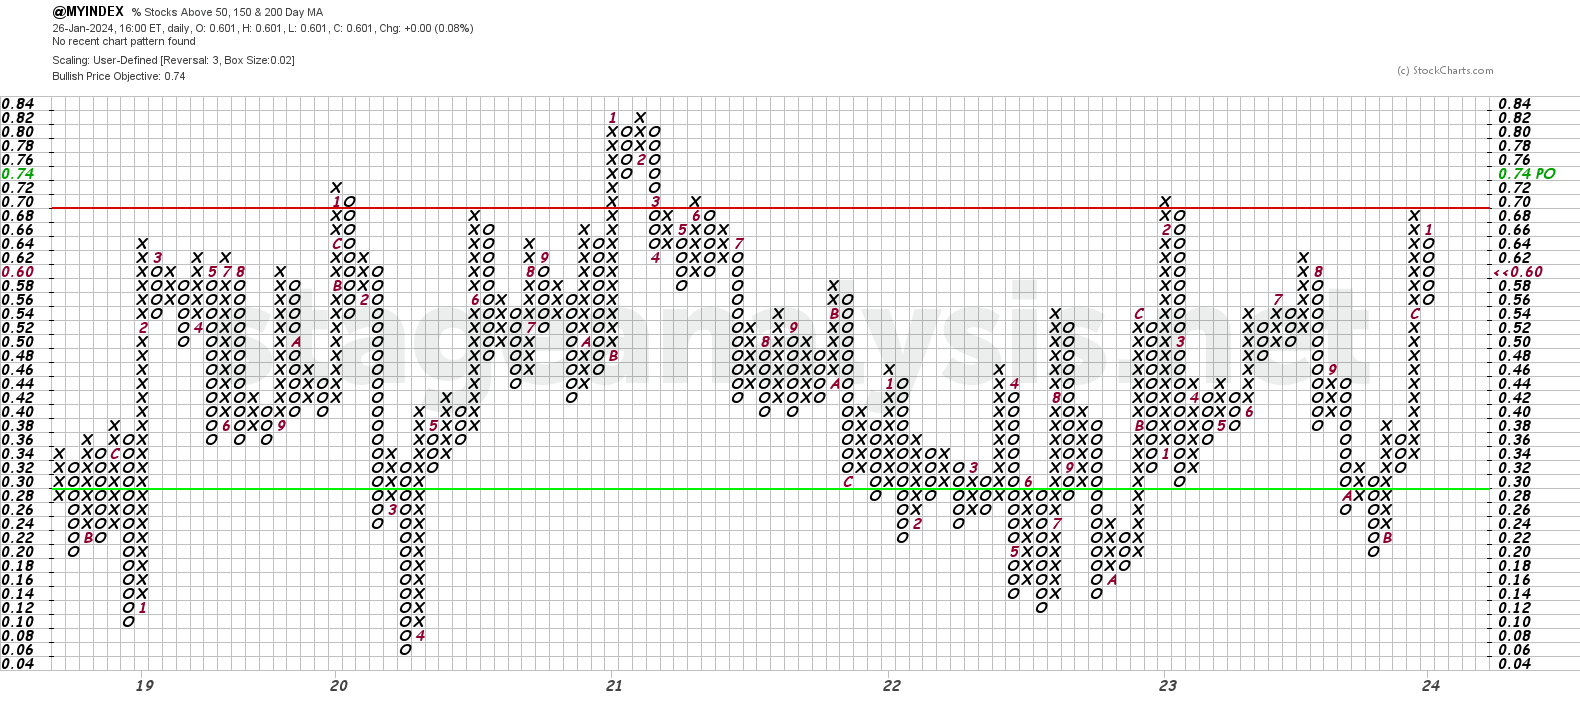
The Point and Figure (P&F) chart (shown above) was unchanged this week and remains in a column of Os, and so the P&F strategy remains on Defense (as it is in a column of Os), and the P&F status on Bull Correction status in the upper-middle range.
See the Bullish Percent article for more information on the P&F statuses.
Become a Stage Analysis Member:
To see more like this – US Stocks watchlist posts, detailed videos each weekend, use our unique Stage Analysis tools, such as the US Stocks & ETFs Screener, Charts, Market Breadth, Group Relative Strength and more...
Join Today
Disclaimer: For educational purpose only. Not investment advice. Seek professional advice from a financial advisor before making any investing decisions.