
Stage Analysis Technical Attributes Scores – Nasdaq 100
The full post is available to view by members only. For immediate access:
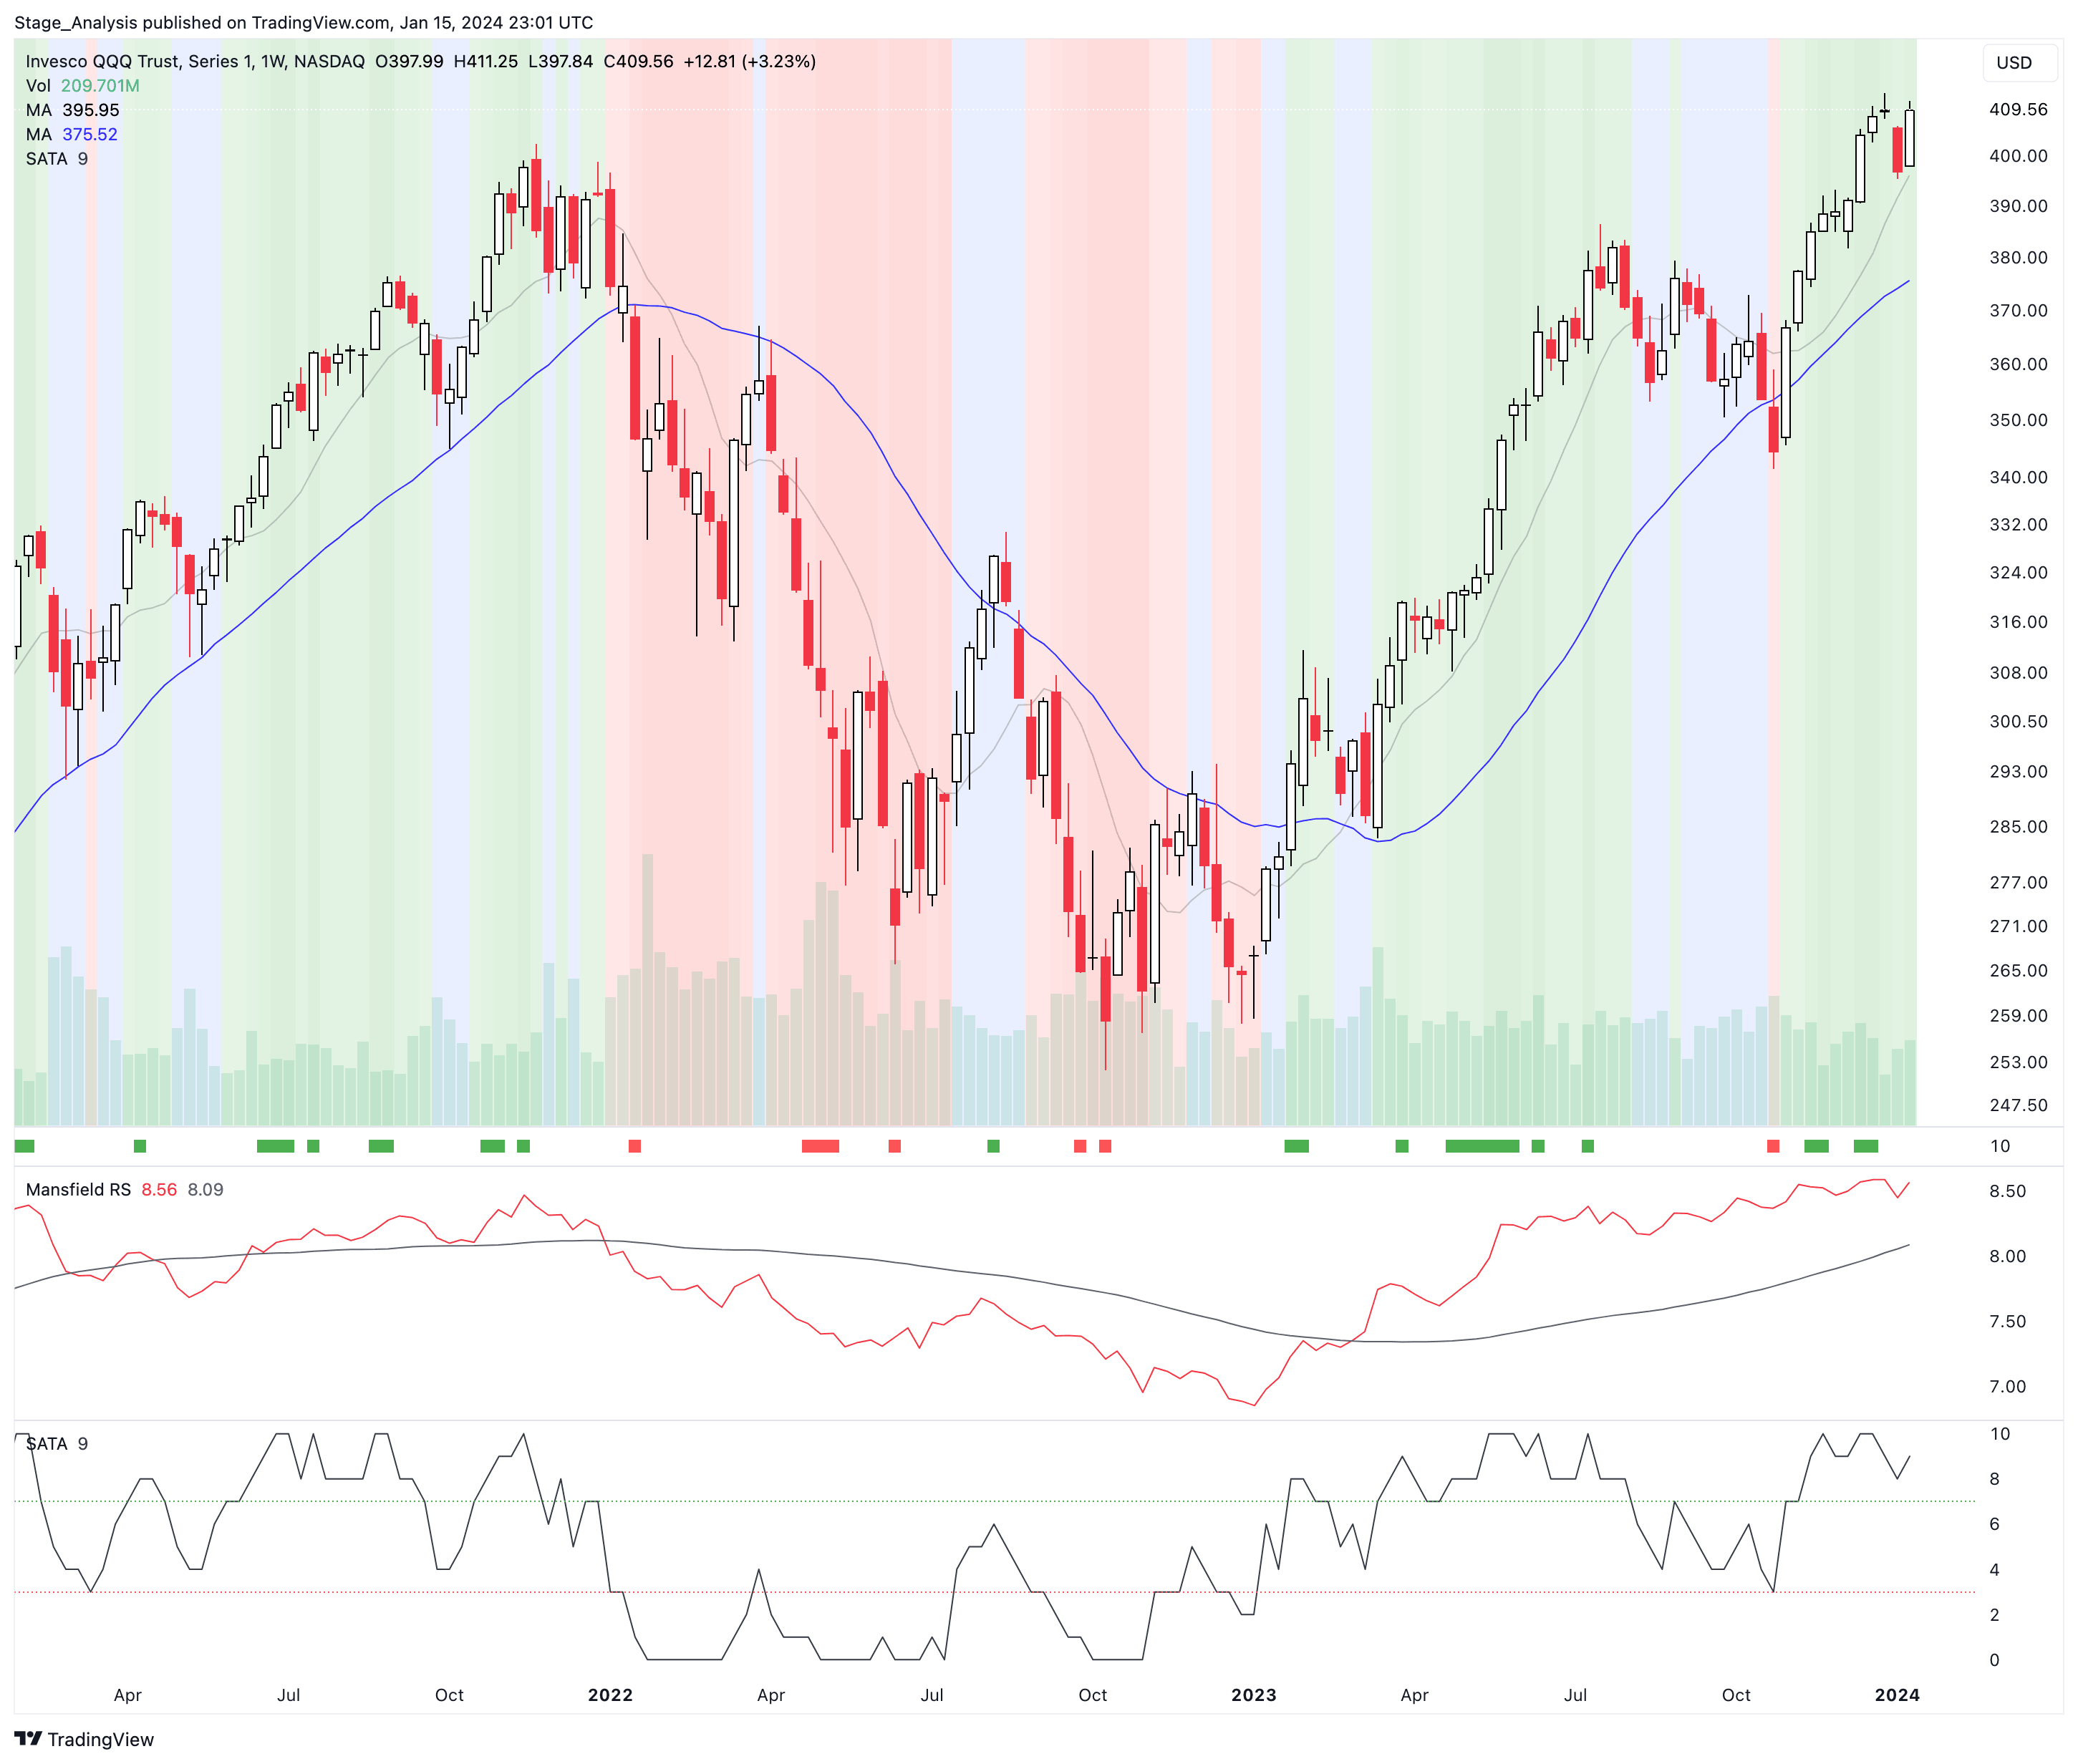
The Stage Analysis Technical Attributes (SATA) score is our proprietary indicator that helps to identify the four stages from Stan Weinstein's Stage Analysis method, using a scoring system from 0 to 10 that rates ten of the key technical characteristics that we look for when analysing the weekly charts.
We last covered the weekly SATA scores for the Nasdaq 100 back on 3rd January, which gives a rough guide of the Stages of the individual stocks within the Nasdaq 100. i.e. everything above a 7 would be considered in the Stage 2 zone (Strong), 4-6 in the Stage 1 or Stage 3 zone (Neutral), and 3 or below is the Stage 4 zone (Weak).
Currently the Nasdaq 100 consists of:
- 57% Stage 2 zone (Strong)
- 29% Stage 1 or Stage 3 zone (Neutral)
- 14% Stage 4 zone (Weak)
Percentage of stocks with a technically healthy SATA Score (6+): 67%
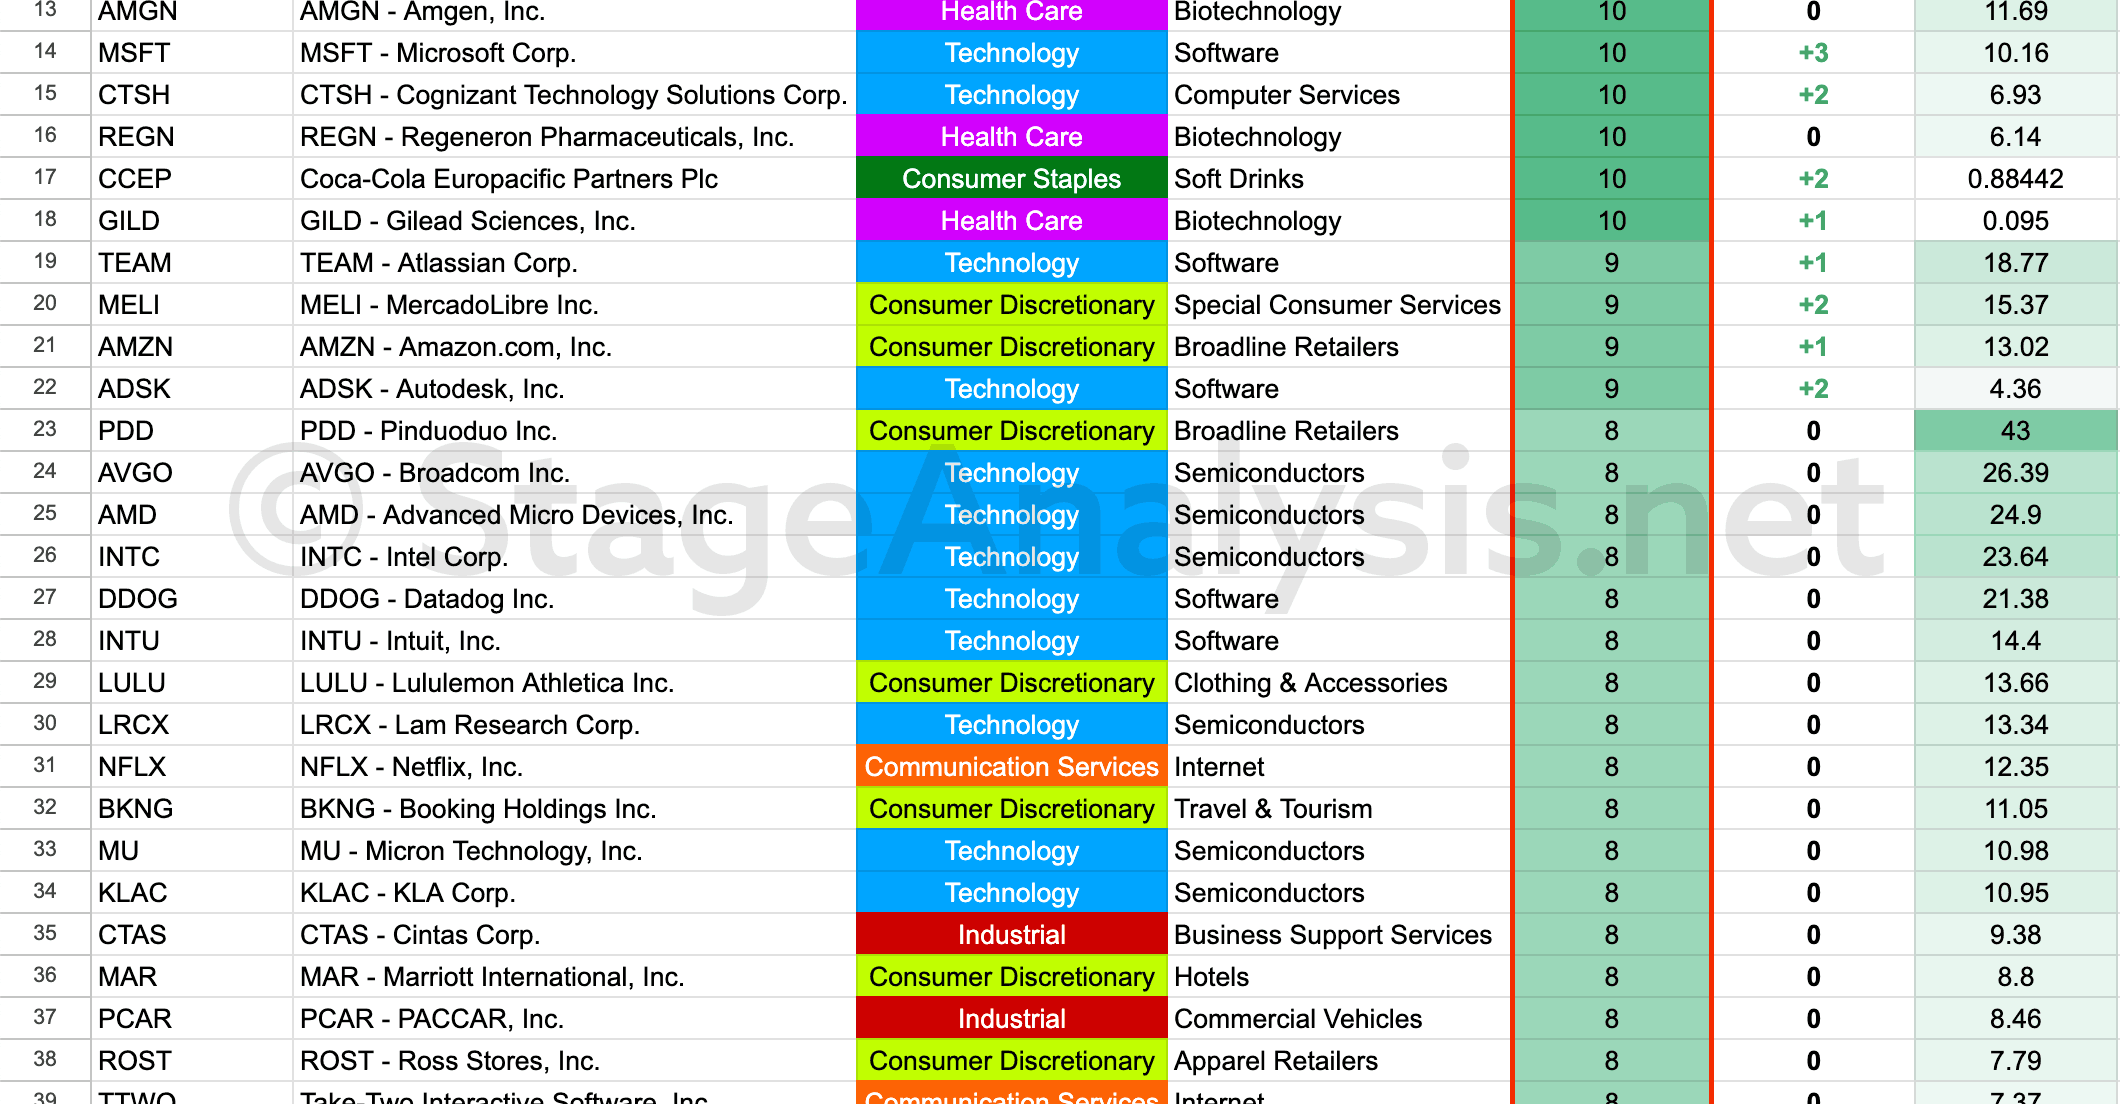
Sample of the SATA scores
This weeks full length post is for Stage Analysis Members only, but you can see a full, unlocked post from early October as an example if you are interested in seeing this very useful data regularly. Go to: Stage Analysis Technical Attributes Scores – Nasdaq 100 – 2nd October 2023
Become a Stage Analysis Member:
To see more like this – US Stocks watchlist posts, detailed videos each weekend, use our unique Stage Analysis tools, such as the US Stocks & ETFs Screener, Charts, Market Breadth, Group Relative Strength and more...
Join Today
Disclaimer: For educational purpose only. Not investment advice. Seek professional advice from a financial advisor before making any investing decisions.