
Market Breadth: Percentage of Stocks Above their 50 Day, 150 Day & 200 Day Moving Averages Combined
The full post is available to view by members only. For immediate access:
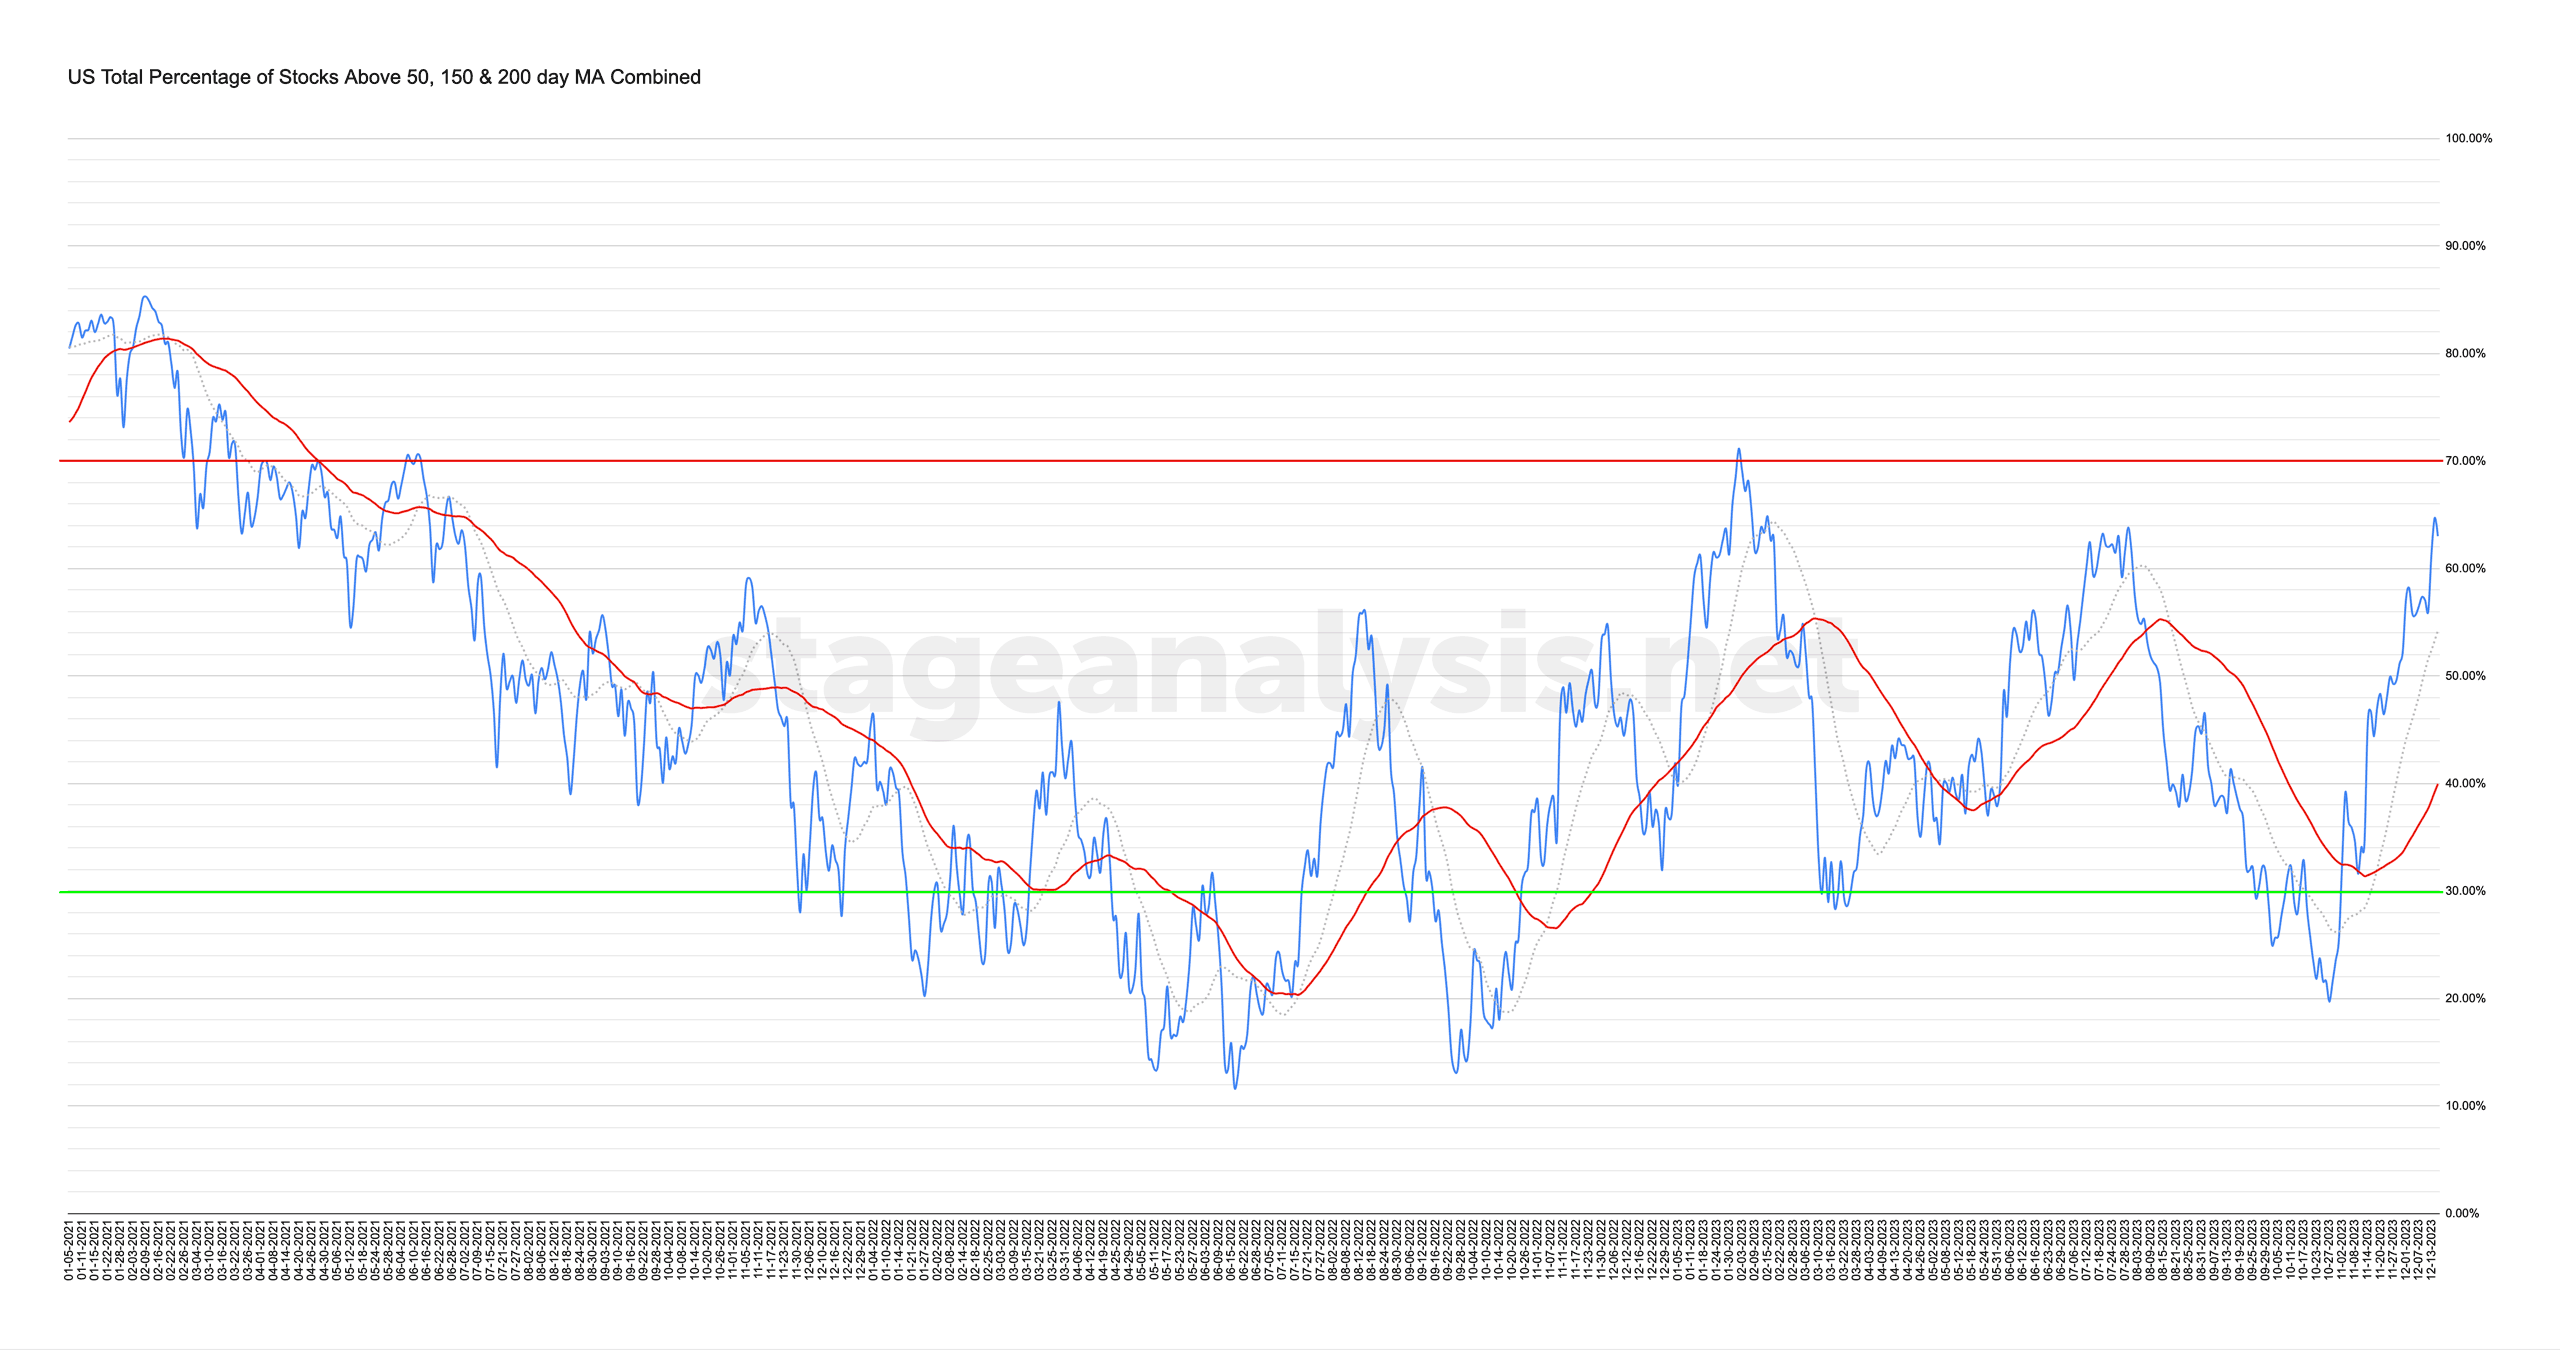
63.01% (+5.67% 1wk)
Status: Positive Environment
The US Total Percentage of Stocks above their 50 Day, 150 Day & 200 Day Moving Averages (shown above) increased by +5.67% this week.
Therefore, the overall combined average is at 63.01% in the US market (NYSE and Nasdaq markets combined) above their short, medium and long term moving averages.
The combined average surged higher this week, moving above the key 60% level on Wednesday, which we consider the "Stage 2 zone" for the broad market. But it has reached this level twice before this year, for brief periods, but it wasn't able to hold it and push on into a sustained Stage 2 for the broad market, and instead we saw only the large cap indexes able to. So the question is will this time be different? Will there be sustained broader participation from all areas of the market or not.
It's now entering the seventh week of being on a Positive Environment status and currently is +8.78% above its 20 day MA, and +23.06% above its 50 day MA (signal line).
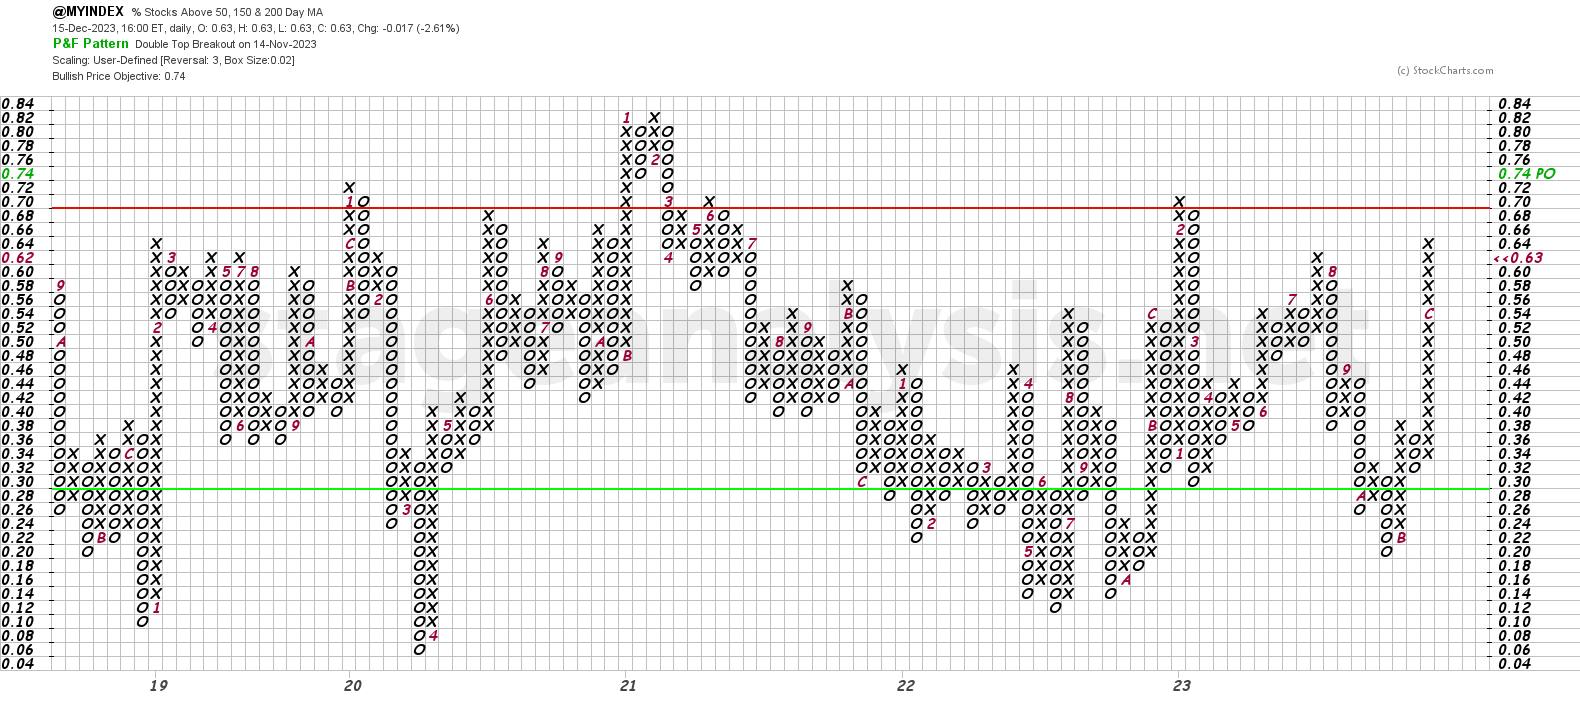
The Point and Figure (P&F) chart (shown above) added a further 3 Xs to its column of Xs this week, and so the P&F strategy remains on Offense (as it is in a column of Xs), and the P&F status continues on Bull Confirmed status in a Strong field position in the upper-middle range.
See the Bullish Percent article for more information on the P&F statuses.
Become a Stage Analysis Member:
To see more like this – US Stocks watchlist posts, detailed videos each weekend, use our unique Stage Analysis tools, such as the US Stocks & ETFs Screener, Charts, Market Breadth, Group Relative Strength and more...
Join Today
Disclaimer: For educational purpose only. Not investment advice. Seek professional advice from a financial advisor before making any investing decisions.