
Market Breadth: Percentage of Stocks Above their 50 Day, 150 Day & 200 Day Moving Averages Combined
The full post is available to view by members only. For immediate access:
49.92% (+2.81% 1wk)
Status: Positive Environment
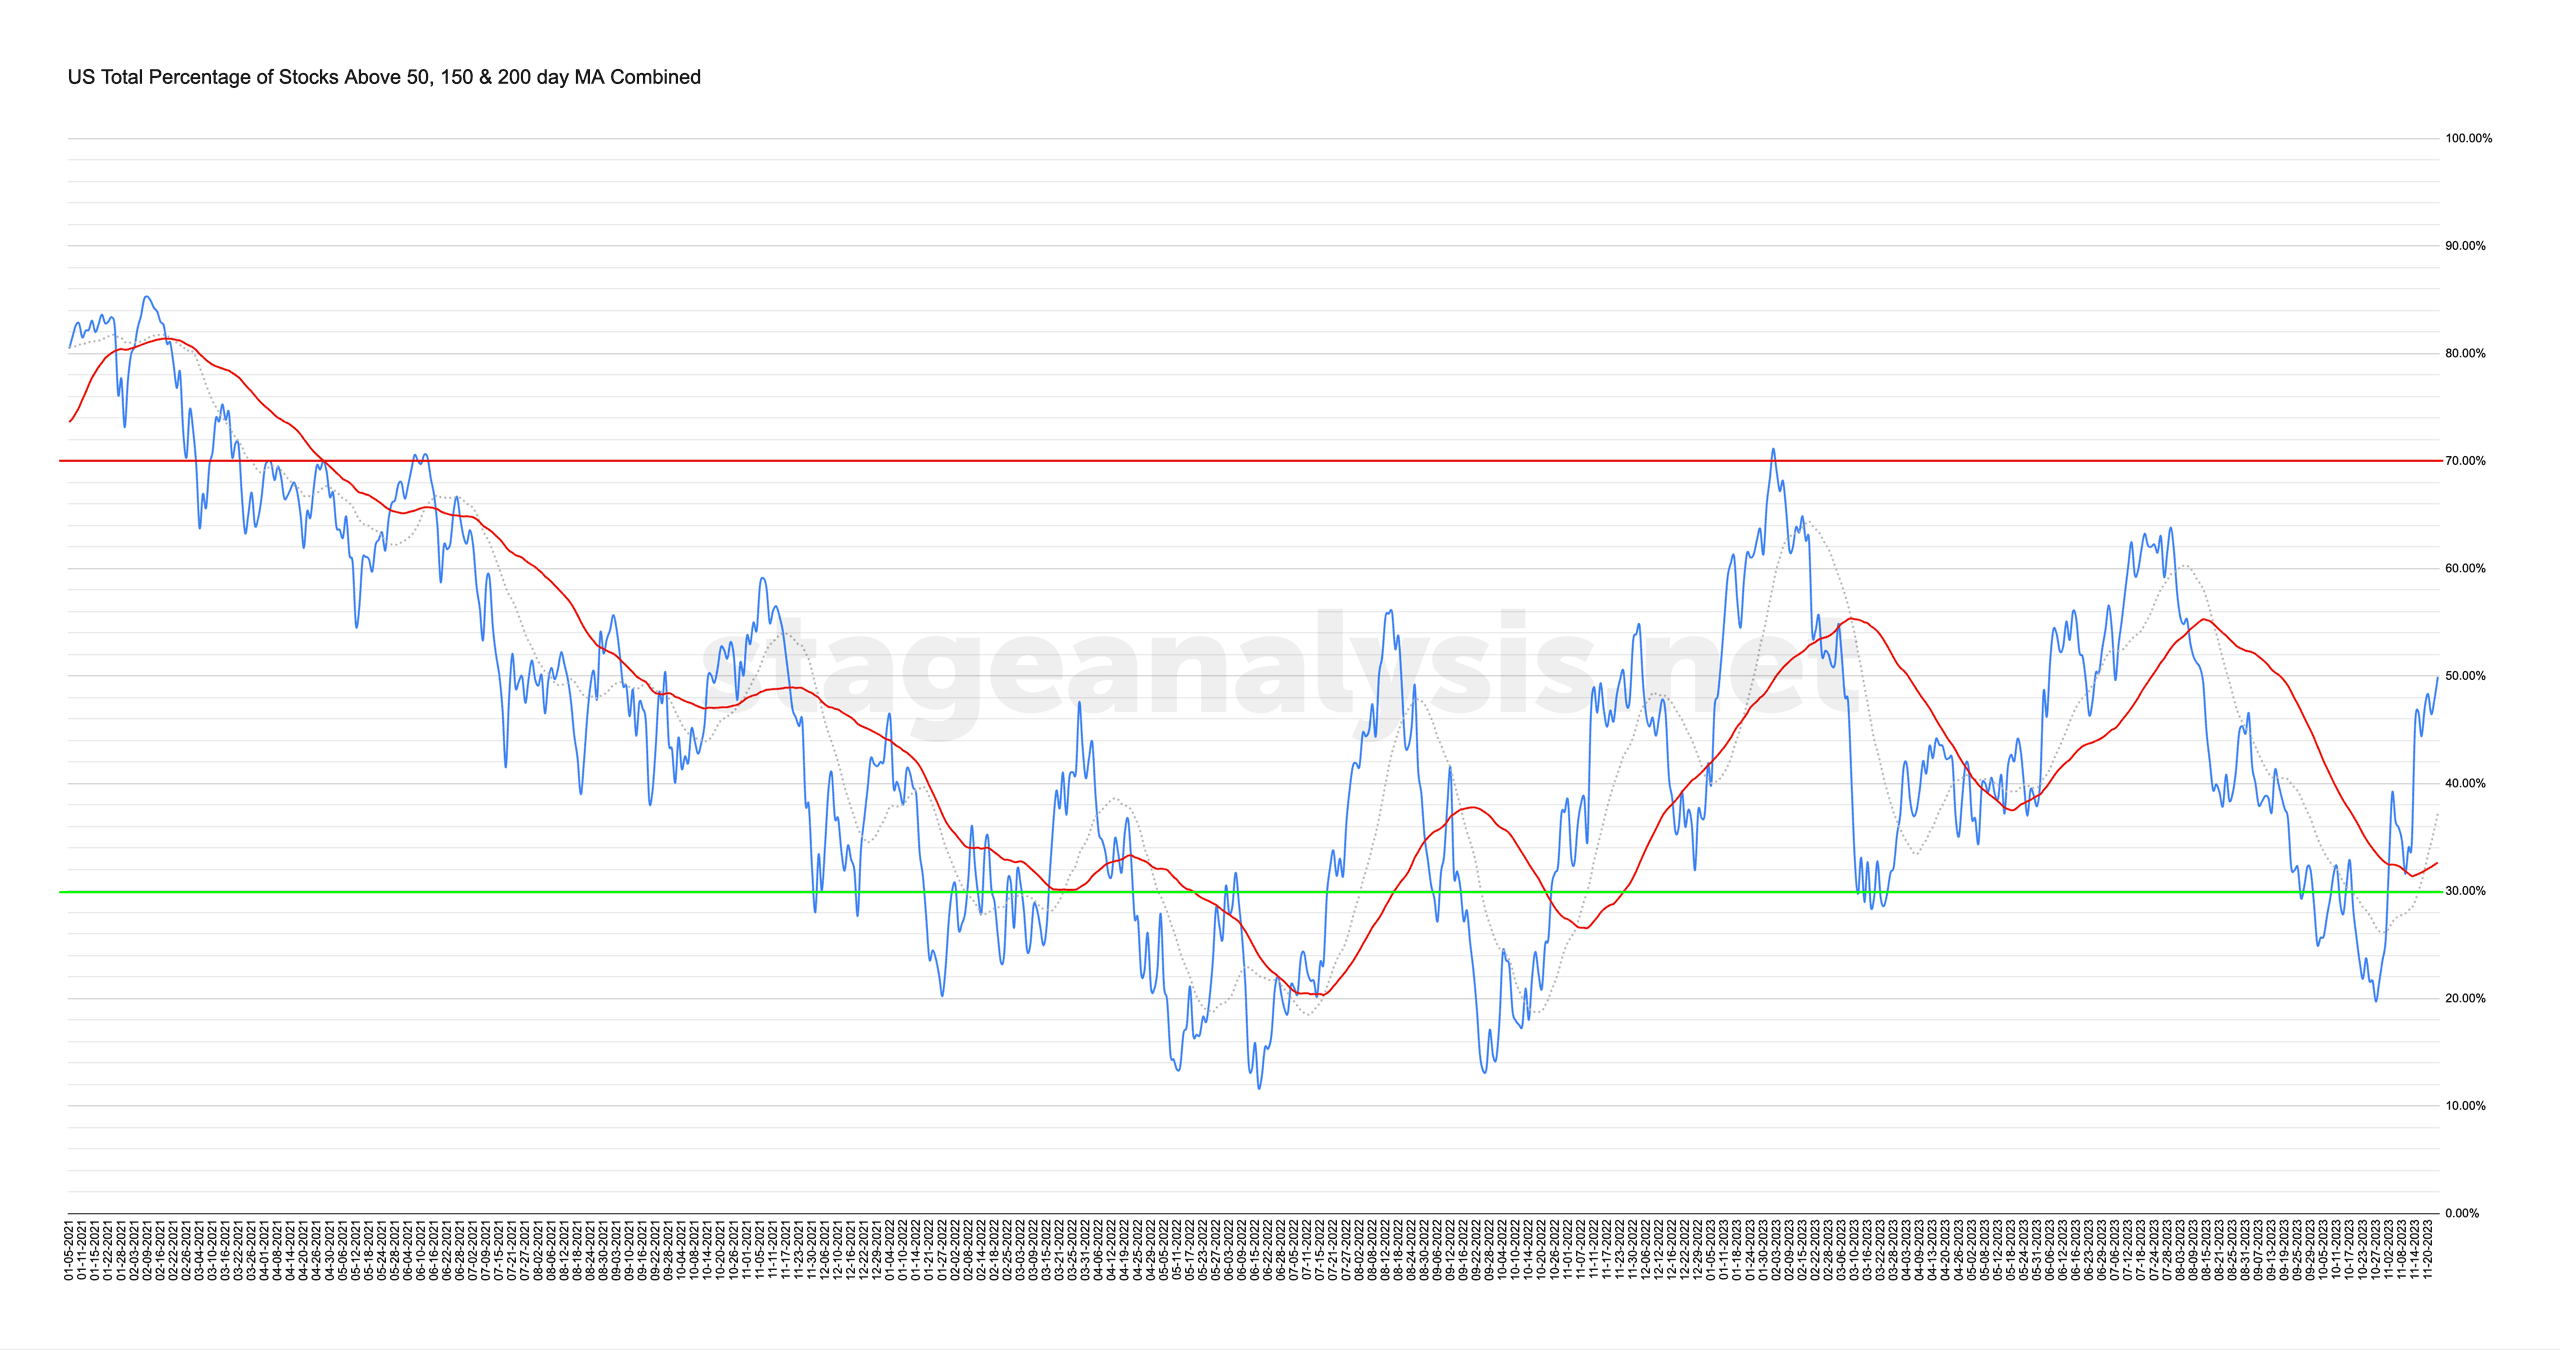
The US Total Percentage of Stocks above their 50 Day, 150 Day & 200 Day Moving Averages (shown above) increased by +2.81% this week.
Therefore, the overall combined average is at 49.92% in the US market (NYSE and Nasdaq markets combined) above their short, medium and long term moving averages.
The combined average continued slightly higher during the shortened holiday week, closing within 0.08% of the 50% midpoint, and so it has now recovered from the lower zone to a completely neutral position. But with a Positive Environment status currently, due to it being +12.67% above its 20 day MA, and 17.30% above its 50 day MA (signal line).
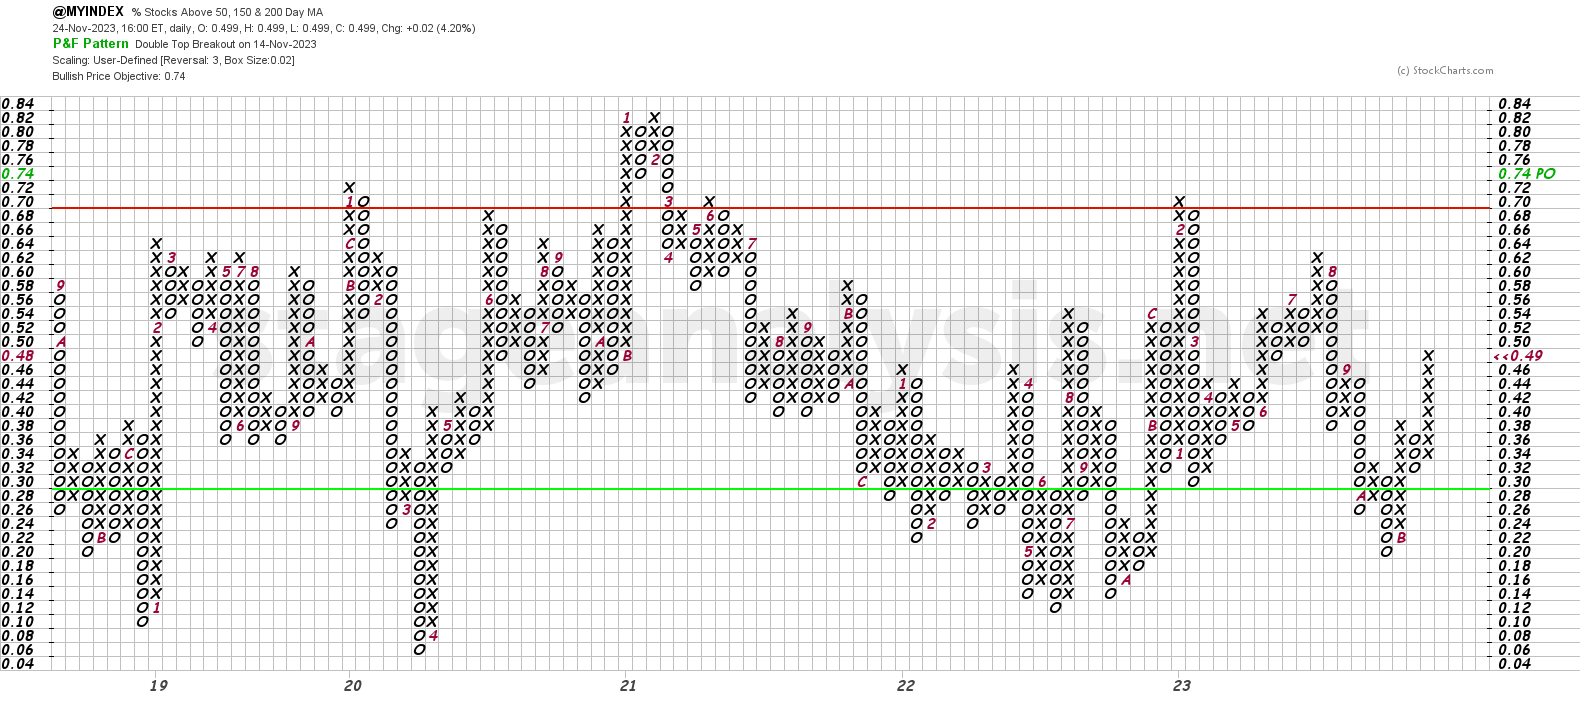
The Point and Figure (P&F) chart (shown above) added a further X to its column of Xs this week, and so the P&F strategy remains on Offense (as it is in a column of Xs), and the P&F status continues on Bull Confirmed status.
See the Bullish Percent article for more information on the P&F statuses.

Become a Stage Analysis Member:
To see more like this – US Stocks watchlist posts, detailed videos each weekend, use our unique Stage Analysis tools, such as the US Stocks & ETFs Screener, Charts, Market Breadth, Group Relative Strength and more...
Join Today
Disclaimer: For educational purpose only. Not investment advice. Seek professional advice from a financial advisor before making any investing decisions.