There were 34 stocks highlighted from the US stocks watchlist scans today...
Read More

Blog
09 February, 2024
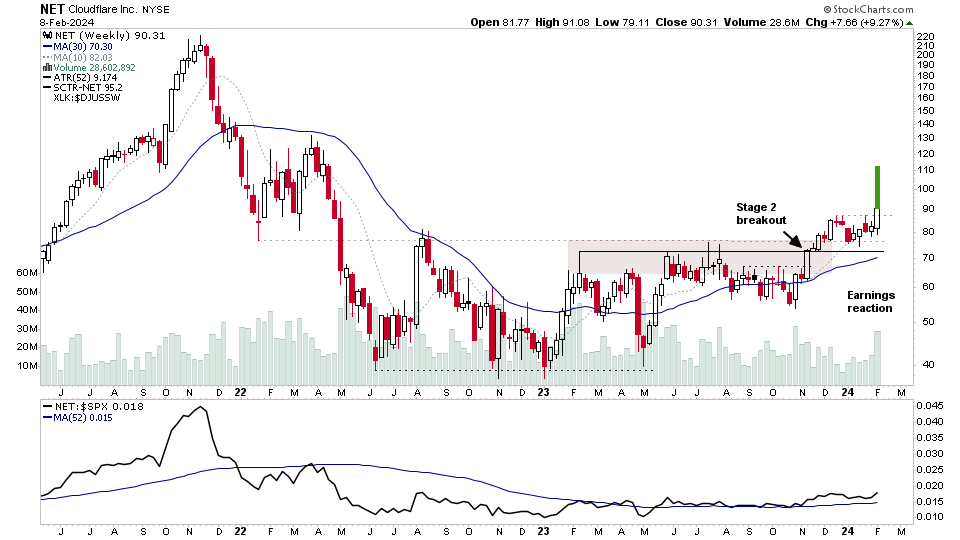
US Stocks Watchlist – 8 February 2024
08 February, 2024
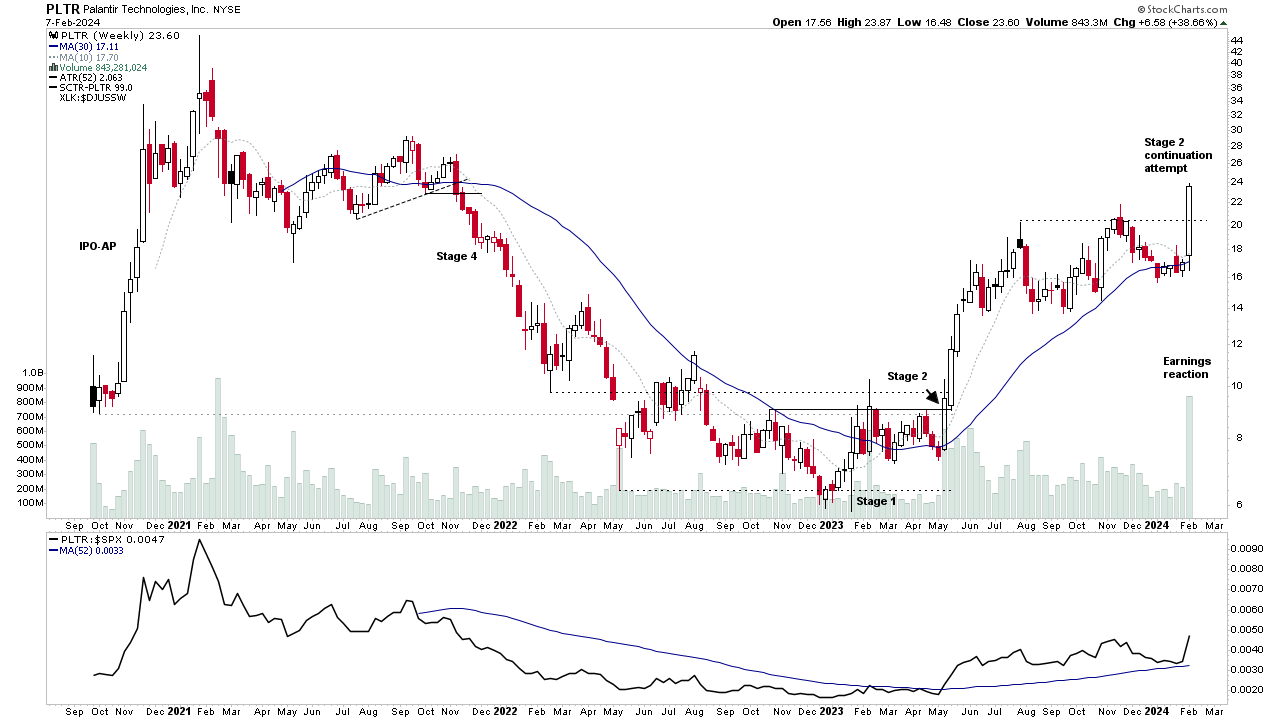
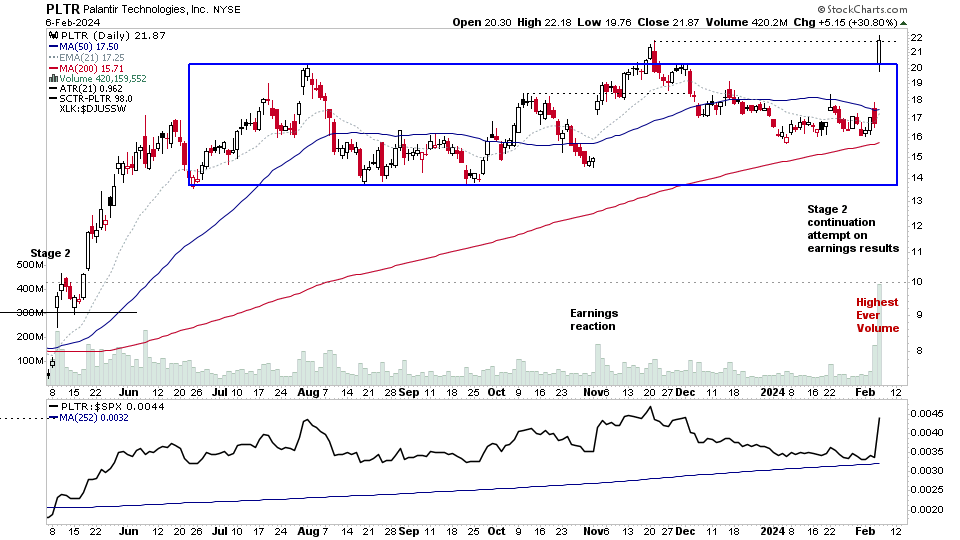
Video: Earnings Moves and Watchlist Stocks – 7 February 2024 (41 mins)
Stage Analysis midweek video discussing of some of this weeks earnings moves, plus the recent watchlist stocks on multiple timeframes and major crypto coins analysis....
Read More
06 February, 2024
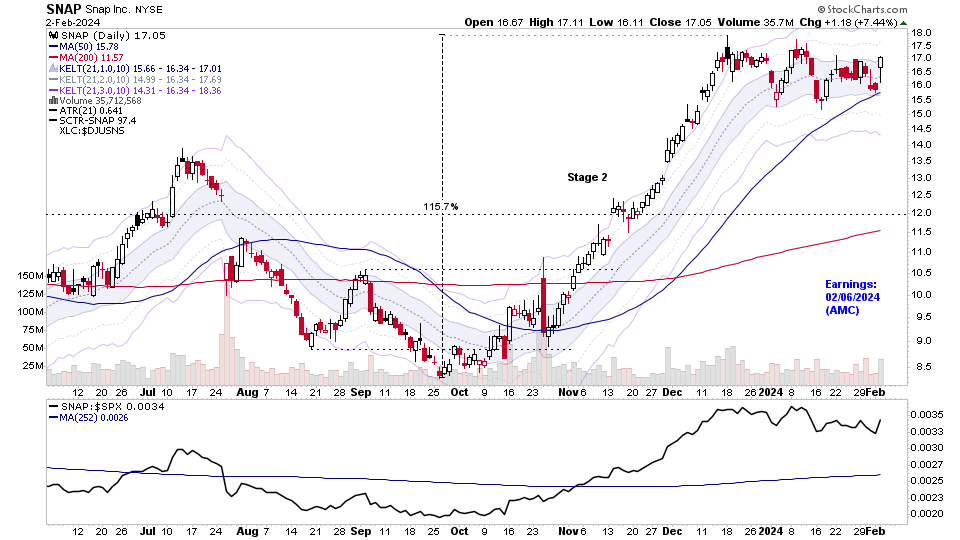
US Stocks Watchlist – 6 February 2024
There were 27 stocks highlighted from the US stocks watchlist scans today...
Read More
04 February, 2024
Stage Analysis Members Video – 4 February 2024 (1hr 7mins)
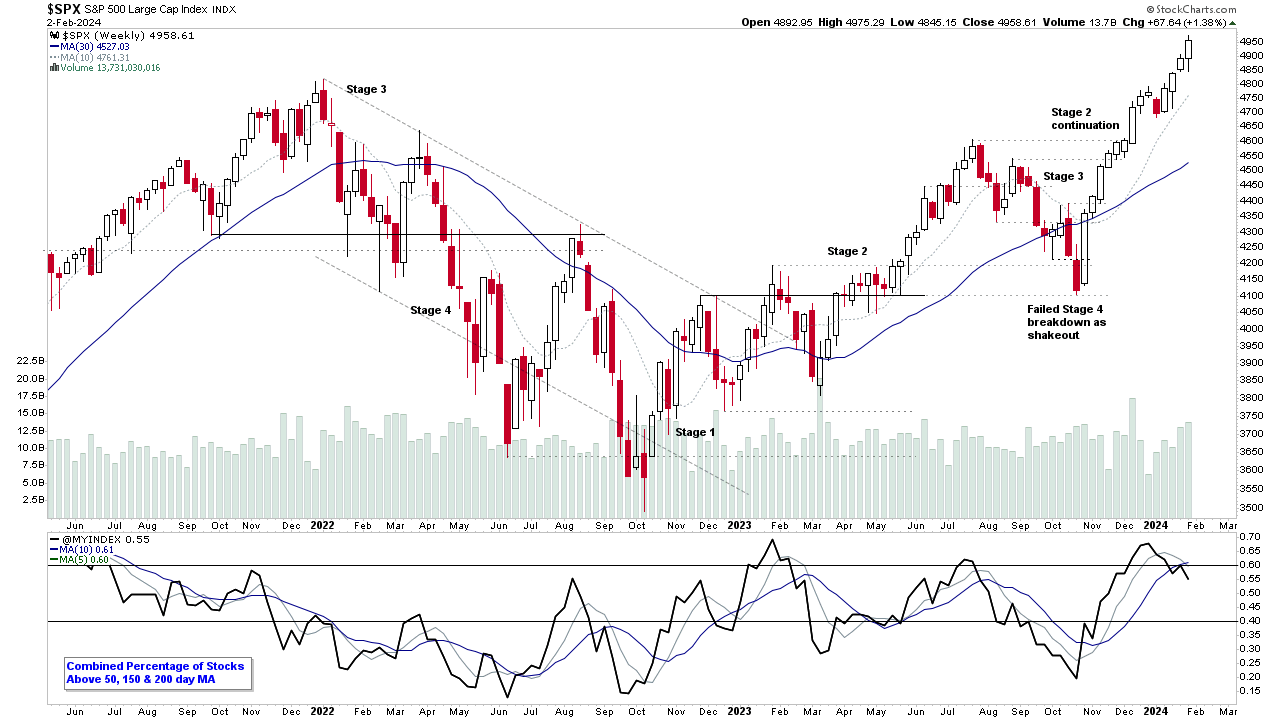
Stage Analysis members weekend video discussing the Stages of the Major US Stock Market Indexes, the Futures charts, Industry Groups Relative Strength (RS) Rankings, IBD Industry Group Bell Curve – Bullish Percent, the key Market Breadth Charts to determine the Weight of Evidence, Significant Weekly Bars and the most recent US watchlist stocks in detail on multiple timeframes...
Read More
04 February, 2024
US Stocks Watchlist – 4 February 2024
There were 28 stocks highlighted from the US stocks watchlist scans today...
Read More
01 February, 2024
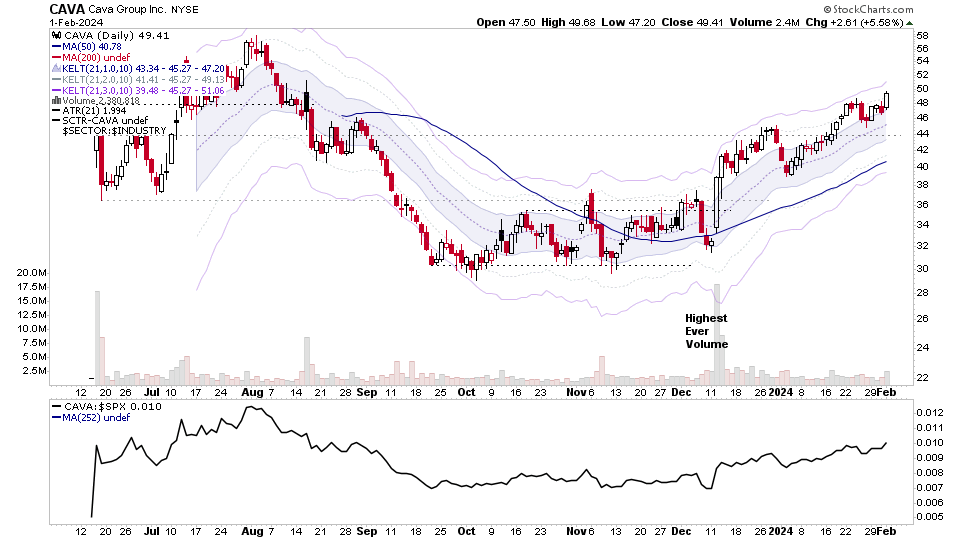
US Stocks Watchlist – 1 February 2024
There were 42 stocks highlighted from the US stocks watchlist scans today...
Read More
01 February, 2024
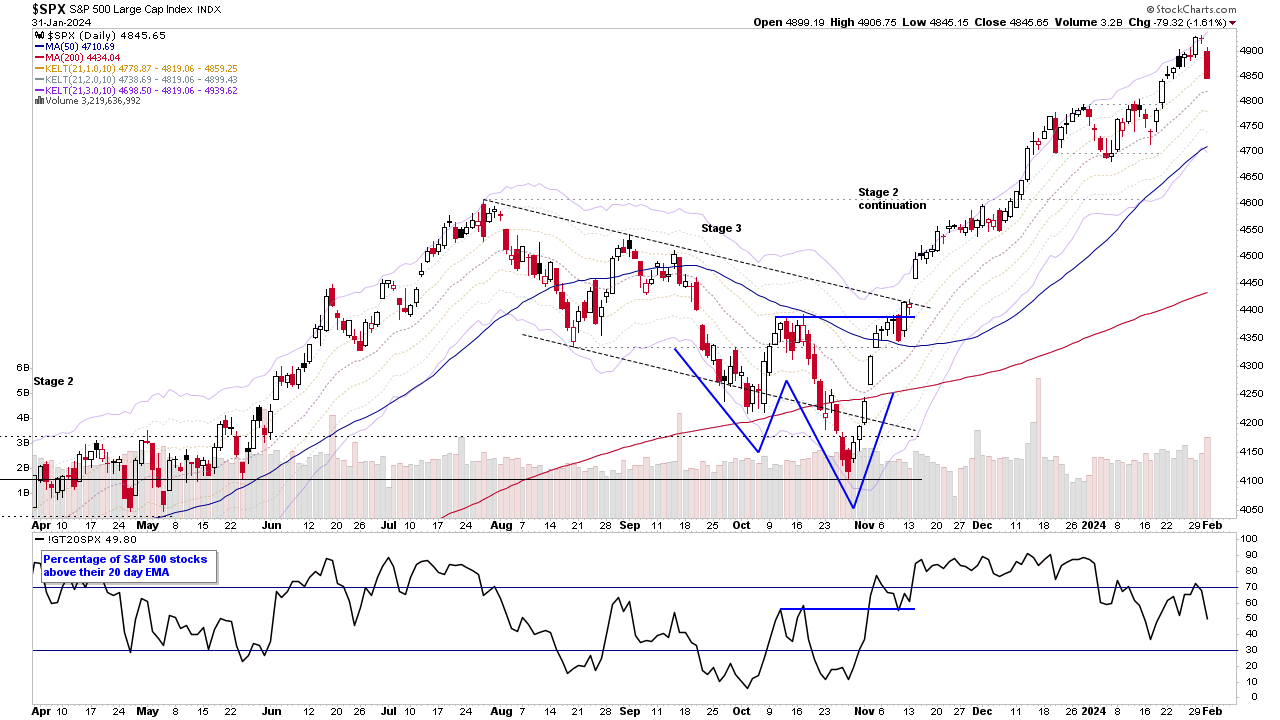
Market Update Video – 31 January 2024
Brief market update video following the Fed rate decision today...
Read More
31 January, 2024
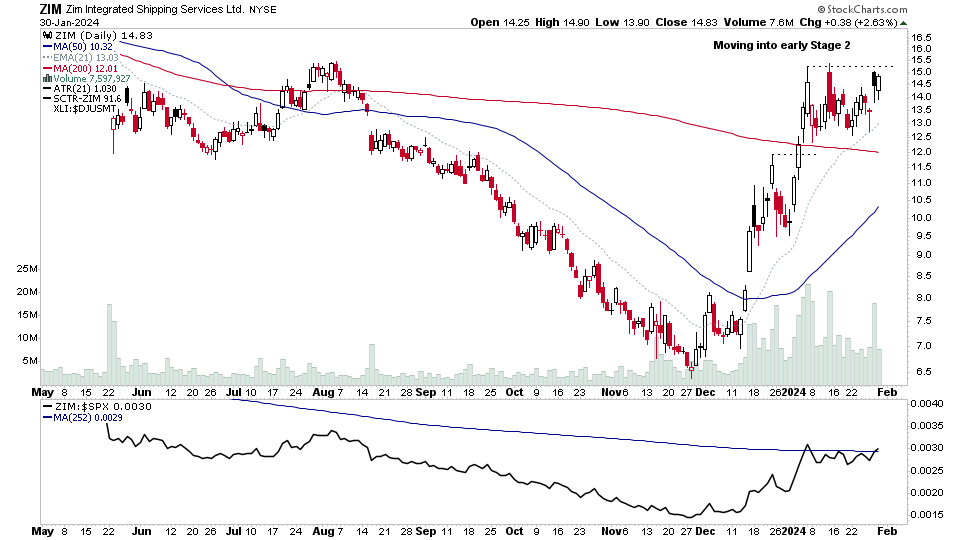
US Stocks Watchlist – 30 January 2024
There were 21 stocks highlighted from the US stocks watchlist scans today...
Read More
28 January, 2024
Stage Analysis Members Video – 28 January 2024 (1hr 15mins)
Stage Analysis members video discussing the Major US Stock Market Indexes, the Futures charts, Industry Groups Relative Strength (RS) Rankings, IBD Industry Group Bell Curve – Bullish Percent, the key Market Breadth Charts to determine the Weight of Evidence, Significant Weekly Bars and the most recent US watchlist stocks in detail on multiple timeframes.
Read More
28 January, 2024
US Stocks Watchlist – 28 January 2024
There were 30 stocks highlighted from the US stocks watchlist scans today...
Read More