Stage Analysis members weekend video with a discussion of the US Watchlist Stocks in detail on multiple timeframes, the NEW market breadth charts on the GICS Group, Industry and Sub-industry pages, the Industry Groups Relative Strength (RS) Rankings, the Bell Curves, the key Market Breadth Charts to determine the Weight of Evidence, Significant Weekly Bars, and the Major US Stock Market Indexes.
Read More

Blog
23 June, 2024
Stage Analysis Members Video – 23 June 2024 (55 mins)
09 June, 2024
Stage Analysis Members Video – 9 June 2024 (57 mins)
Stage Analysis members weekend video which this week starts with a discussion of the US Watchlist Stocks in detail on multiple timeframes, the continued improvements to the Stage Analysis Screener, the Industry Groups Relative Strength (RS) Rankings, the Bell Curves, the key Market Breadth Charts to determine the Weight of Evidence, Significant Weekly Bars, and the Major US Stock Market Indexes.
Read More
05 June, 2024
Video: New Features Added – Multiple GICS Bell Curves (14 mins)
A brief video discussing the two NEW GICS Bell Curve pages that have been added this week. Covering the 74 GICS Industries and 25 GICS Groups. Giving users access to more concentrated groups than the existing 163 GICS Sub-industries Bell Curve, and thus letting you decide how granular you want to get when researching a stocks peers.
Read More
02 June, 2024
Stage Analysis Members Video – 2 June 2024 (56mins)
Stage Analysis members weekend video beginning with a discussion of the US Watchlist Stocks in detail on multiple timeframes, the new custom filter on the Stage Analysis Screener, the Industry Groups Relative Strength (RS) Rankings, the Sub-industries Bell Curve, the key Market Breadth Charts to determine the Weight of Evidence, Significant Weekly Bars, and the Major US Stock Market Indexes.
Read More
26 May, 2024
Stage Analysis Members Video – 26 May 2024 (59mins)
Stage Analysis members weekend video discussing the US Watchlist Stocks in detail on multiple timeframes, the new Stage Analysis Screener, the Industry Groups Relative Strength (RS) Rankings, the Sub-industries Bell Curve, the key Market Breadth Charts to determine the Weight of Evidence, some of this weeks Significant Bars, and the Major US Stock Market Indexes.
Read More
19 May, 2024
Stage Analysis Members Video – 19 May 2024 (42mins)
Stage Analysis members weekend video discussing some of this weeks Significant Bars, followed by more new Stage Analysis Screener options added, the Industry Groups Relative Strength (RS) Rankings, the Sub-industries Bell Curve, the key Market Breadth Charts to determine the Weight of Evidence, and the Major US Stock Market Indexes.
Read More
12 May, 2024
Stage Analysis Members Video – 12 May 2024 (1hr 3mins)
Stage Analysis members weekend video beginning with a look at some of this weeks Significant Bars, followed by the weekend US watchlist stocks, then the New Stage Analysis Screener options, the Industry Groups Relative Strength (RS) Rankings, the key Market Breadth Charts to determine the Weight of Evidence, and the Major US Stock Market Indexes.
Read More
05 May, 2024
Stage Analysis Members Video – 5 May 2024 (47 mins)
Stage Analysis members weekend video looking at the most recent US watchlist stocks, discussing the New Stage Analysis Screener options and changes to the Members section, the Industry Groups Relative Strength (RS) Rankings, the key Market Breadth Charts to determine the Weight of Evidence, and the Major US Stock Market Indexes.
Read More
05 May, 2024
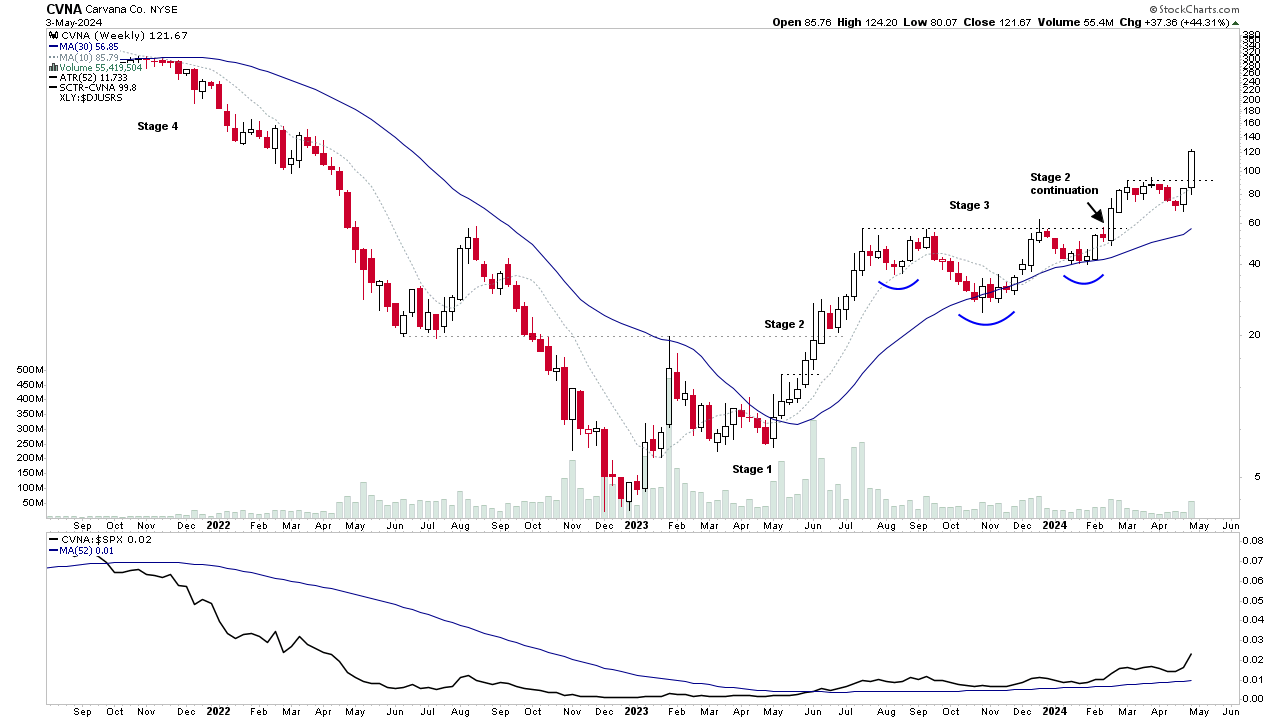
Video: Significant Weekly Bars – CVNA, ASPN, TMDX and More – 5 May 2024 (20mins)
Discussing some of the weeks biggest movers in Stage 2 including CVNA, ASPN, TMDX and more...
Read More
01 May, 2024
Video: New Features – 1 May 2024 (25mins)
Video discussing more of the new features added in the last week to the Stage Analysis website...
Read More