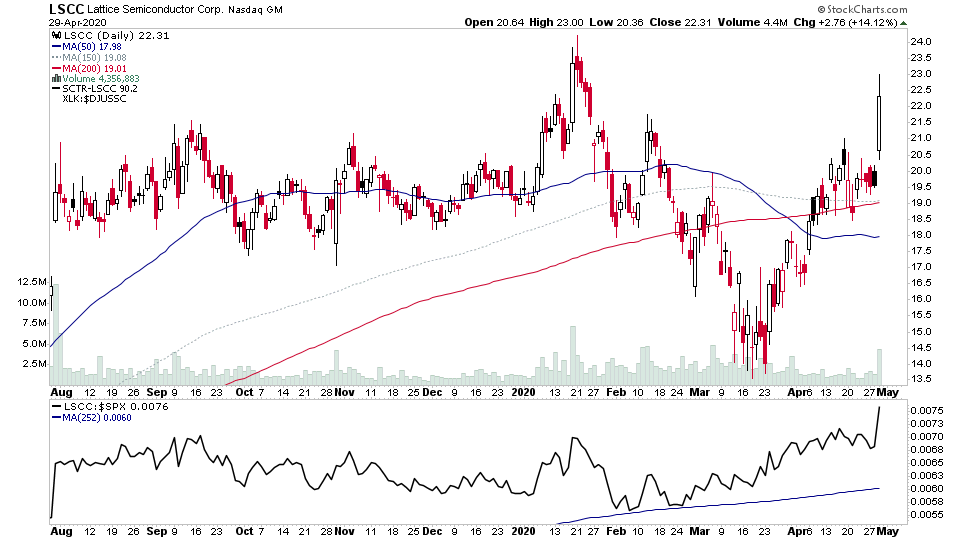
For the watchlist from Wednesdays scans - ATRC, CALX, CEMI, CGEN, EVER, FVRR, GILD, GNMK, HIMX, LSCC, MKSI, MRSN, PAYC, PCTY, PXLW, SPOT, VRML, VSTO, YUMC. The scans produced a vast number of stocks tonight to go through, and 80% of them looked the same, which were small caps breaking out of extremely depressed ranges on strong volume.
Read More

Blog
29 April, 2020
US Breakout Stocks Watchlist - 29 April 2020
28 April, 2020
US Breakout Stocks Watchlist - 28 April 2020
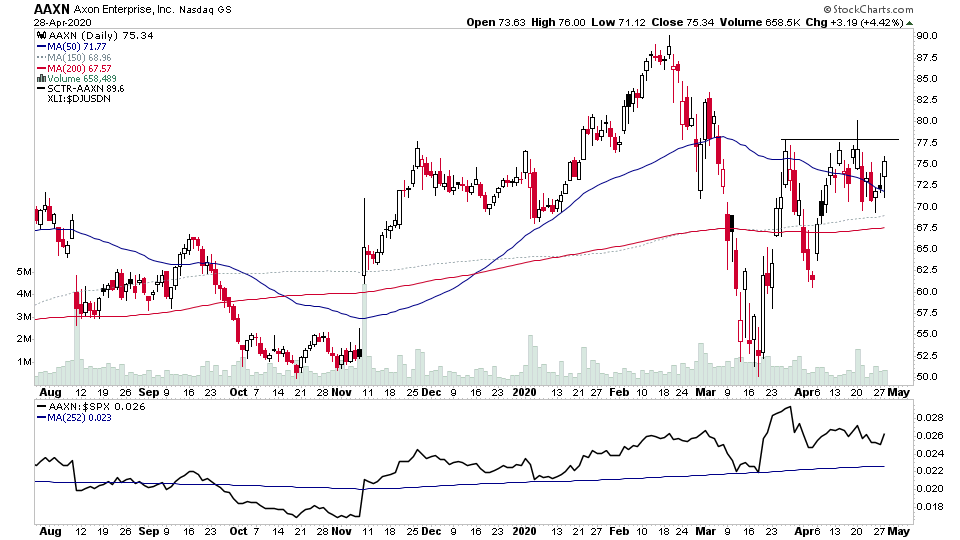
A smaller list tonight with a lot of early in the day breakout attempts and sharp reversals today. Here's tonights additions to the US watchlist from Tuesdays scans - AAXN, AMRK, CGNX, ENPH, GLOB, SVM, XONE
Read More
27 April, 2020
US Breakout Stocks Watchlist - 27 April 2020
It was big list tonight to go through, with lots of cup and handle type patterns showing up in the scans. A few had decent volume, but in the majority the volume was only around average.
Read More
25 April, 2020
US Breakout Stocks Watchlist - 24 April 2020
Although a fairly average up day in the market. There was still a number of interesting breakouts or stocks close to their breakout levels. More than half the stocks in my scans were healthcare related though, but only a few made it into the watchlist as most are very extended short term.
Read More
23 April, 2020
US Breakout Stocks Watchlist - 23 April 2020
With the S&P 500 continuing to consolidate in sideways range near the 50% retracement level, and multiple other markets doing similar things. I thought it might be time to start looking for the watchlist again incase we do resolve to the upside.
Read More
22 April, 2020
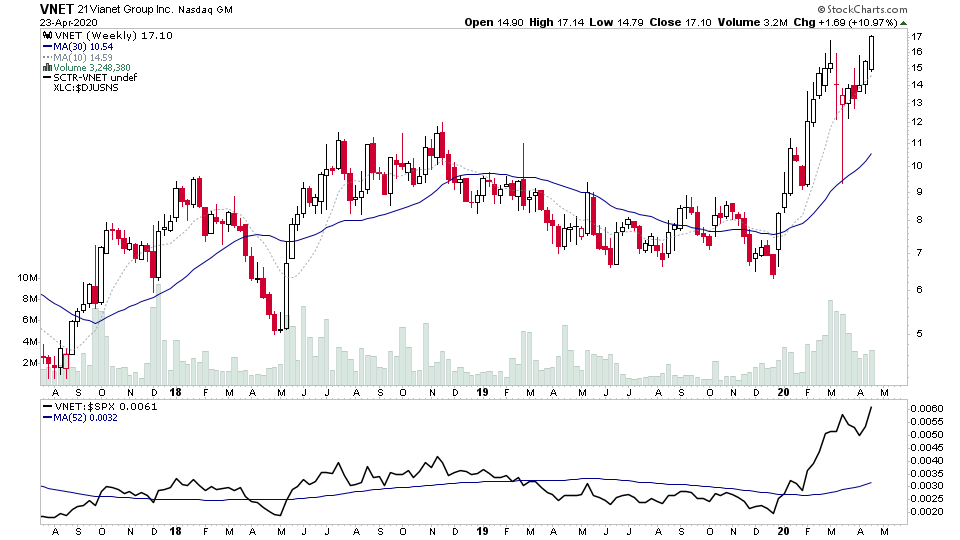
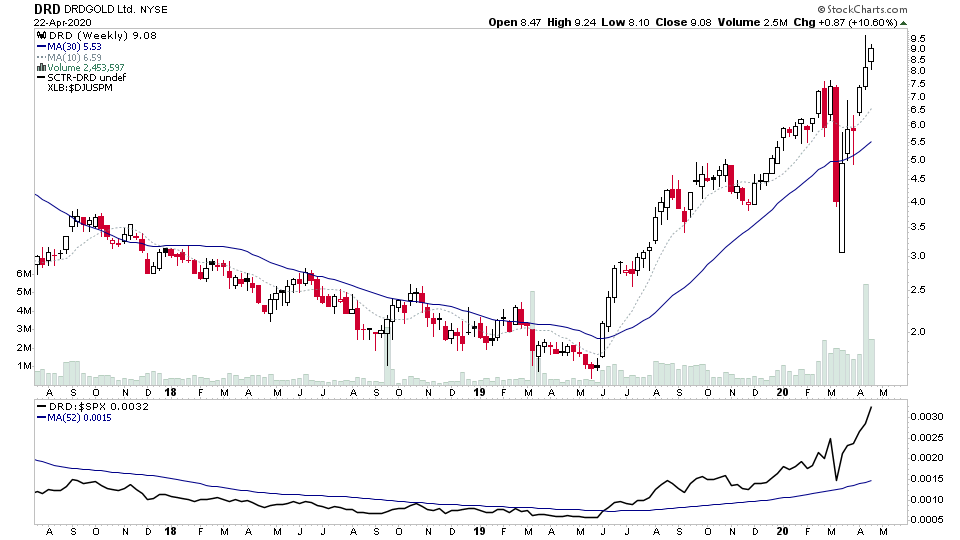
Huge Moves in Multiple Gold Stocks
Multiple Gold Stocks have had 100%+ moves in the last six weeks. There has been new highs in many stocks in the sector as physical gold trends higher outperforming the stock market indexes and other commodities.
Read More
19 April, 2020
US Major Indexes and Market Breadth Update
Another positive week in the market. But mostly for Technology, Health Care and Consumer Staples stocks, as the disparity between the sectors continues to grow
Read More
12 April, 2020
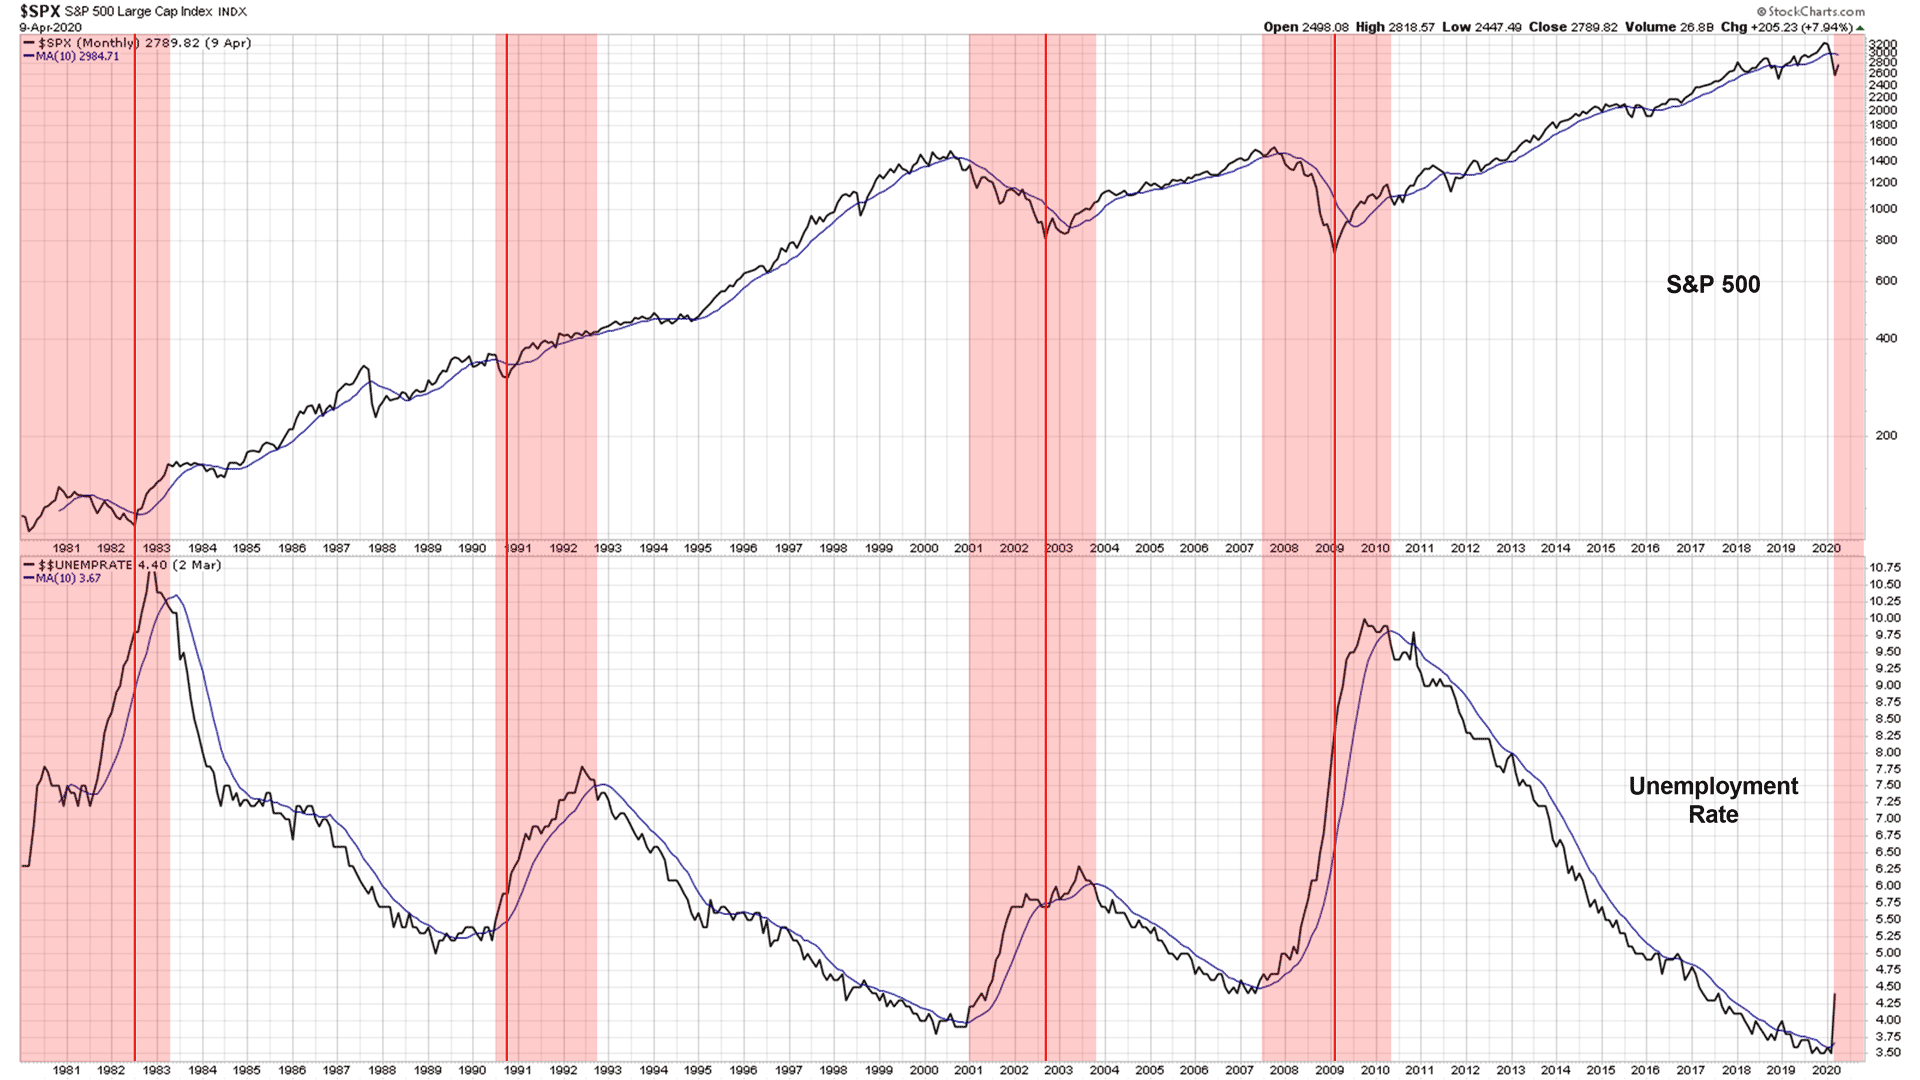
Does a New Uptrend in the Unemployment Rate Mean That a Bear Market Is Just Getting Started?
Many of the short term market breadth indicators continued to gain strength and multiple are now on bullish signals. However, the medium and longer term signals mostly remain on bearish signals, with some struggling to make much headway from their extreme low levels such as the NYSE percentage of stocks above their 150 day moving averages and the cumulative new highs new lows for example.
Read More
05 April, 2020
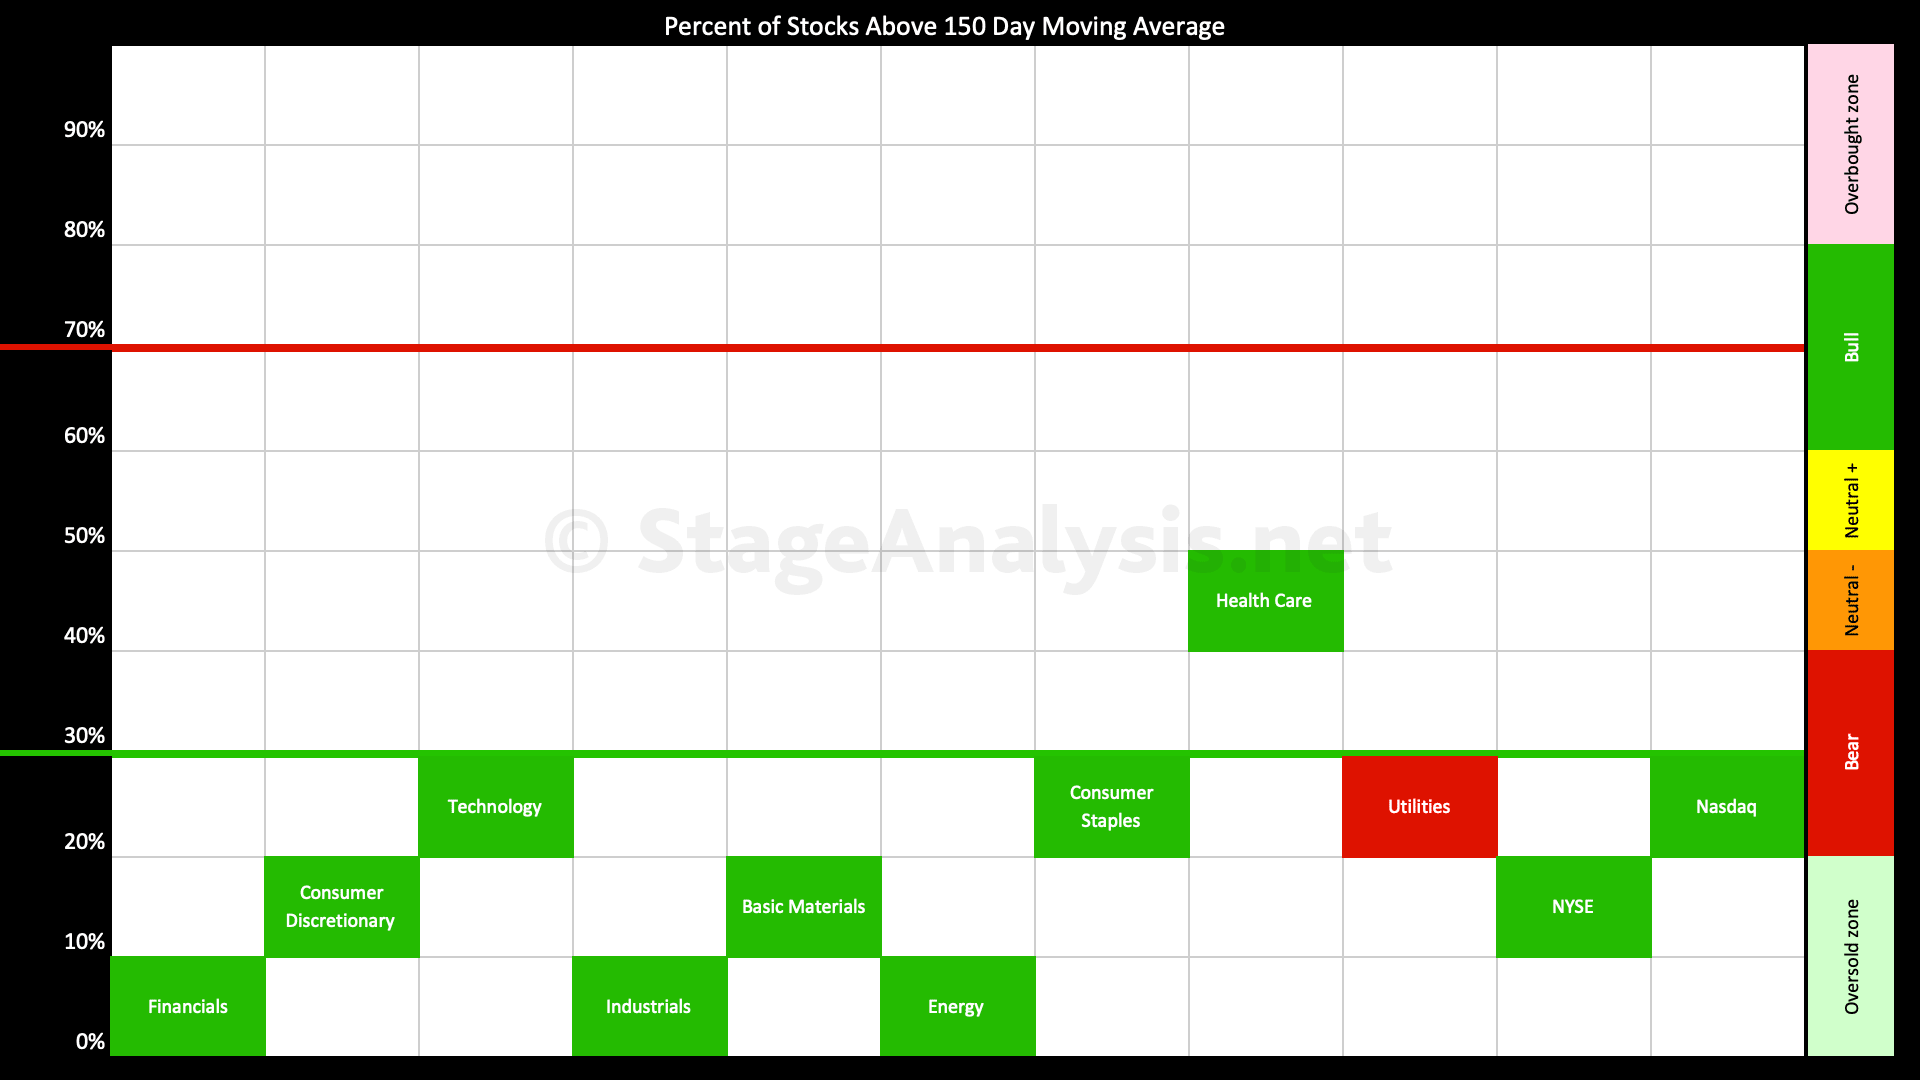
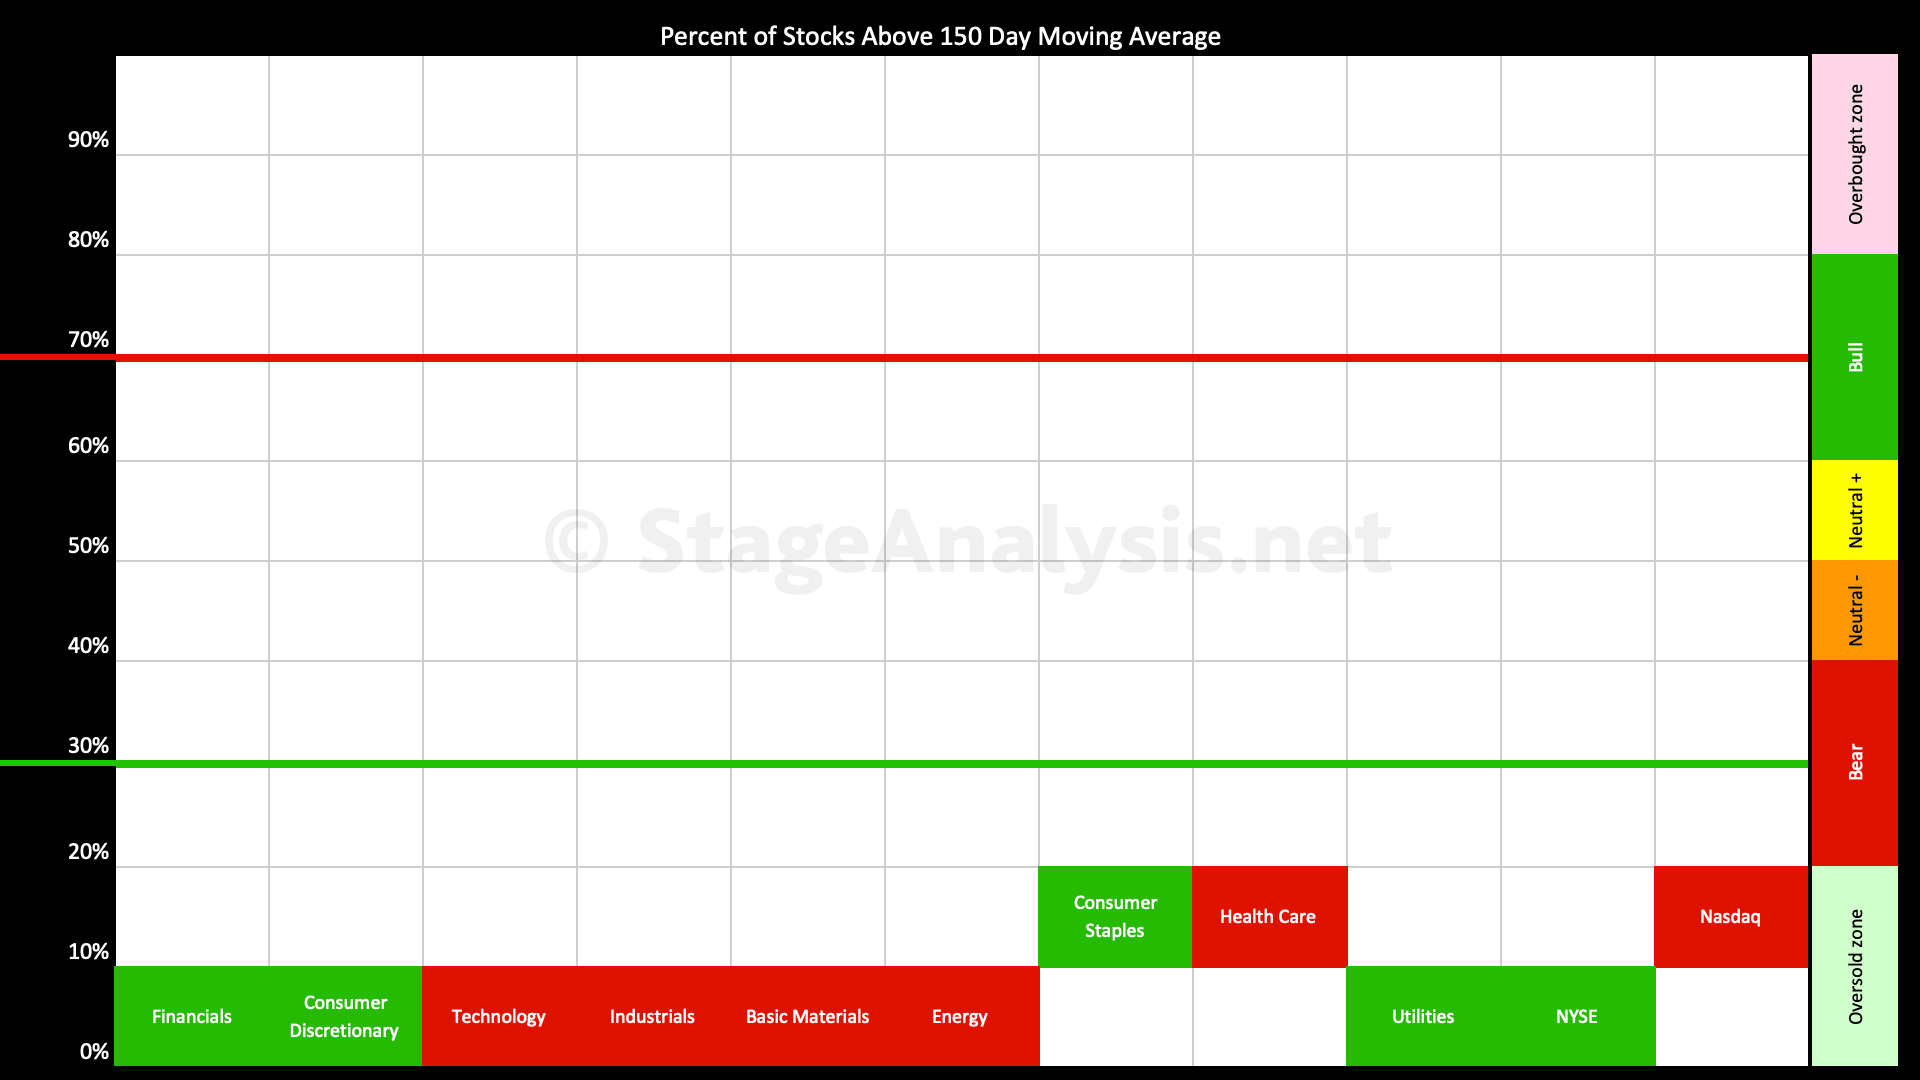
US Sectors - Percent of Stocks Above their 150 Day Moving Average
Percent of Stocks Above their 150 Day Moving Average table in each sector, which is ordered by overall health.
Read More
29 March, 2020
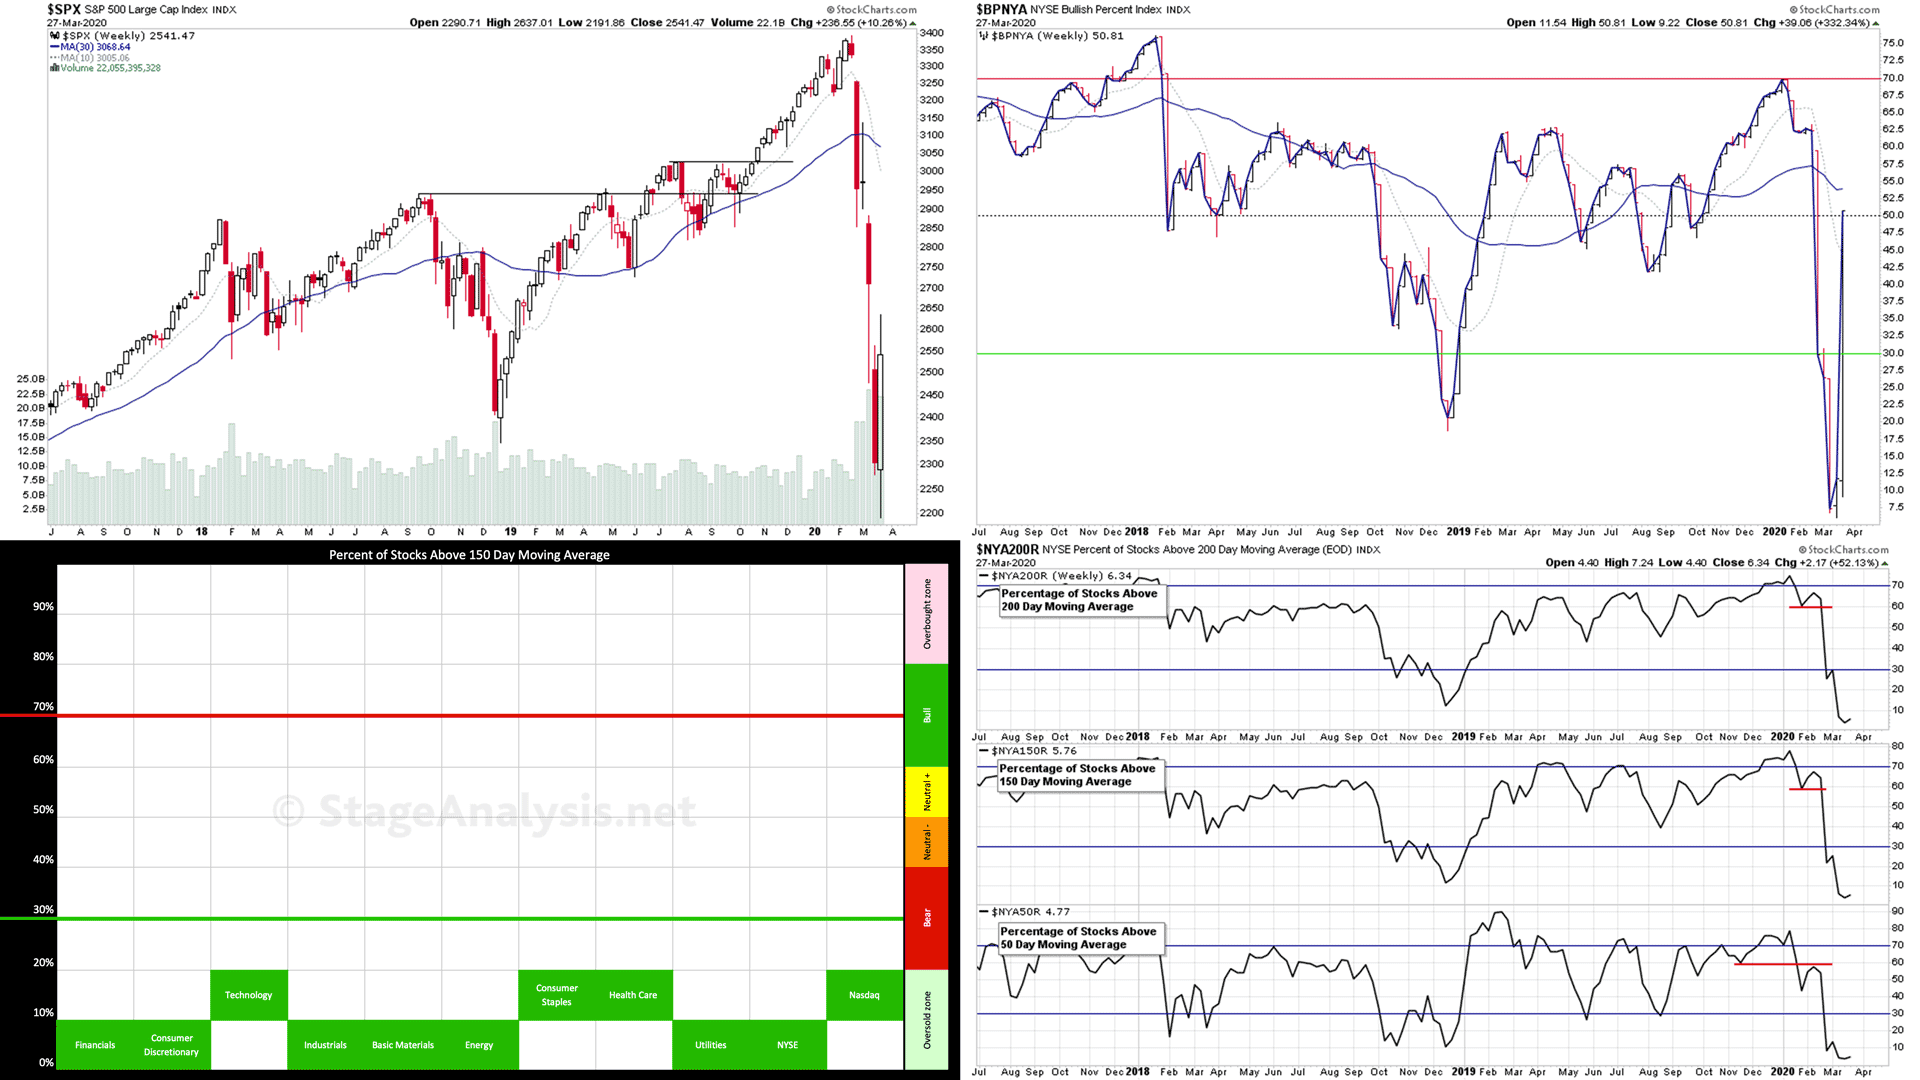
The Stock Market Has Put in a Bottom. What Do the Market Breadth Charts Suggest Next for Stocks?
It was a strong week for the major stock market indexes with multiple stock index charts closing the week with a bullish engulfing candle pattern.
Read More