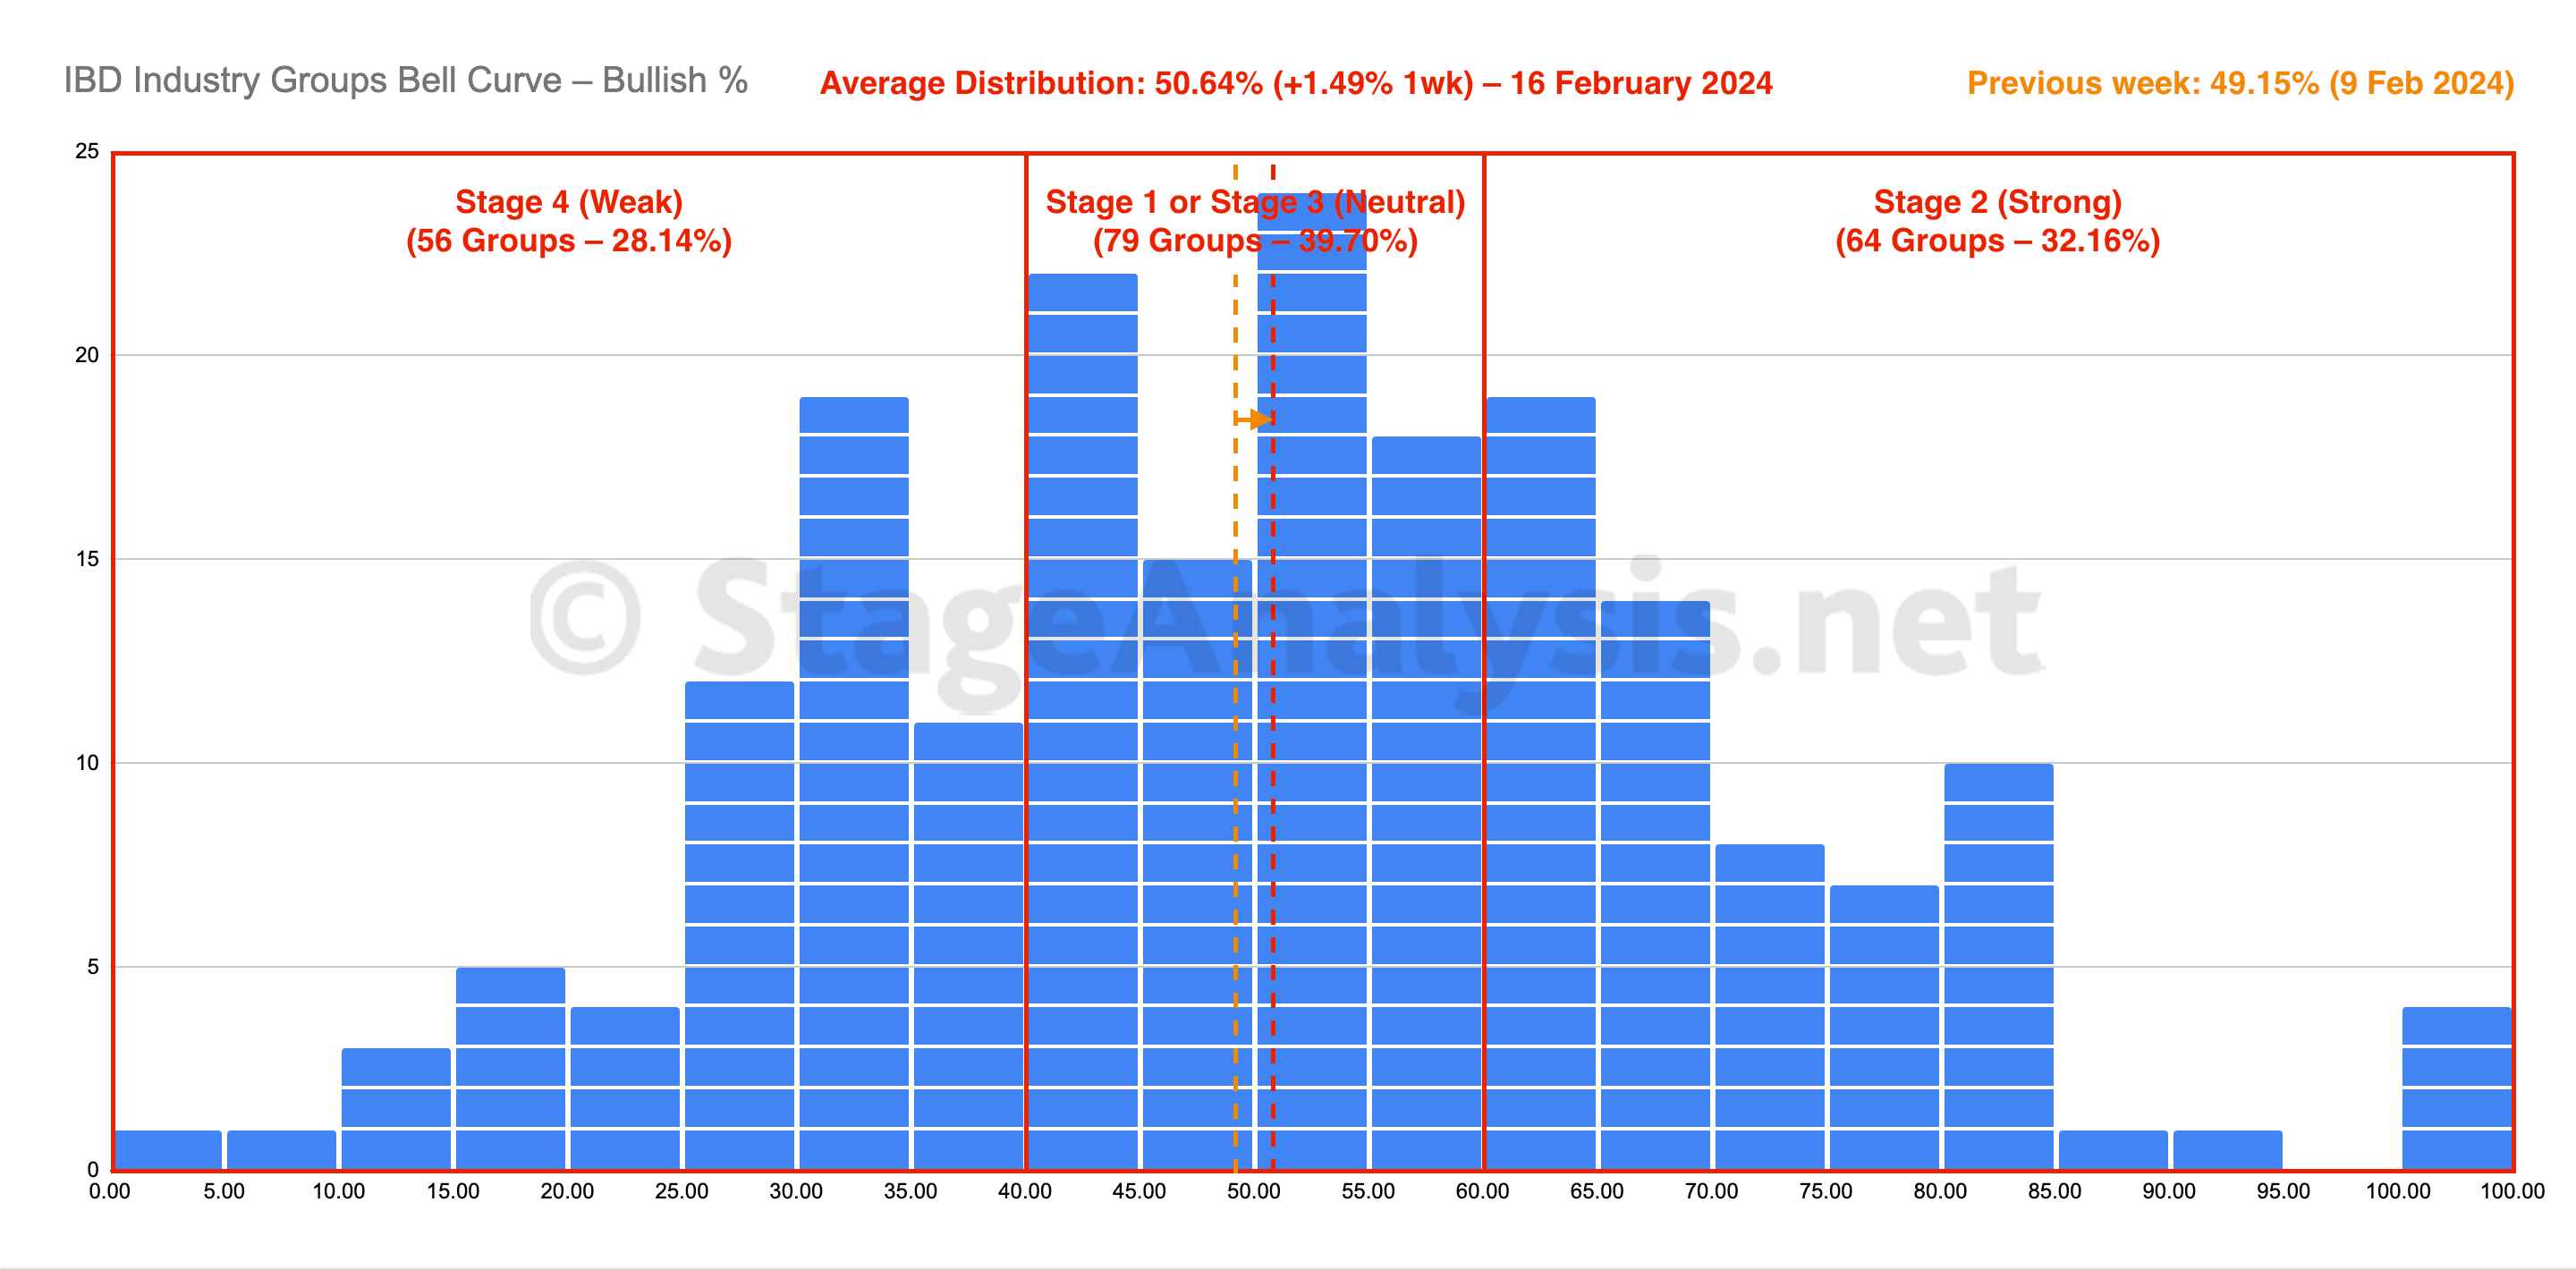
The IBD Industry Groups Bell Curve – Bullish Percent shows the few hundred industry groups plotted as a histogram chart and represents the percentage of stocks in each group that are on a point & figure (P&F) buy signal...
Read More

Blog
24 February, 2024
IBD Industry Groups Bell Curve – Bullish Percent

24 February, 2024
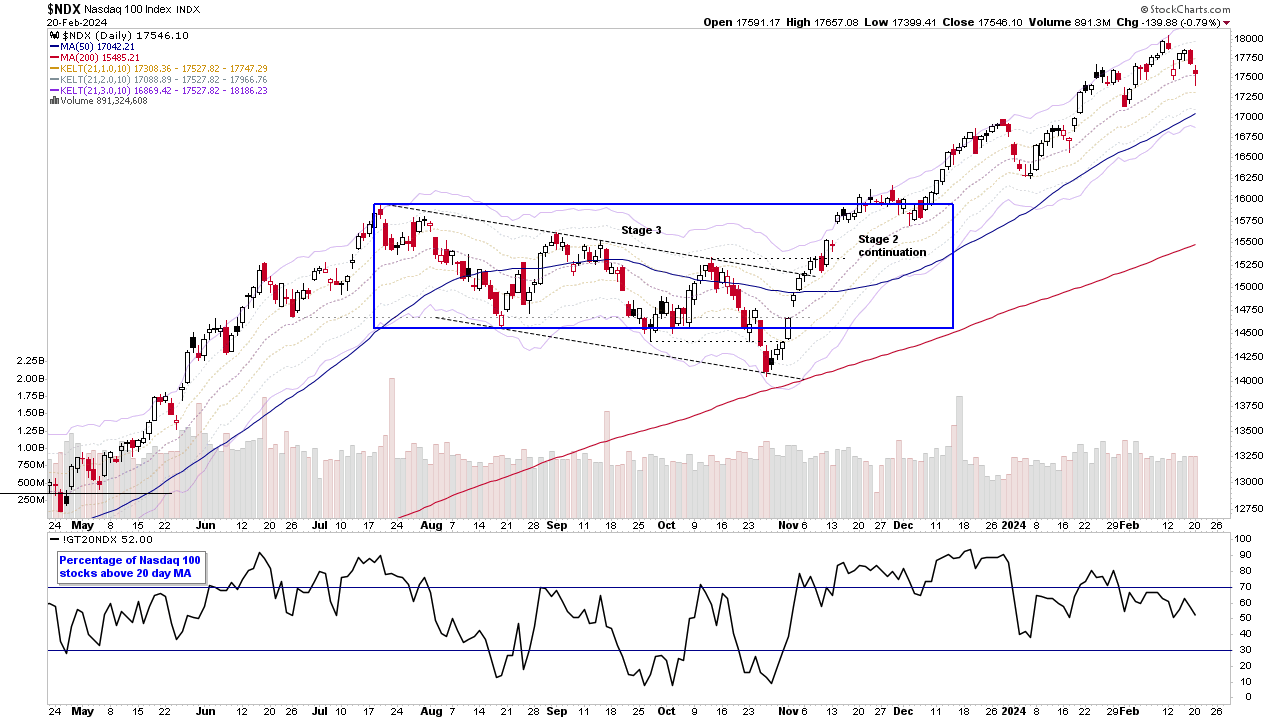
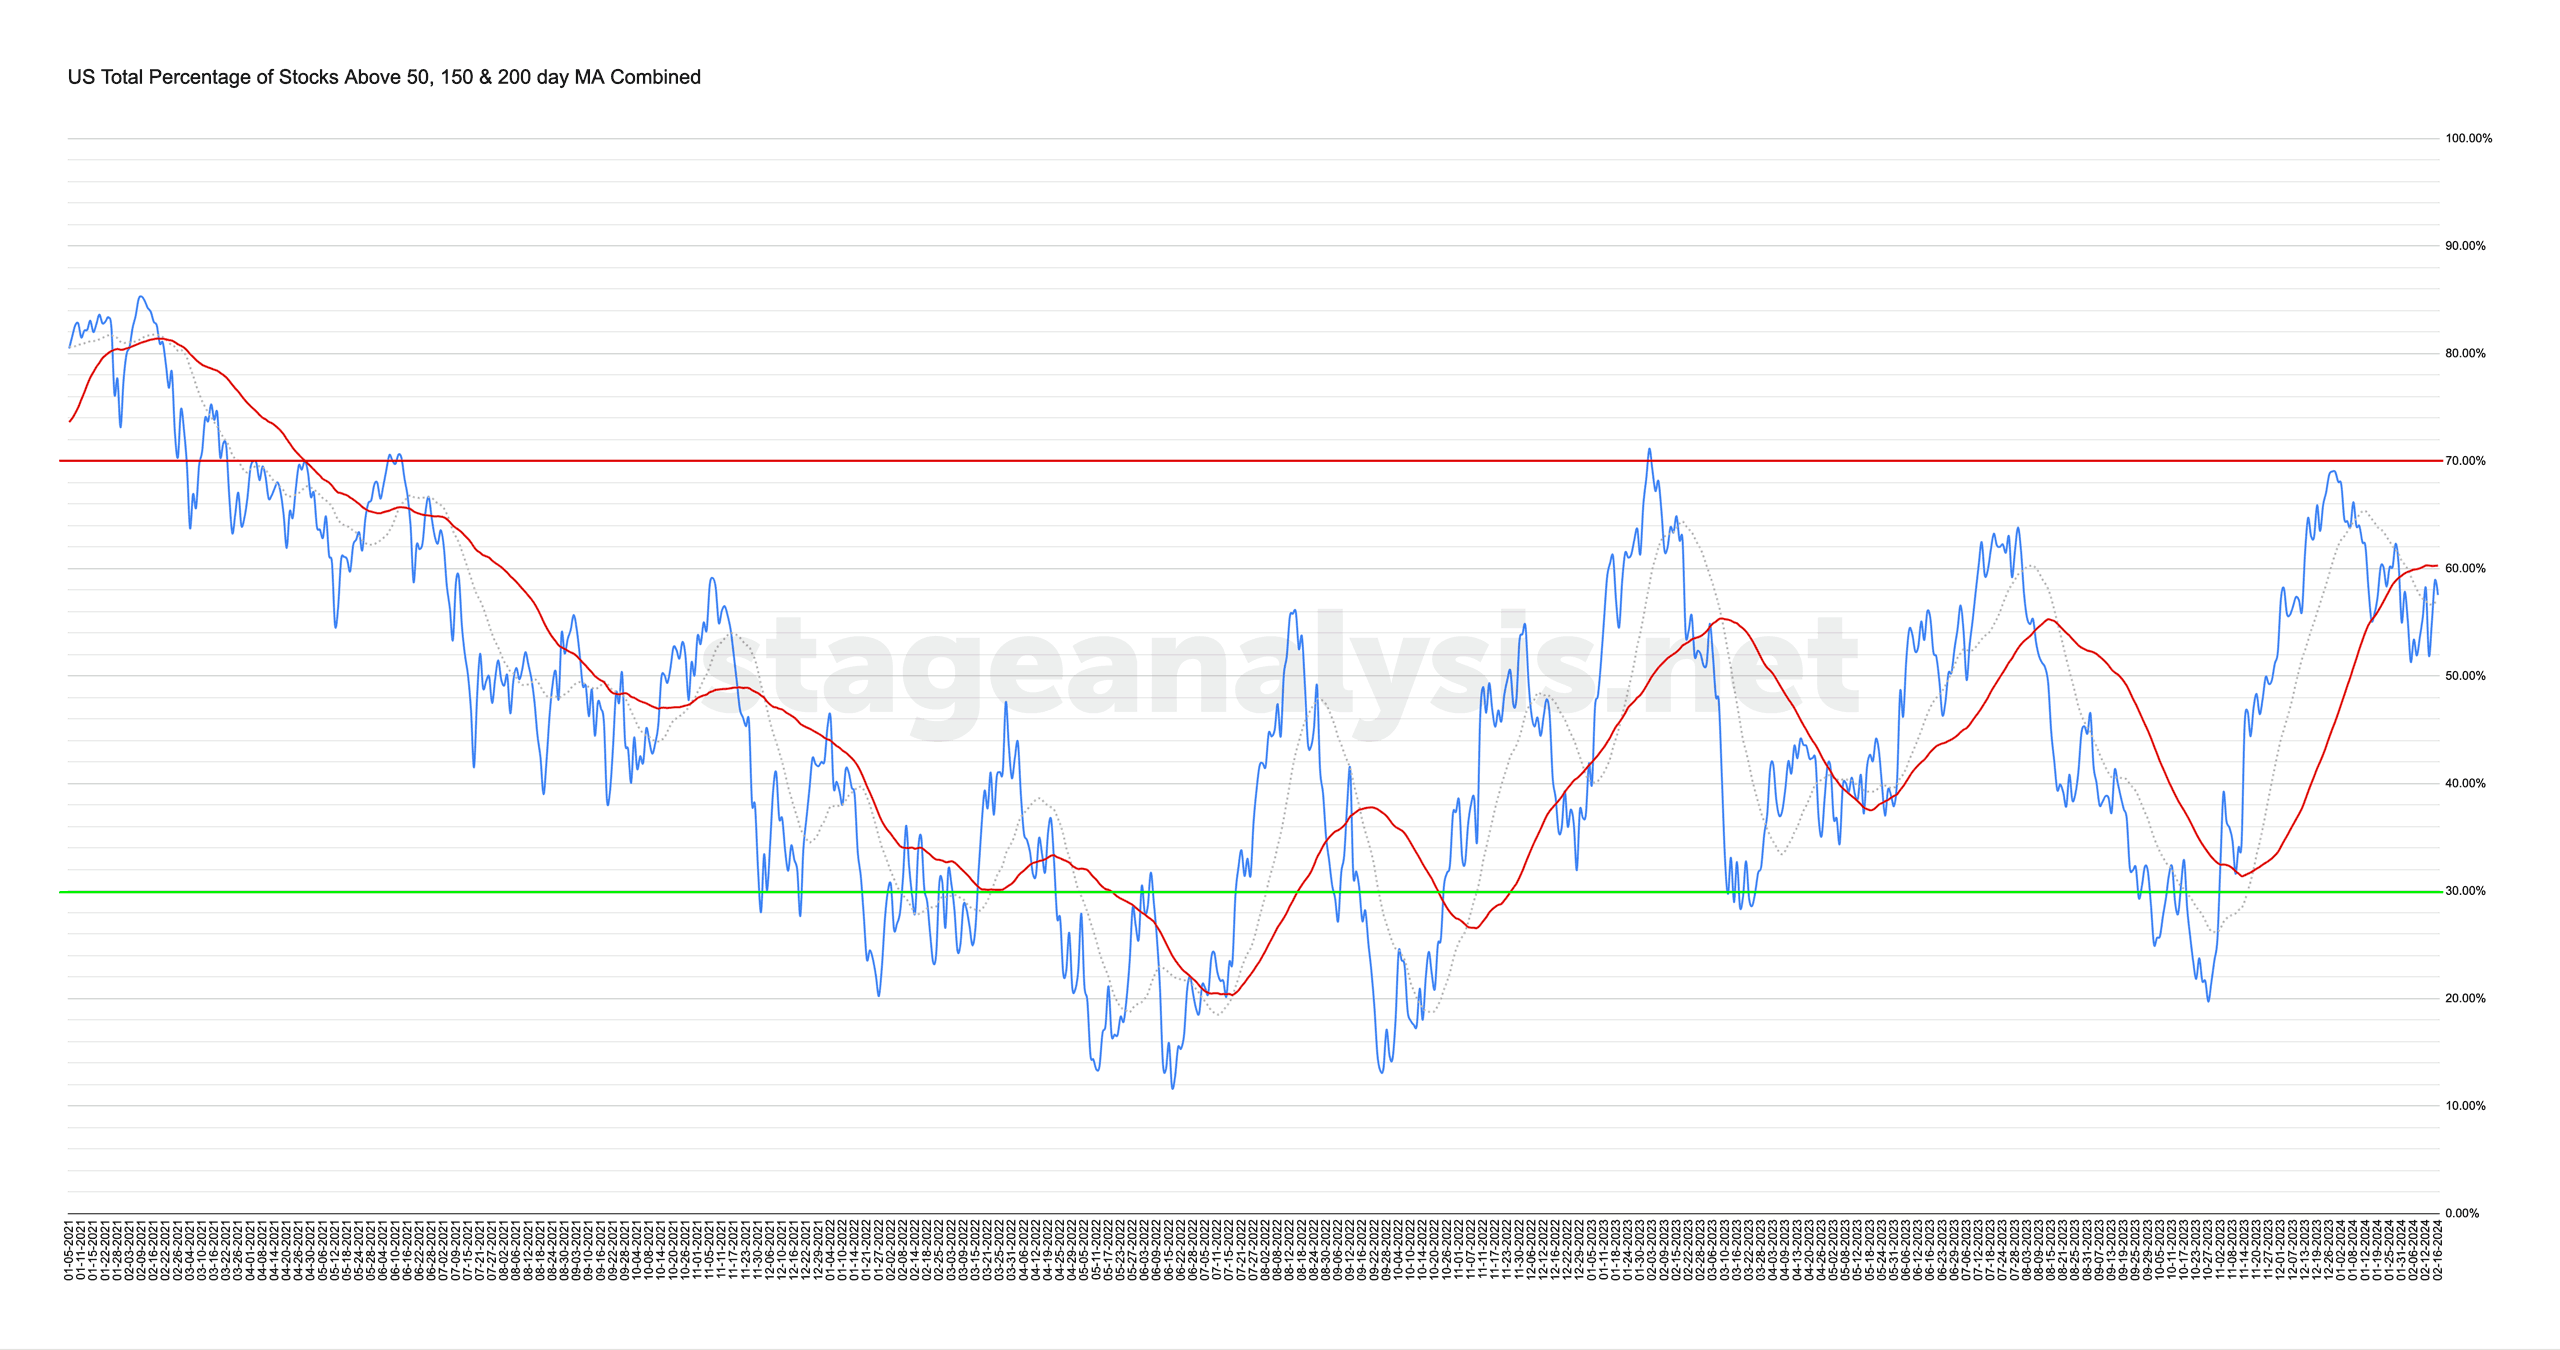
Market Breadth: Percentage of Stocks Above their 50 Day, 150 Day & 200 Day Moving Averages Combined
The US Total Percentage of Stocks above their 50 Day, 150 Day & 200 Day Moving Averages (shown above) decreased by -1.58% this week. Therefore, the overall combined average is at 55.96% in the US market (NYSE and Nasdaq markets combined) above their short, medium and long term moving averages.
Read More
23 February, 2024
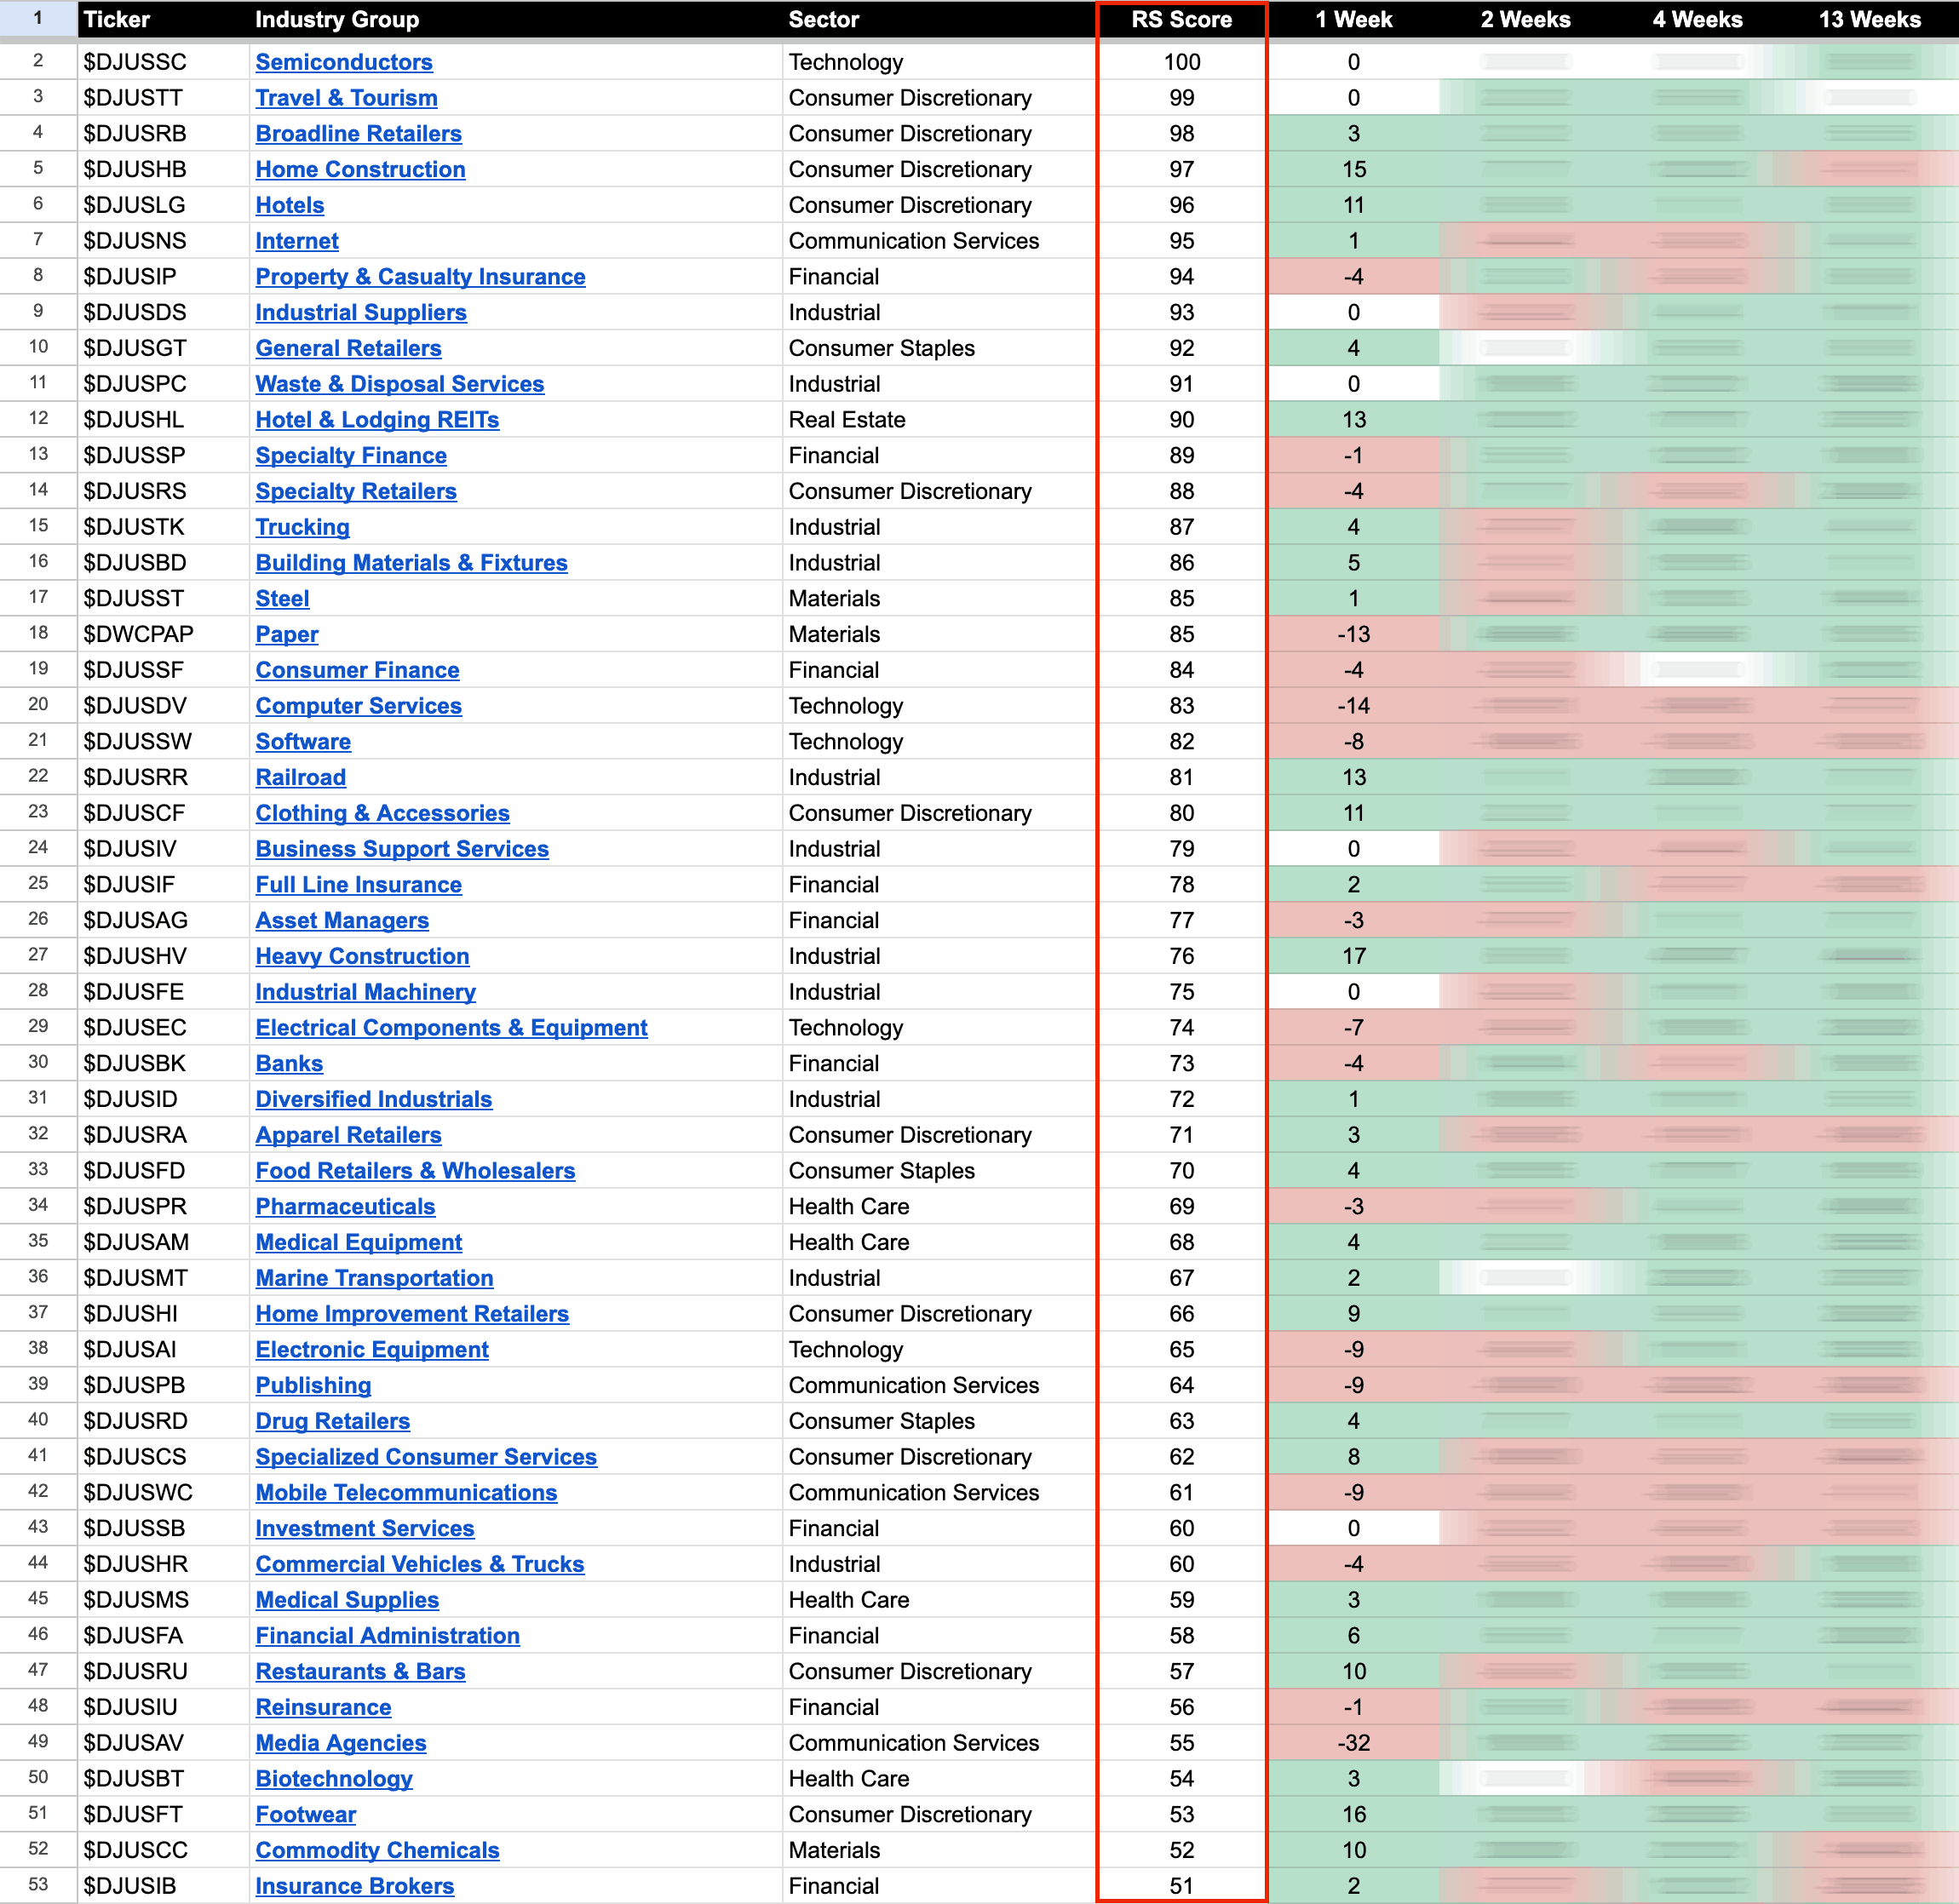
US Stocks Industry Groups Relative Strength Rankings
The purpose of the Relative Strength (RS) tables is to track the short, medium and long term RS changes of the individual groups to find the new leadership earlier than the crowd...
Read More
22 February, 2024
US Stocks Watchlist – 22 February 2024
There were 27 stocks highlighted from the US stocks watchlist scans today...
Read More
20 February, 2024
US Stocks Watchlist – 20 February 2024
There were 20 stocks highlighted from the US stocks watchlist scans today...
Read More
19 February, 2024
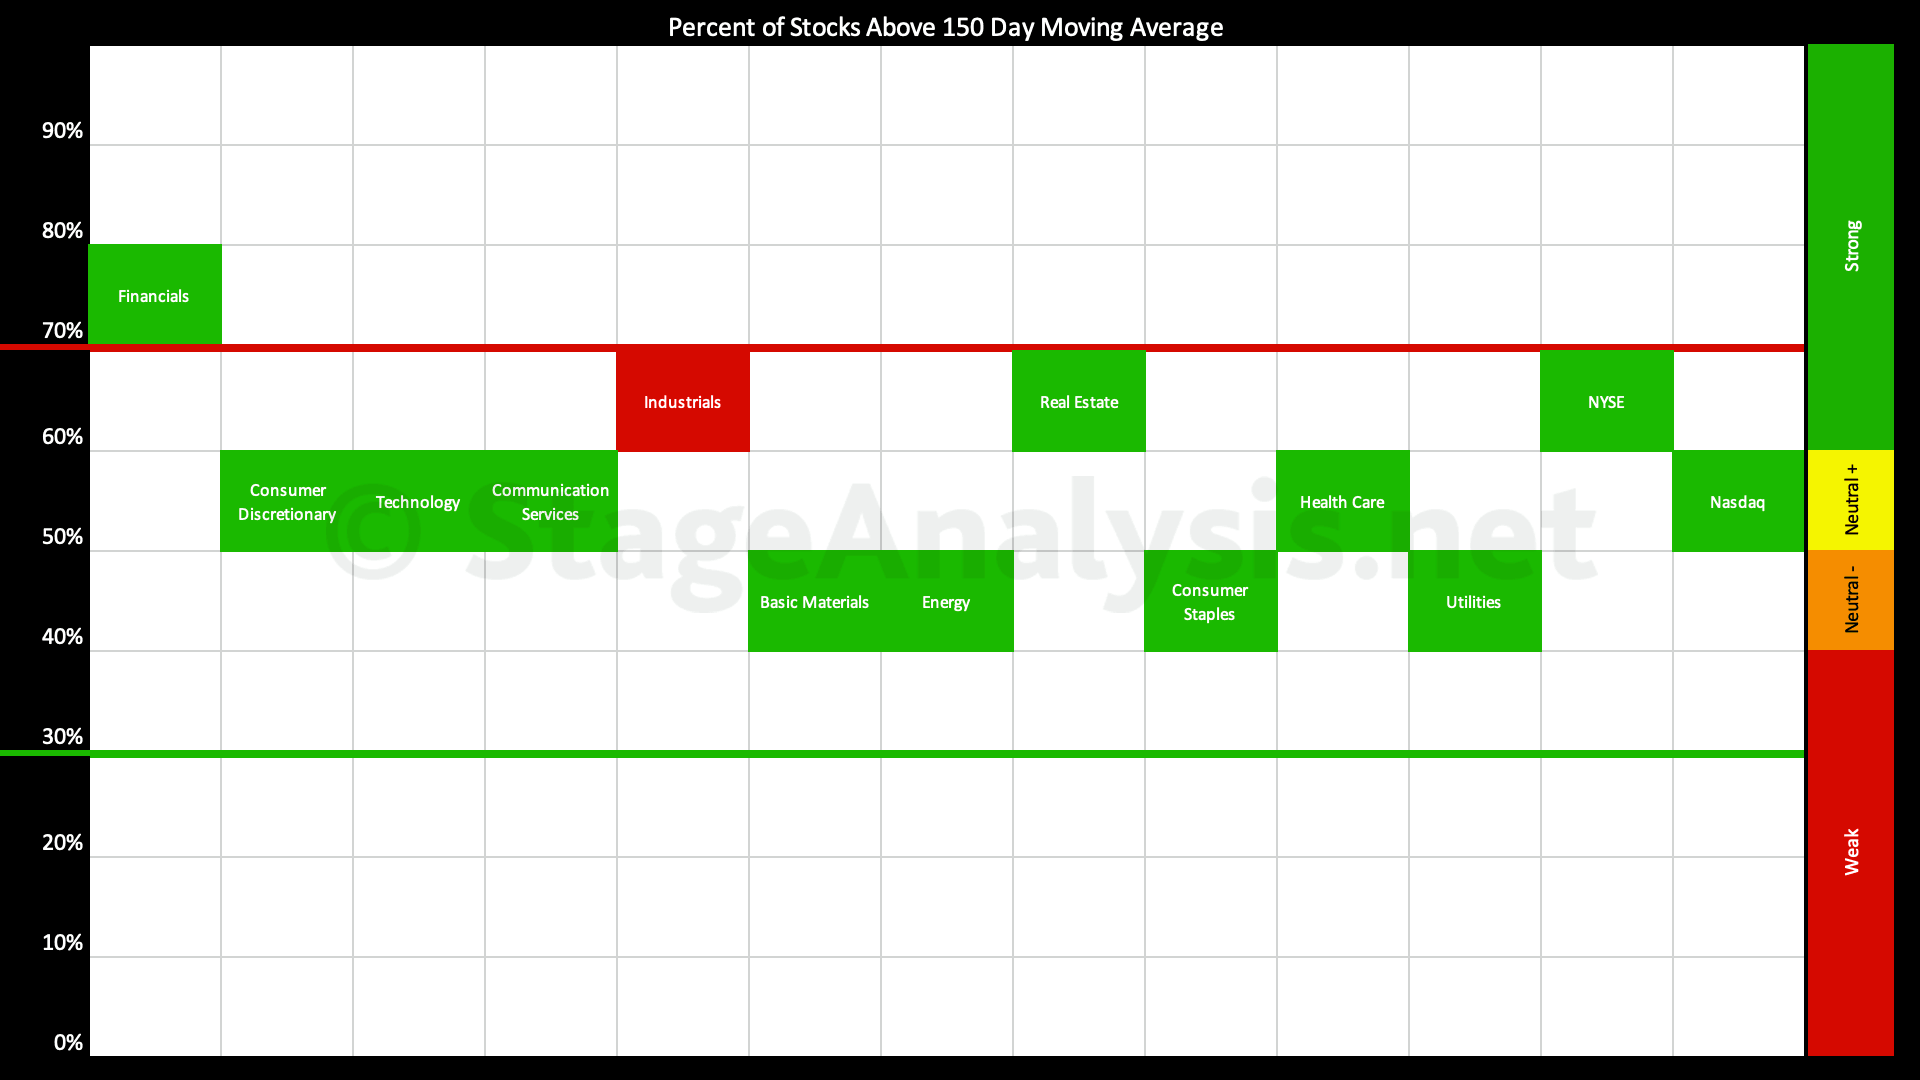
Sector Breadth: Percentage of US Stocks Above Their 150 day (30 Week) Moving Averages
The percentage of US stocks above their 150 day moving averages in the 11 major sectors increased by +7.28% since the previous post on the 5th February 2024, moving the overall average to 54.69%, which is in the Neutral+ zone (50% to 59.99% range)...
Read More
18 February, 2024
Stage Analysis Members Video – 18 February 2024 (1hr 12mins)
Stage Analysis members weekend video discussing the US watchlist stocks in detail on multiple timeframes, the Significant Weekly Bars, Industry Groups Relative Strength (RS) Rankings, IBD Industry Group Bell Curve – Bullish Percent, the key Market Breadth Charts to determine the Weight of Evidence, and the Major US Stock Market Indexes...
Read More
18 February, 2024
US Stocks Watchlist – 18 February 2024
There were 20 stocks highlighted from the US stocks watchlist scans today...
Read More
17 February, 2024
IBD Industry Groups Bell Curve – Bullish Percent
The IBD Industry Groups Bell Curve increased by +1.49 this week to finish at 50.64% overall. The amount of groups in Stage 4 (Weak) decreased by 2 (-1%), and the amount of groups in Stage 2 (Strong) increased by 7 (+3.5%), while the amount groups in Stage 1 or Stage 3 (Neutral) decreased by 5 (-2.5%)...
Read More
17 February, 2024
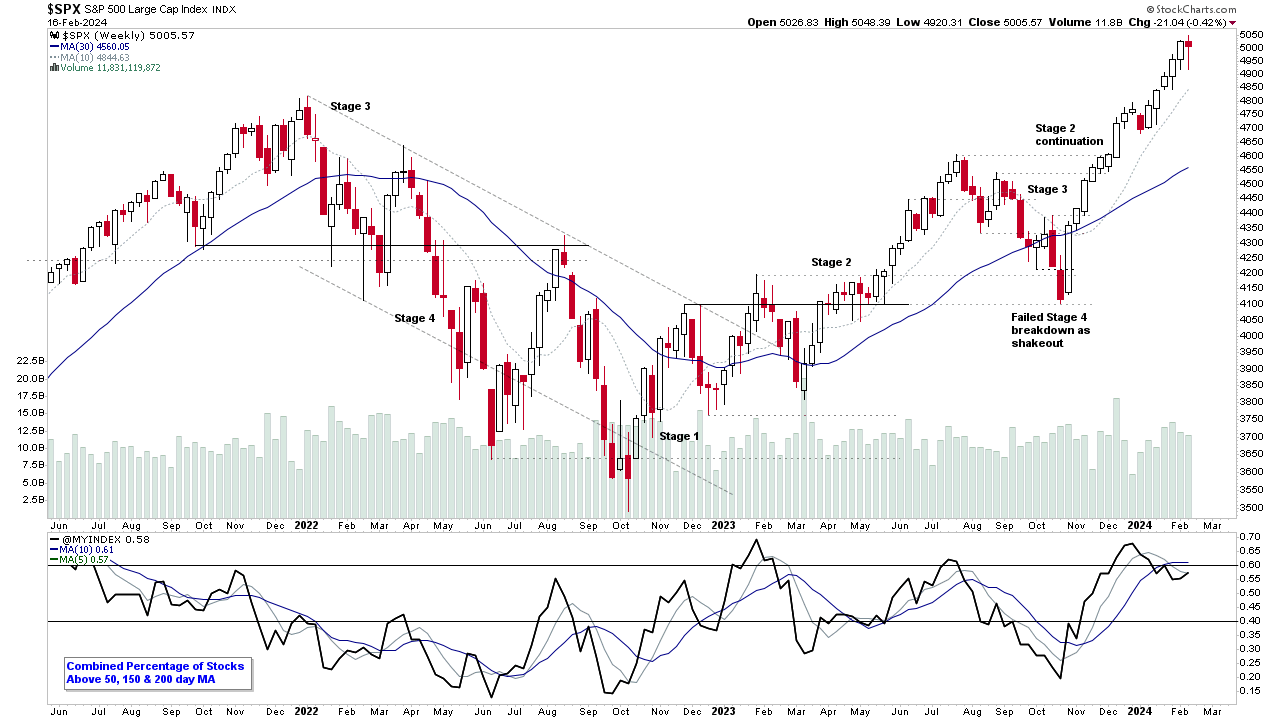
Market Breadth: Percentage of Stocks Above their 50 Day, 150 Day & 200 Day Moving Averages Combined
The US Total Percentage of Stocks above their 50 Day, 150 Day & 200 Day Moving Averages (shown above) increased by +2.00% this week. Therefore, the overall combined average is at 57.53% in the US market (NYSE and Nasdaq markets combined) above their short, medium and long term moving averages...
Read More