
US Stocks Industry Groups Relative Strength Rankings
The full post is available to view by members only. For immediate access:
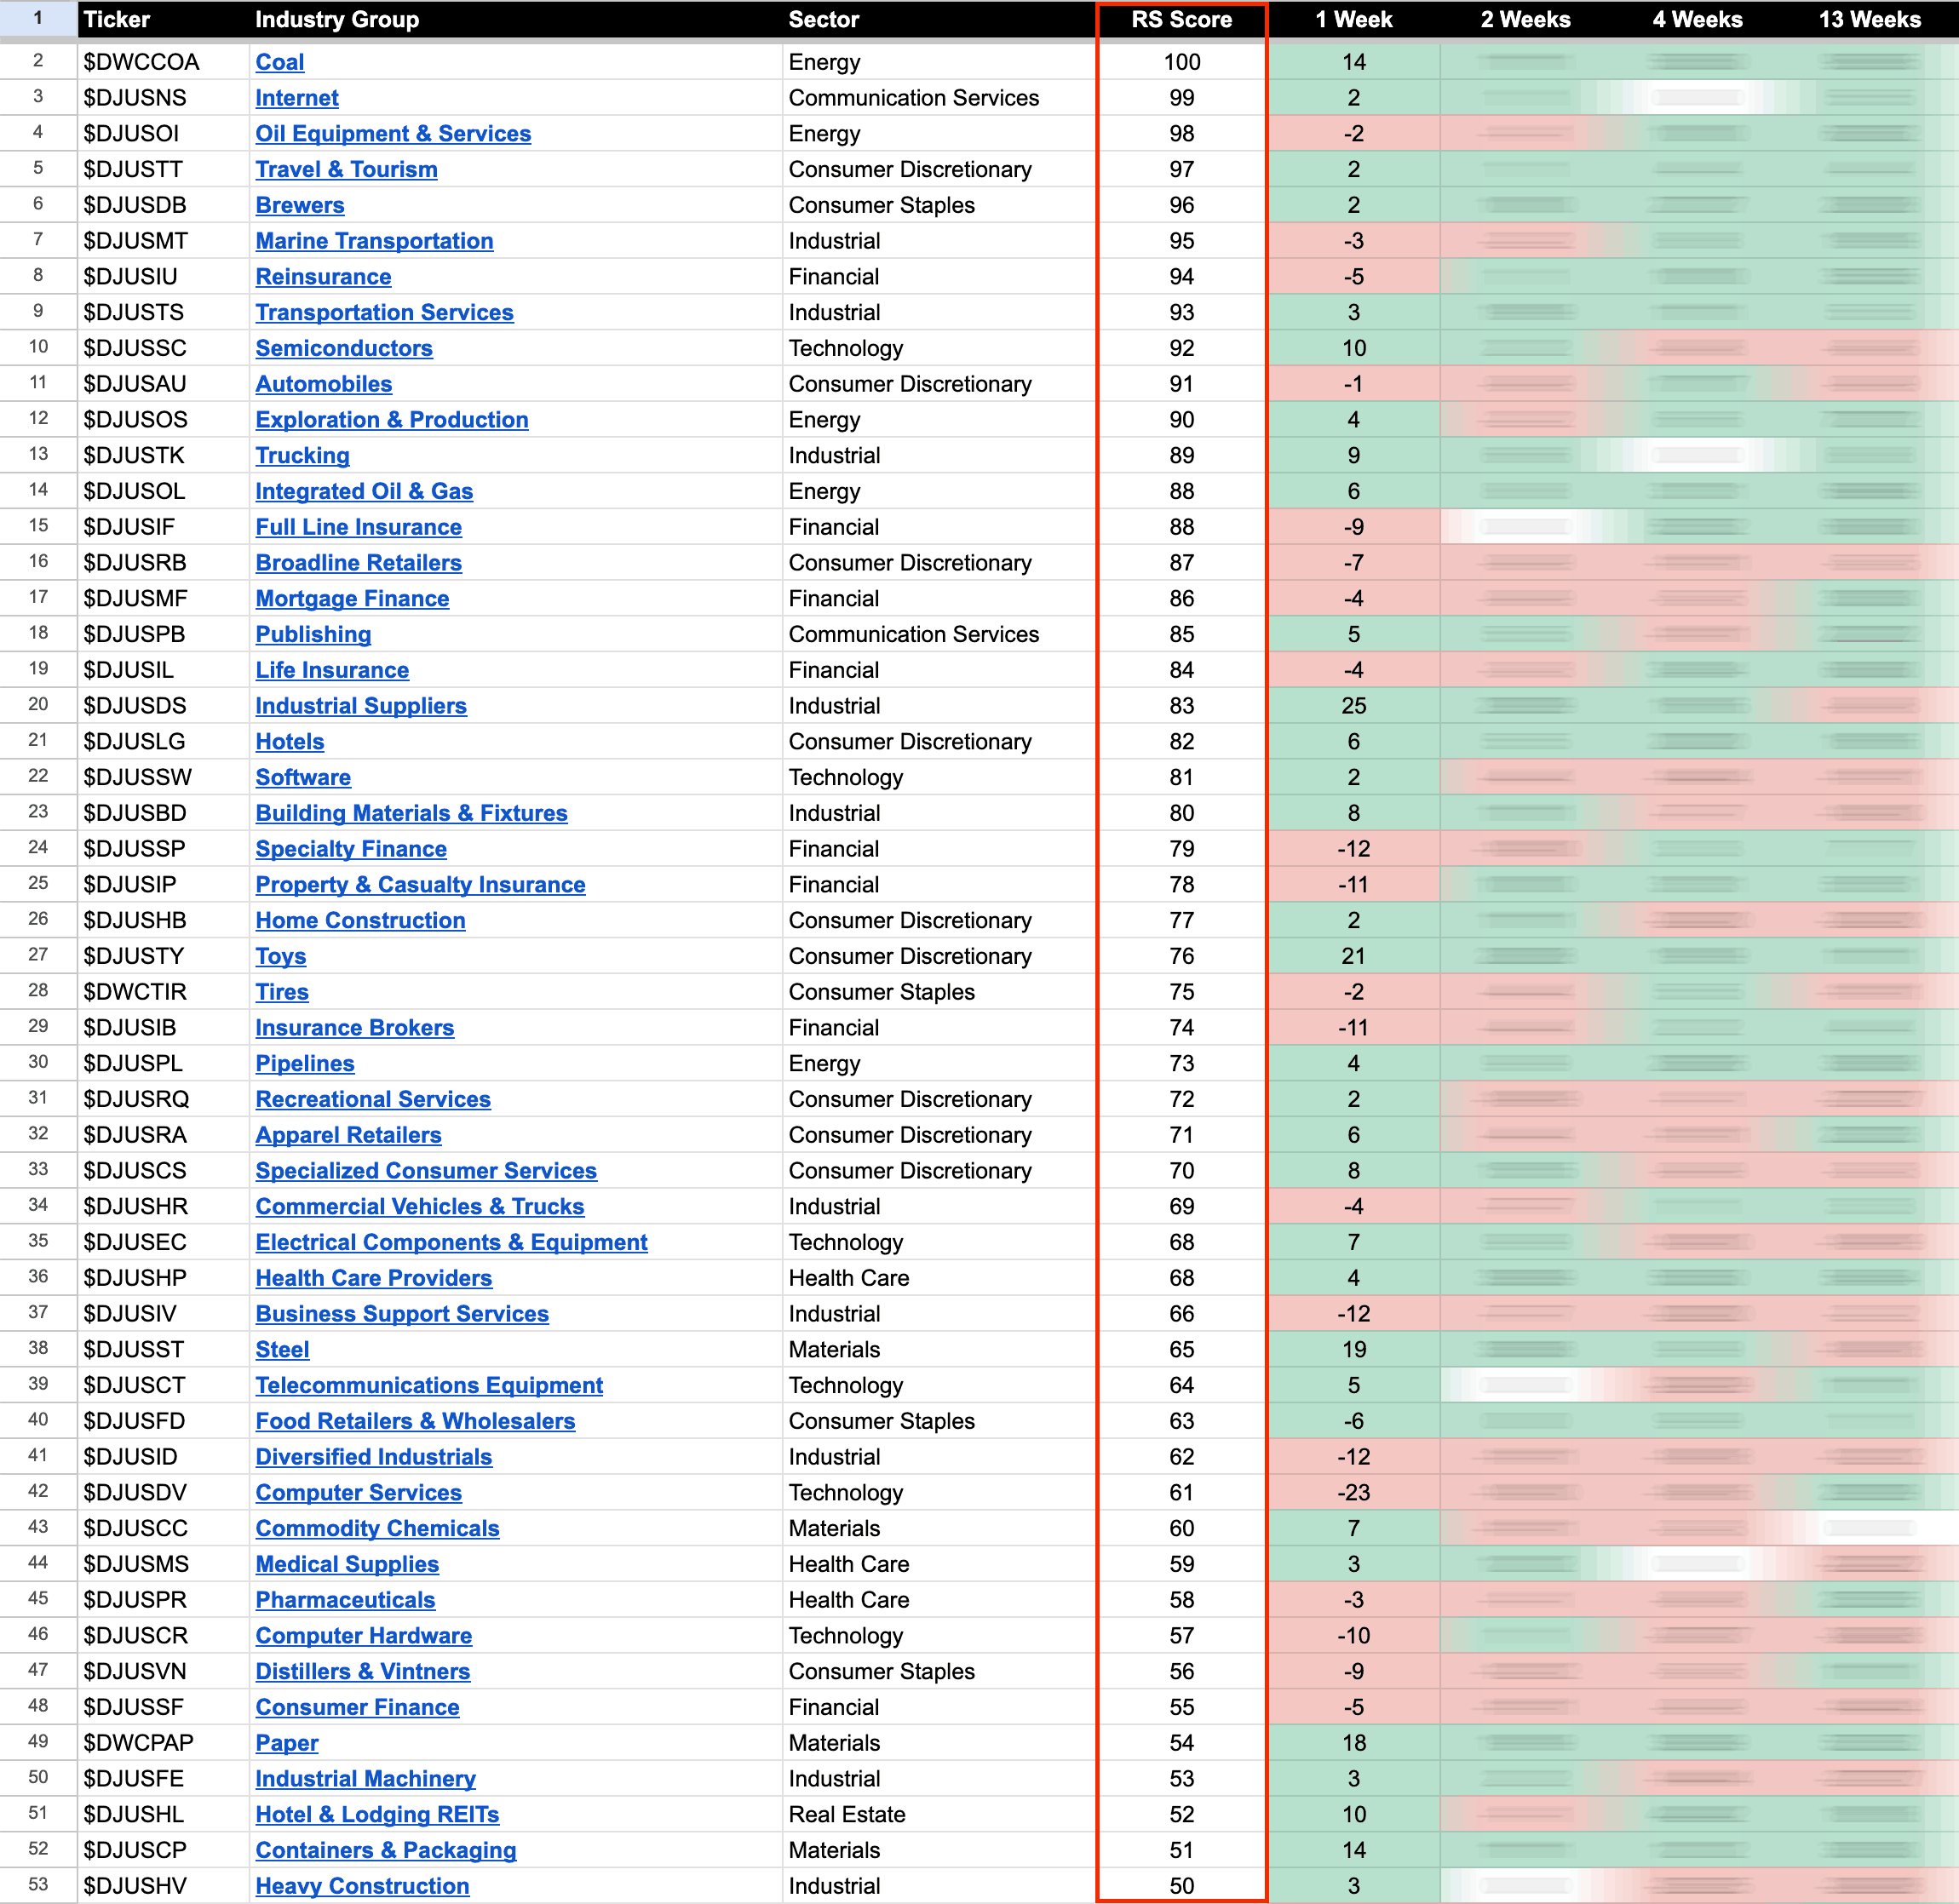
US Industry Groups by Highest RS Score
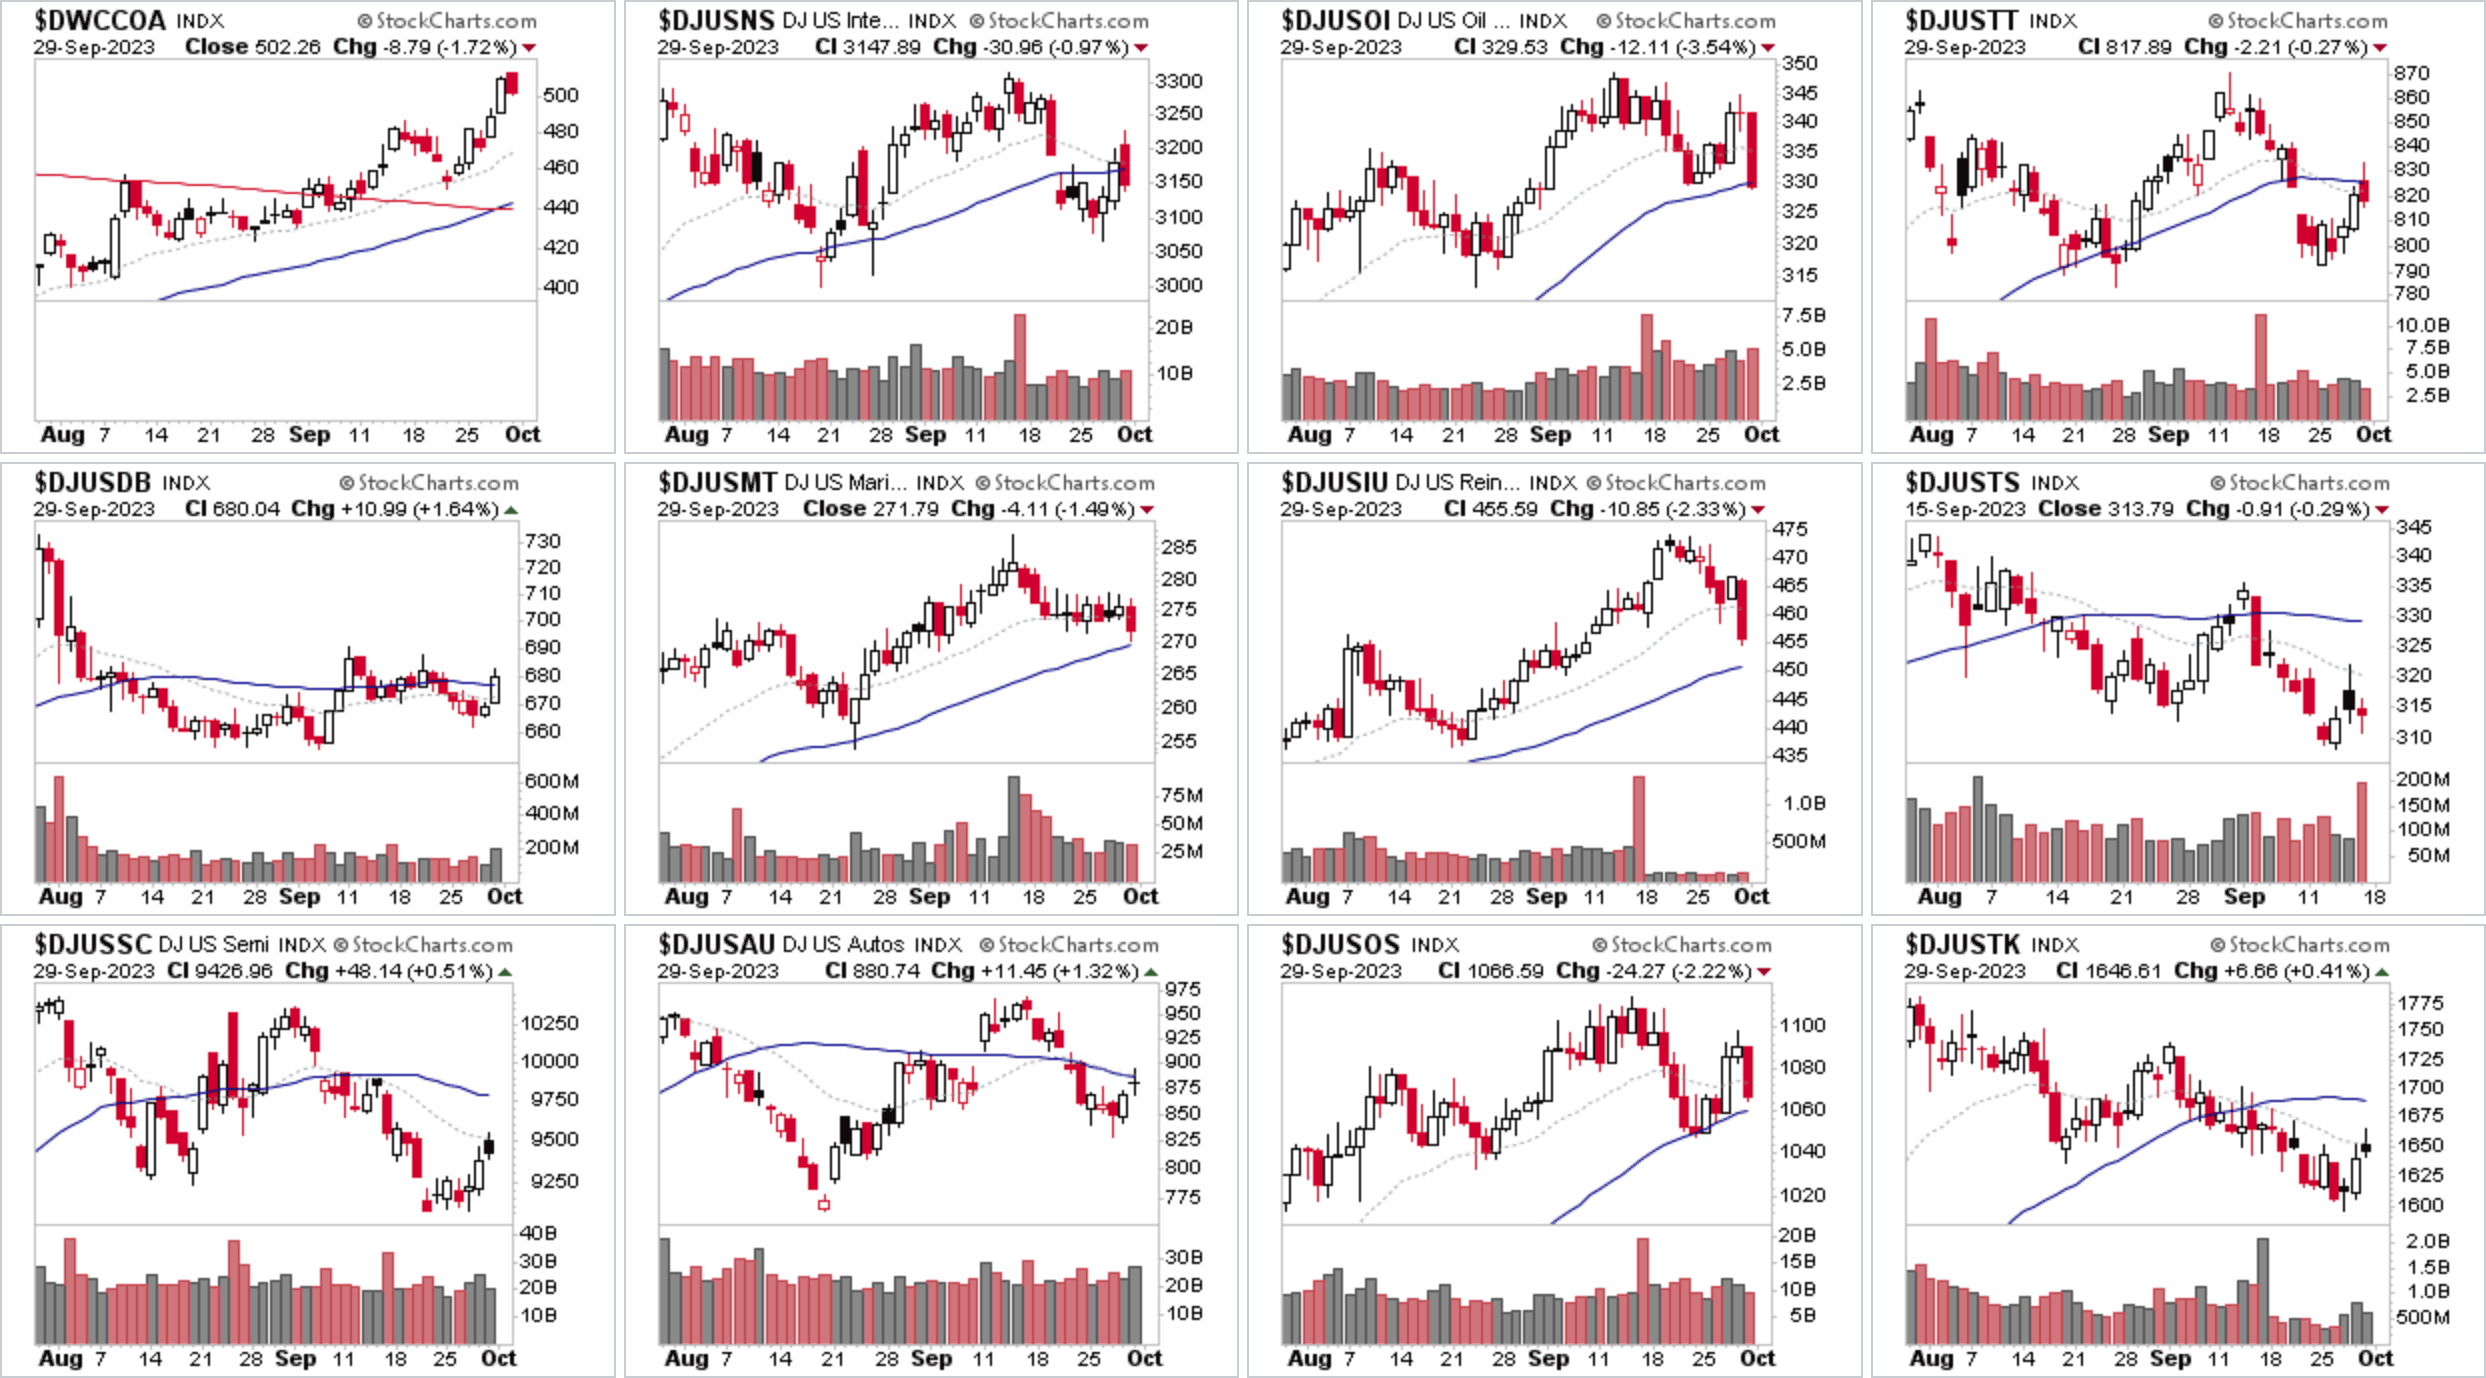
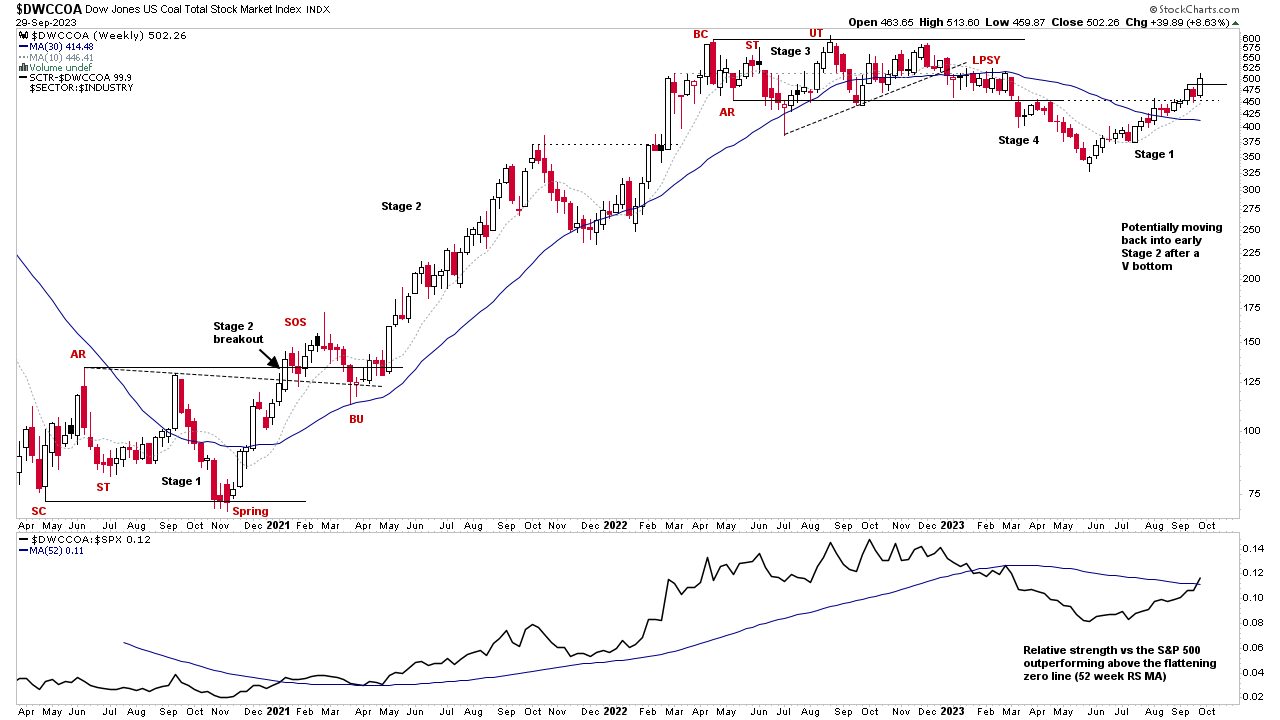
The Coal group ($DWCCOA) rose a further +14 RS places this week, and potentially has moved into early Stage 2, to move to the top of the Industry Groups Relative Strength Rankings table, and has now risen all the way from the bottom position in the RS rankings 15 weeks ago, of which it occupied for seven weeks in a row. Hence, it has been a significant turn around for the group, which was making lower lows in Stage 4 still in May, while the Nasdaq 100 was making new 52 week highs, and highlights the difference between Q2 and Q3. As Q3 has been dominated by the relative strength improvement in the Energy sector groups, while the earlier in the year leaders have pulled back, with some declining into early Stage 3.
However, while the Energy groups have been the Q3 leaders in RS, there was a notable reversal on Friday in the Oil & Gas groups, and so could it be the start of rotation out of that area again and back into previous 2023 leading groups? As they've benefited from the market in correction, and so if the rebound attempt follows through, then money could flow back towards the more speculative areas, earlier 2023 leaders and new group themes. So it will be interesting to see what themes emerge in the watchlist scans in the coming weeks or so and whether we start to see some rotation or not.
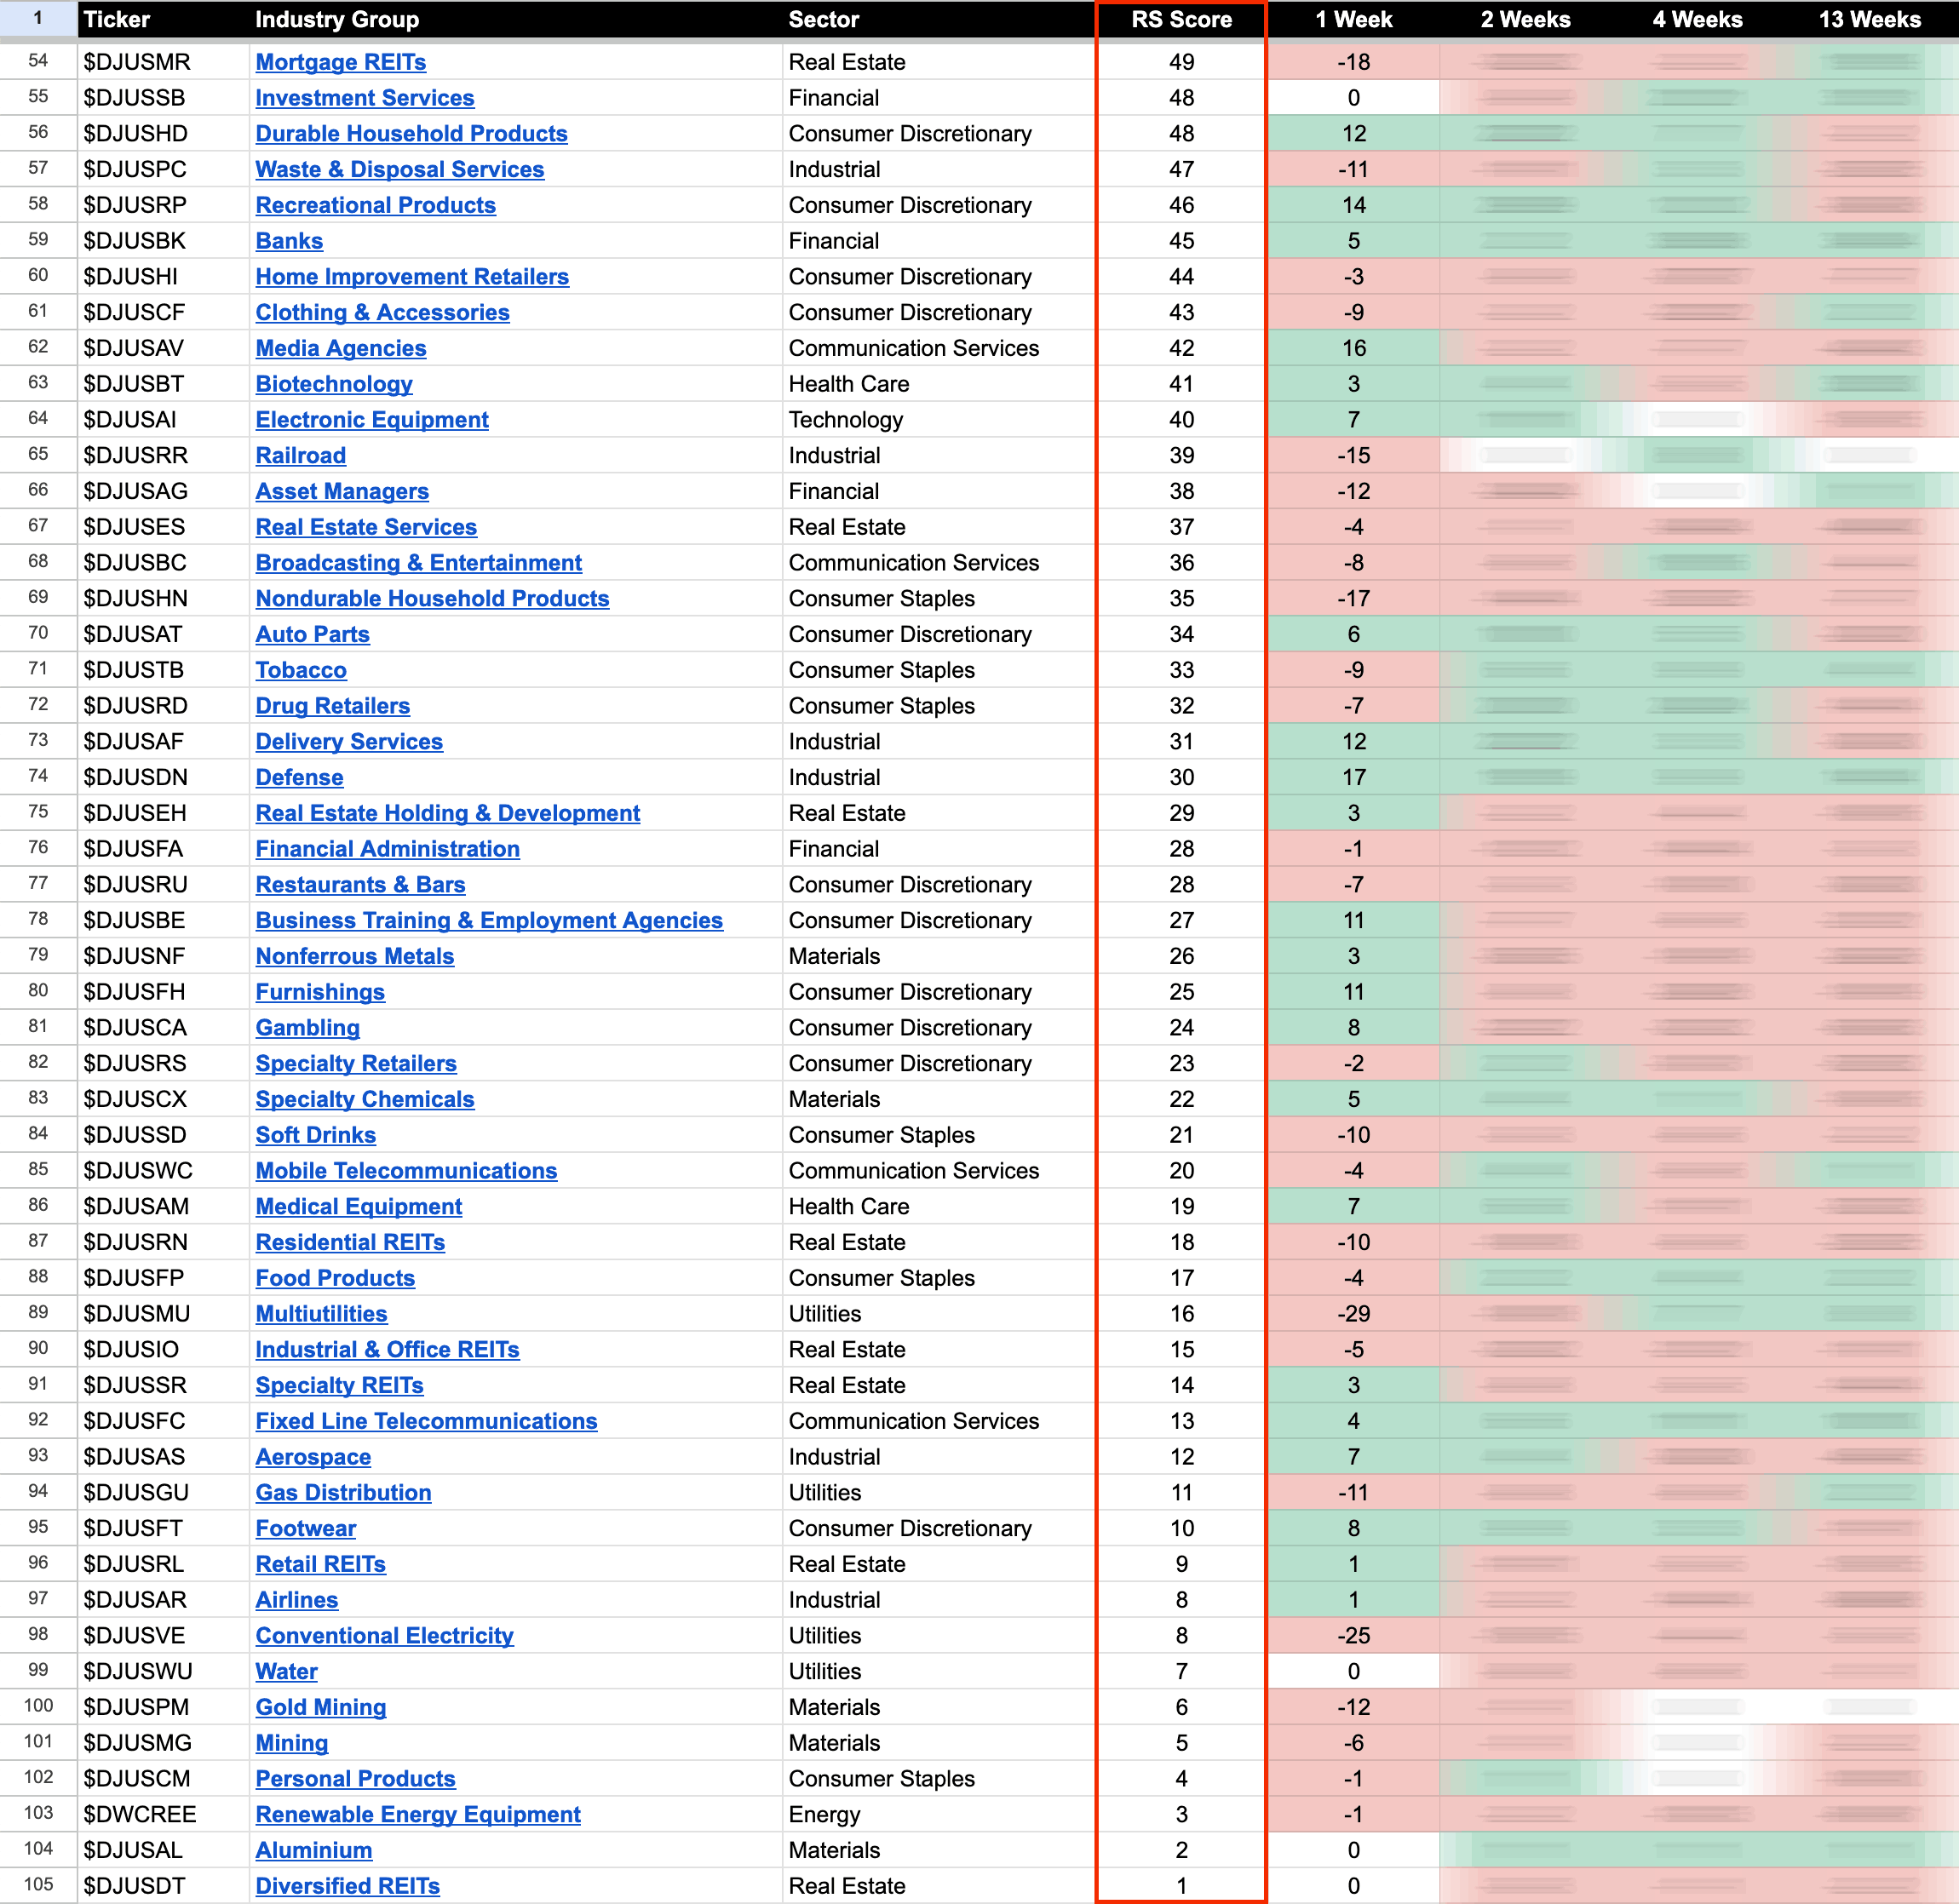
US Industry Groups by Weakest RS Score
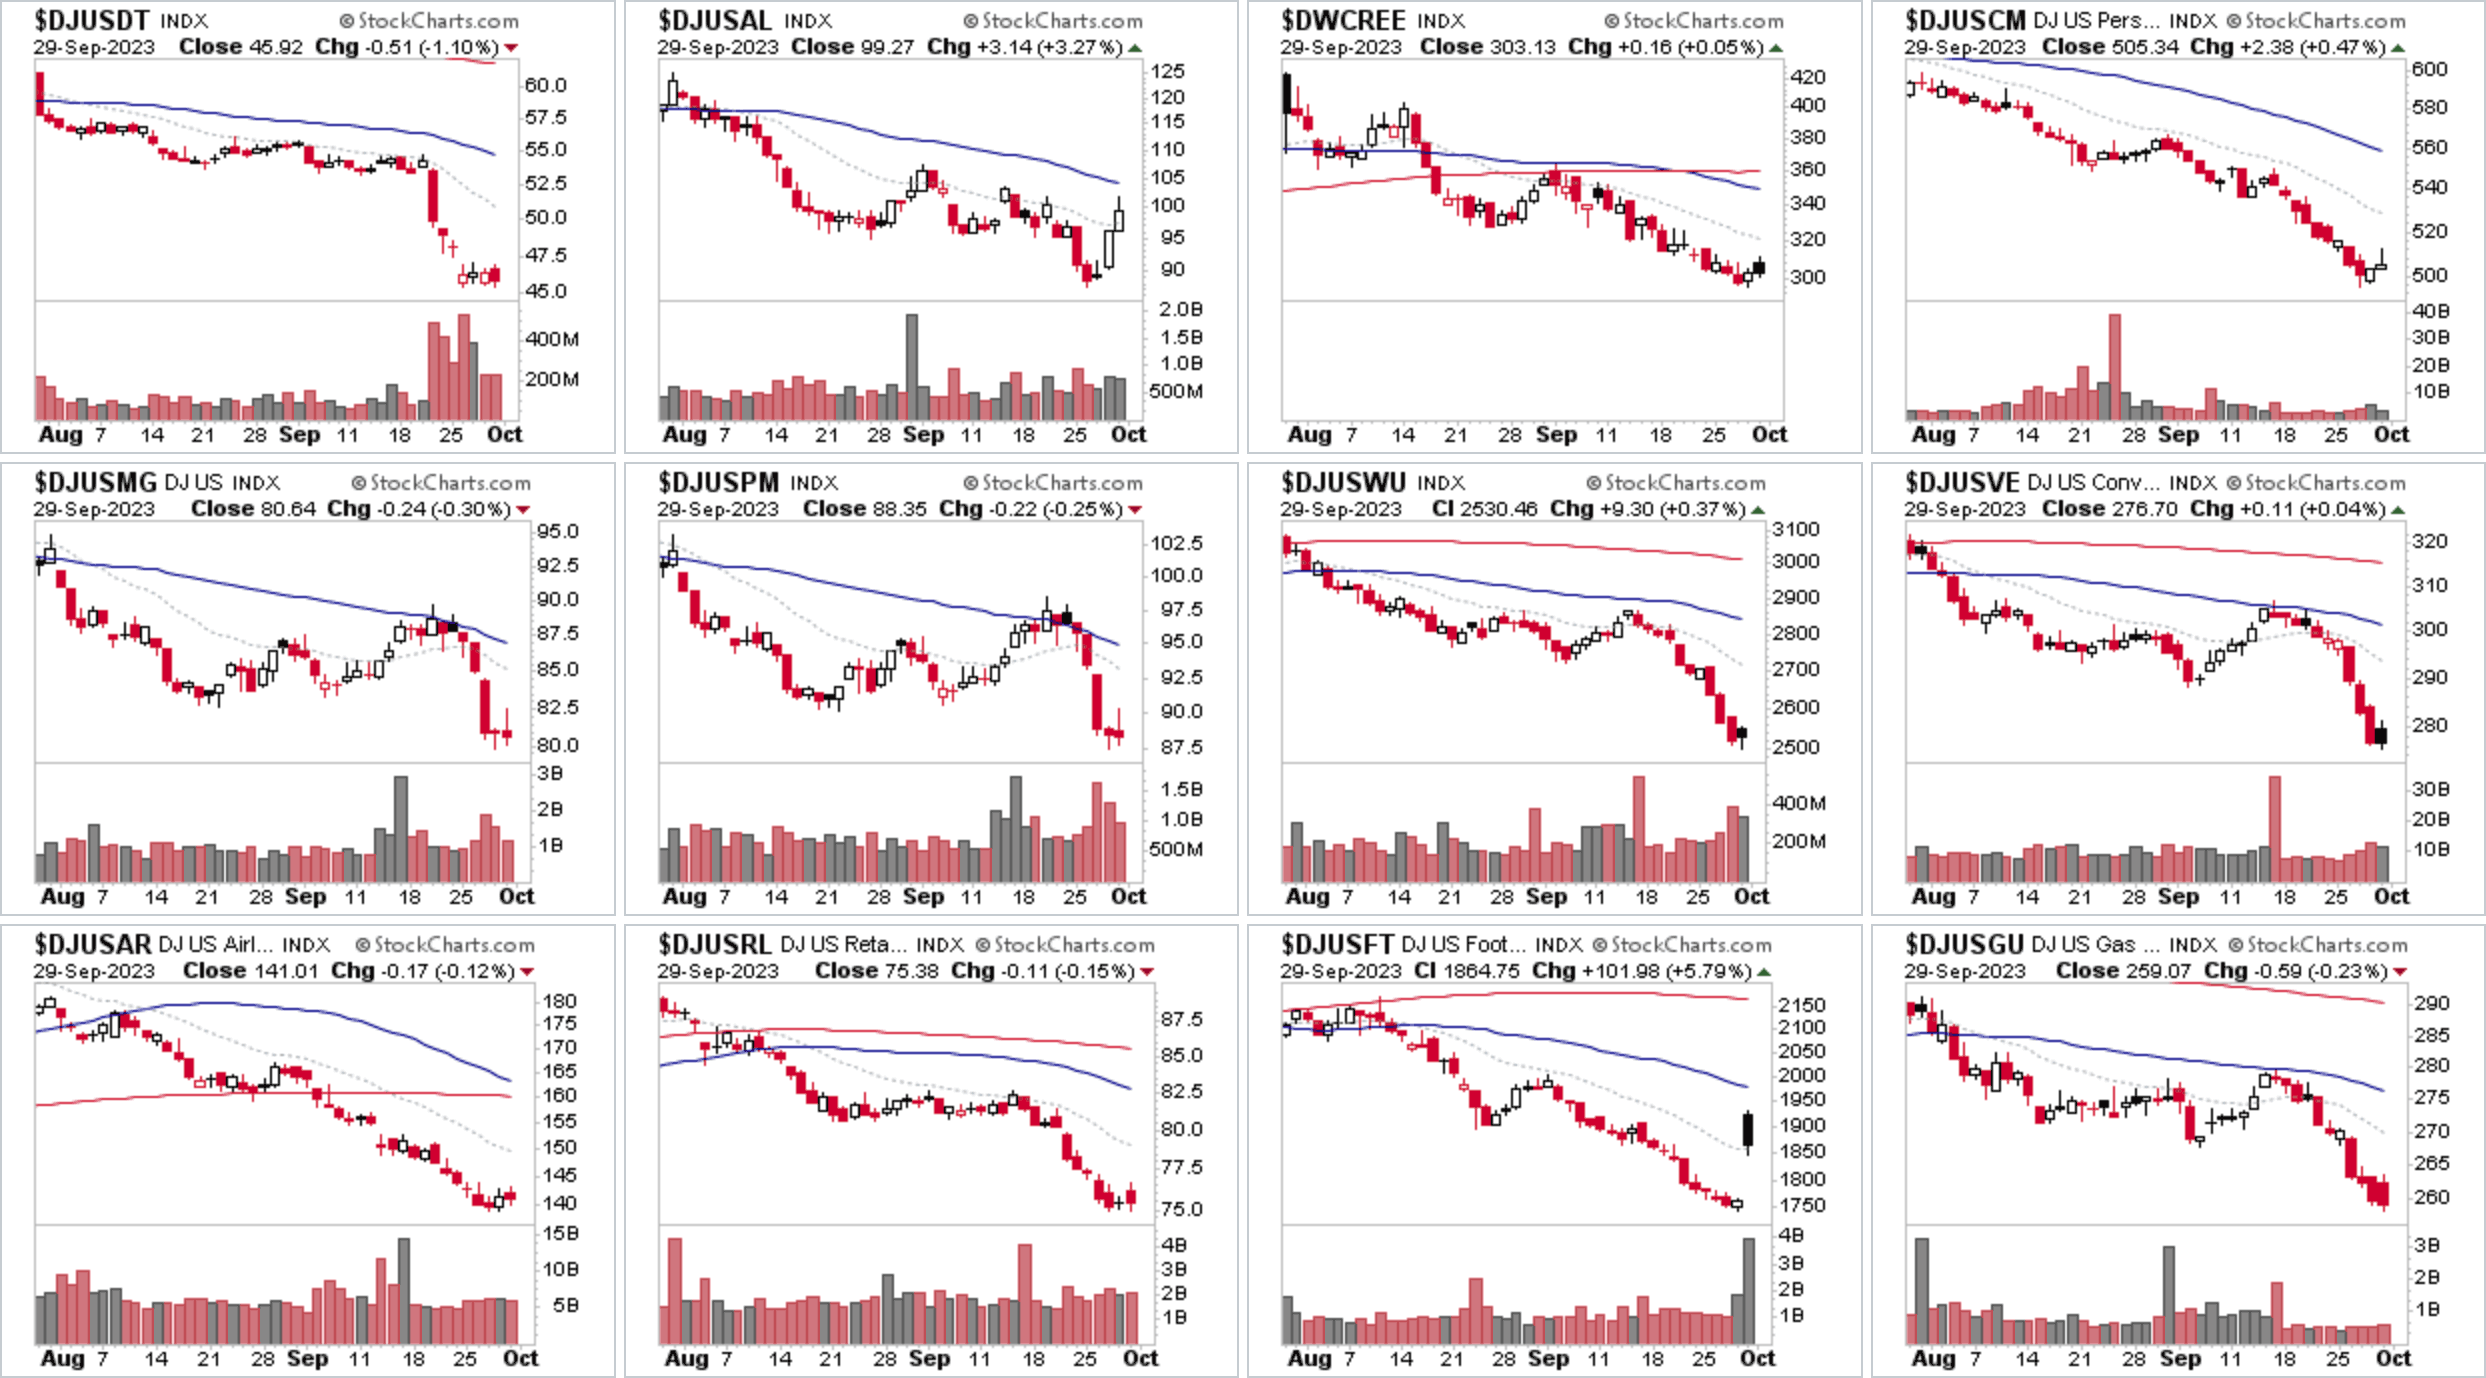
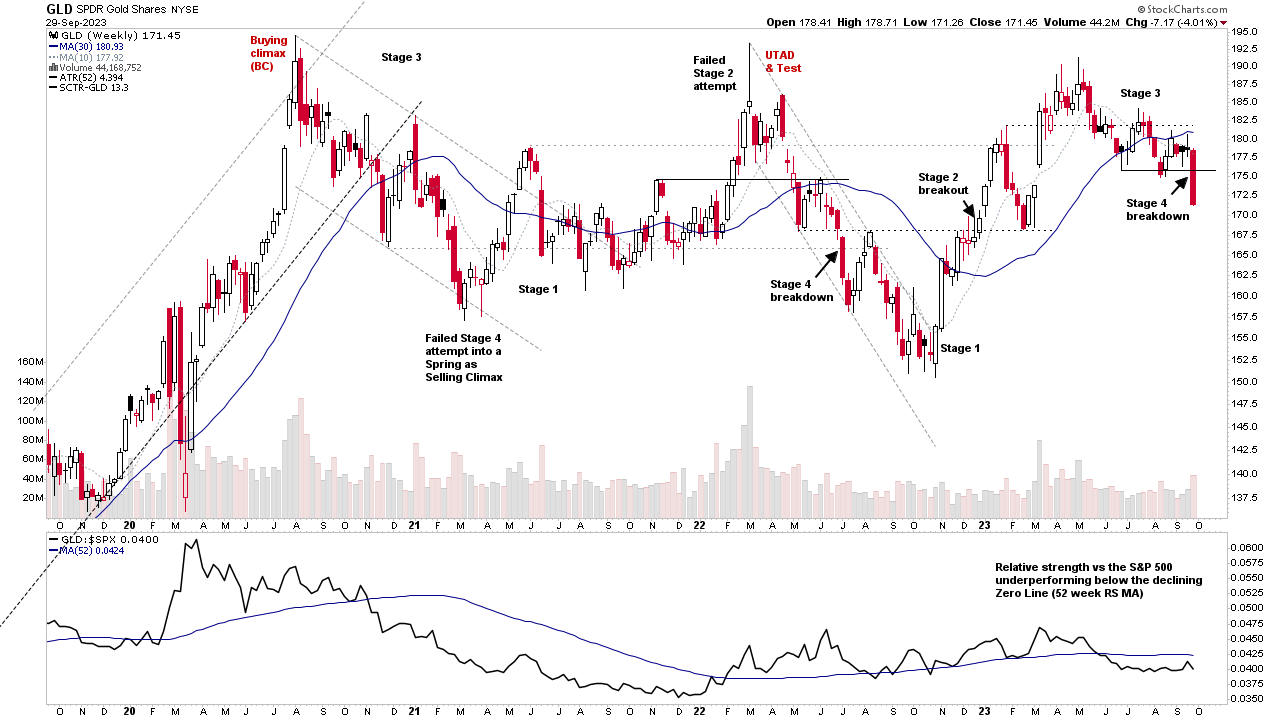
At the bottom of the RS rankings the Gold Mining group ($DJUSPM) is a notable decliner, with -12 RS points this week, taking it to 6th from the bottom. This is due in large part to the Stage 4 breakdown attempt in Gold, which has now gone through all four stages over the last year or so, and continues to be inversely correlated to the strength in the US Dollar, which made a new Stage 2 breakout early in September.
US Industry Groups sorted by Relative Strength
The purpose of the Relative Strength (RS) tables is to track the short, medium and long-term RS changes of the individual groups to find the new leadership earlier than the crowd.
RS Score of 100 is the strongest, and 0 is the weakest.
In the Stage Analysis method we are looking to focus on the strongest groups, as what is strong, tends to stay strong for a long time. But we also want to find the improving / up and coming groups that are starting to rise up strongly through the RS table from the lower zone, in order to find the future leading stocks before they break out from a Stage 1 base and move into a Stage 2 advancing phase.
Each week I go through the most interesting groups on the move in more detail during the Stage Analysis Members weekend video – as Industry Group analysis is a key part of Stan Weinstein's Stage Analysis method.
Become a Stage Analysis Member:
To see more like this – US Stocks watchlist posts, detailed videos each weekend, use our unique Stage Analysis tools, such as the US Stocks & ETFs Screener, Charts, Market Breadth, Group Relative Strength and more...
Join Today
Disclaimer: For educational purpose only. Not investment advice. Seek professional advice from a financial advisor before making any investing decisions.