
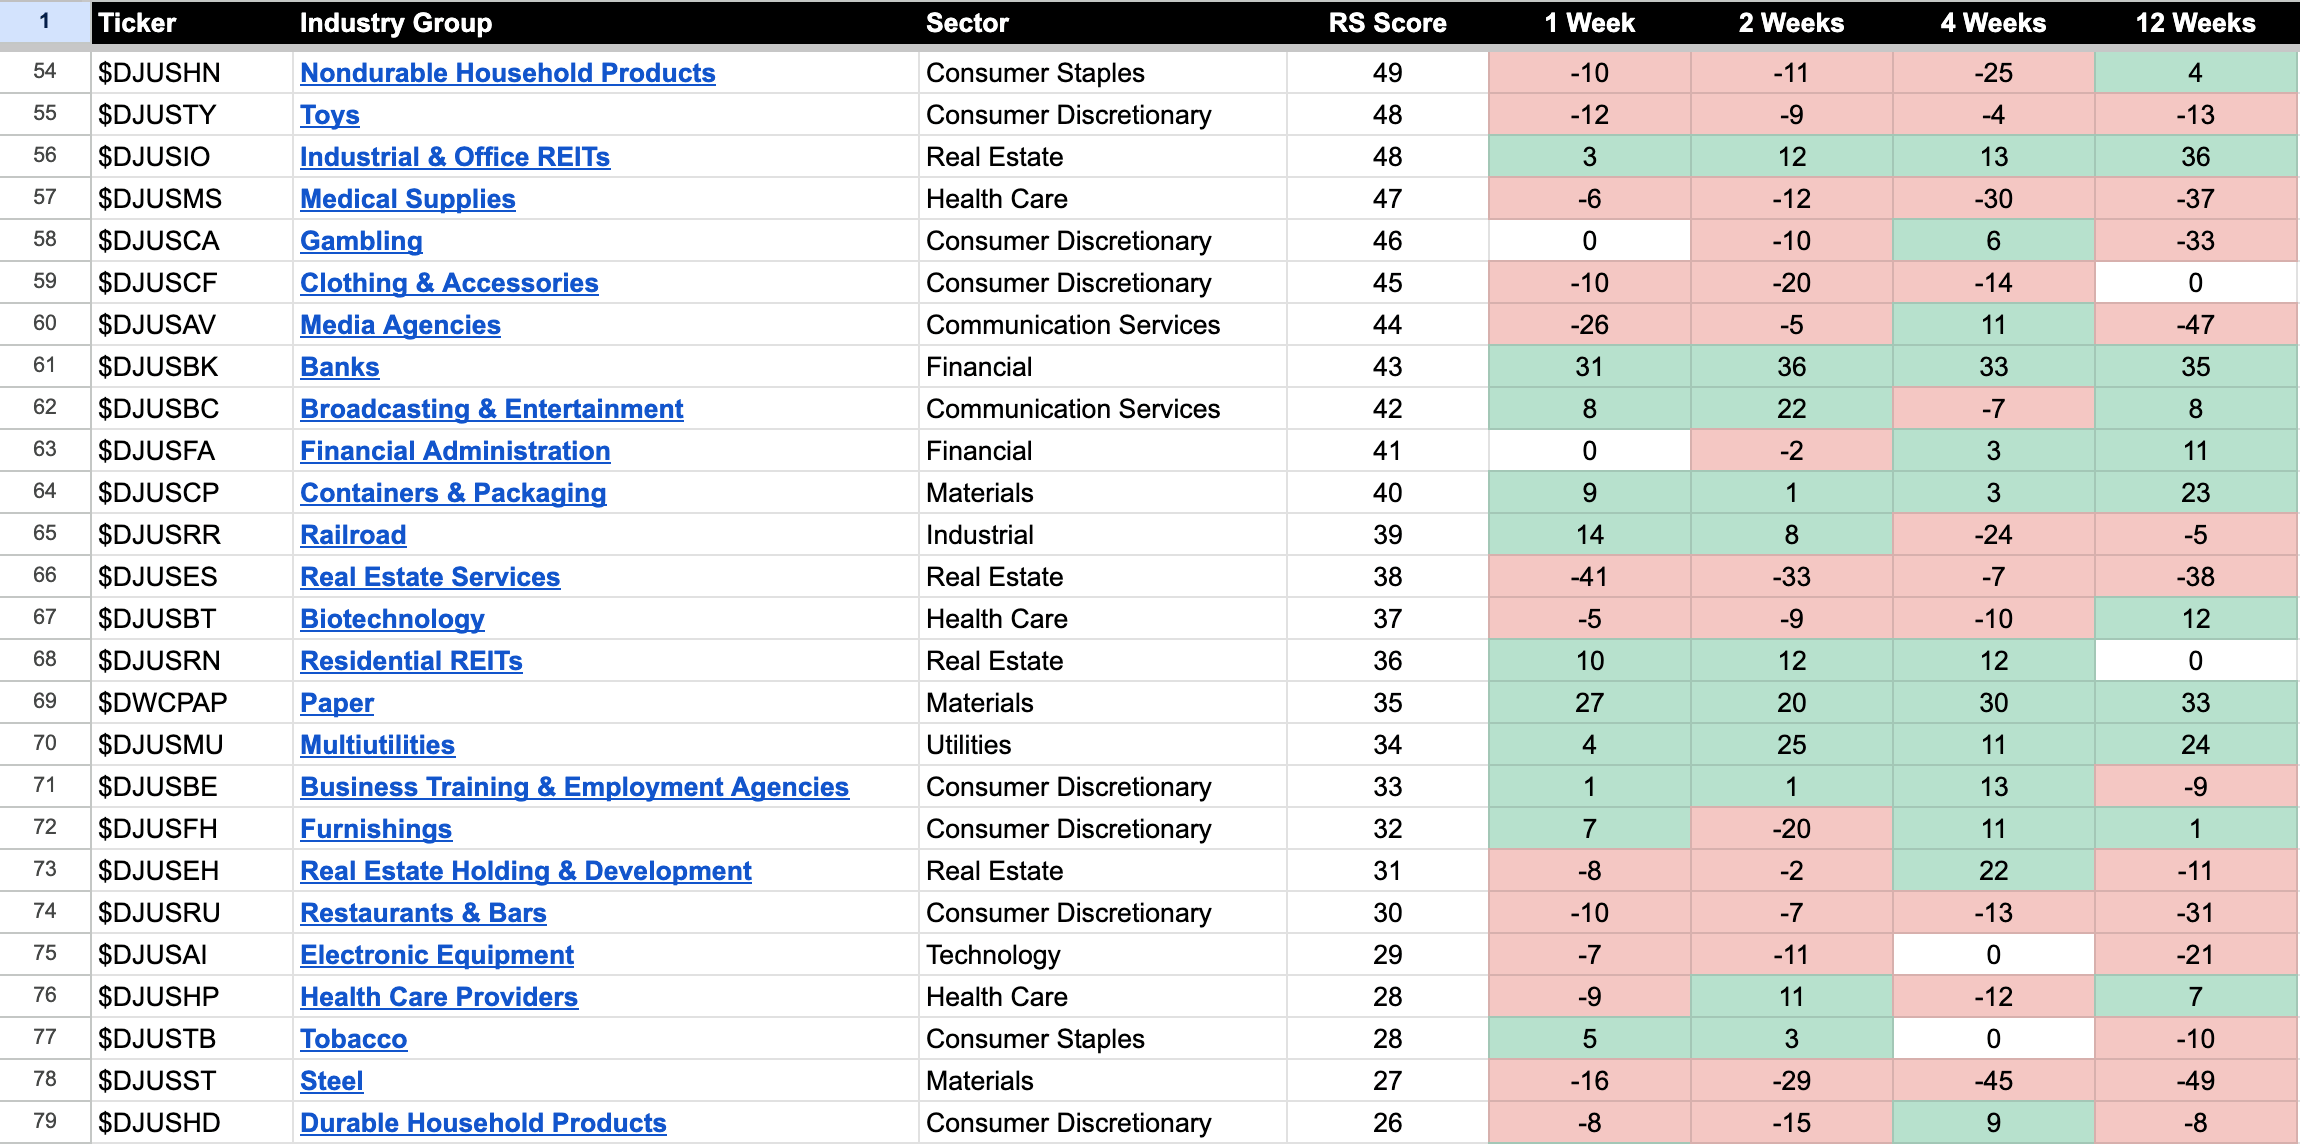
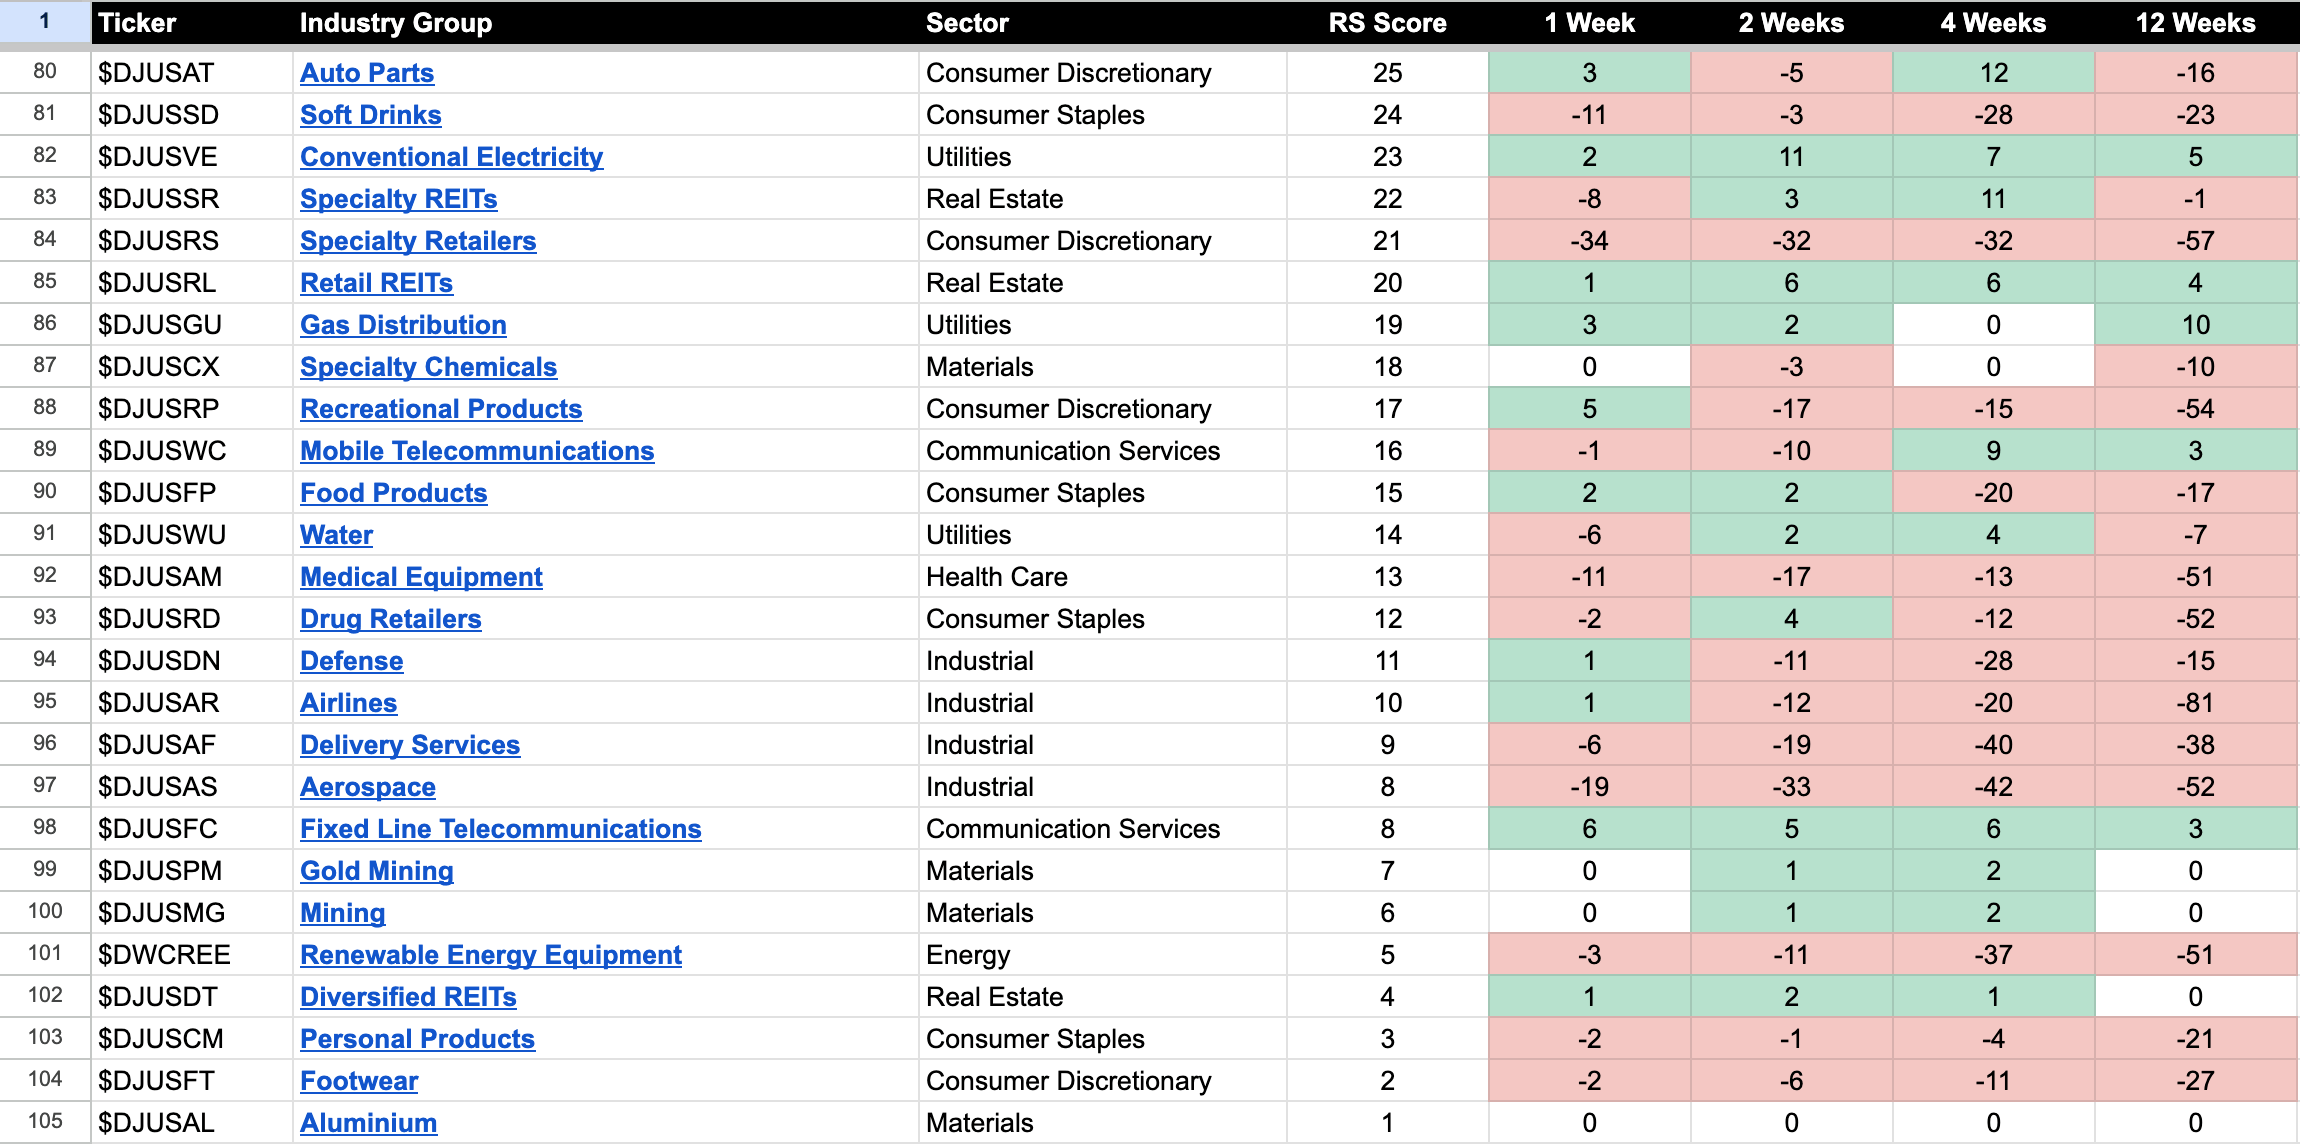
US Stocks Industry Groups Relative Strength Rankings
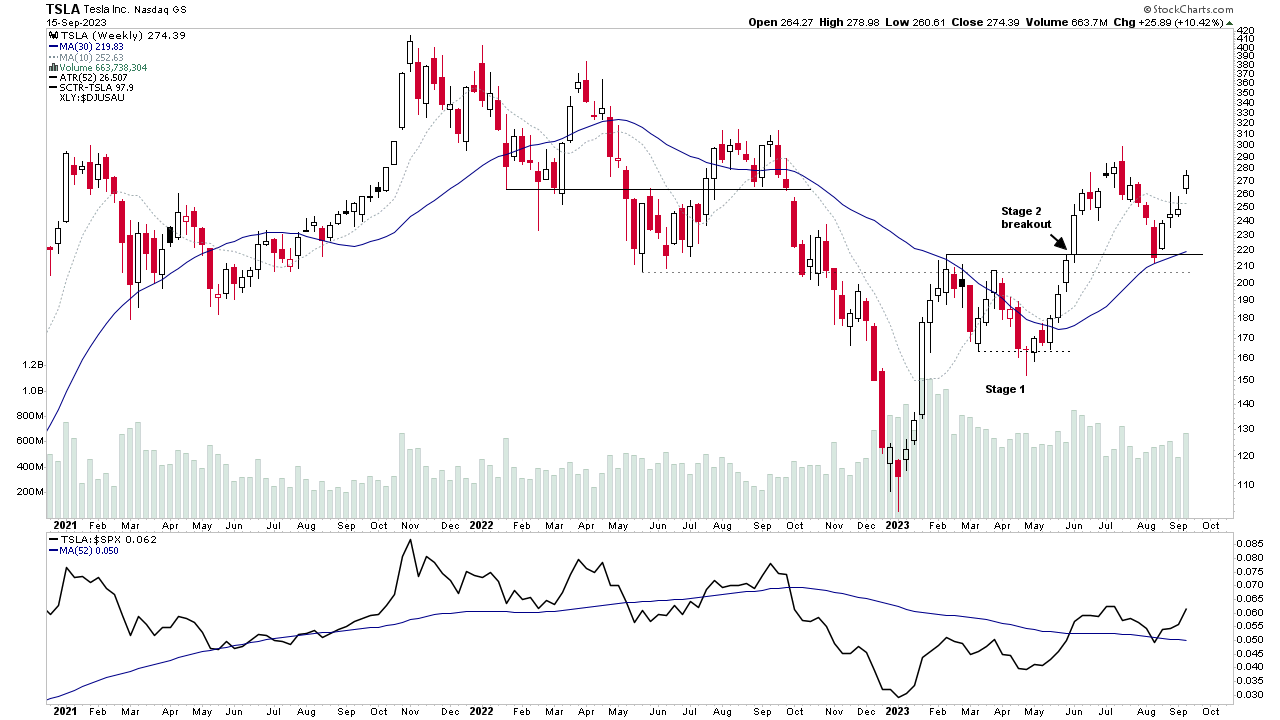
The Automobiles group has risen back to the top of the US Industry Groups RS Rankings this week, and it is largely due to the 10.42% gain in TSLA, which has put it strongly back above its 50-day MA, as it develops in early Stage 2 still.
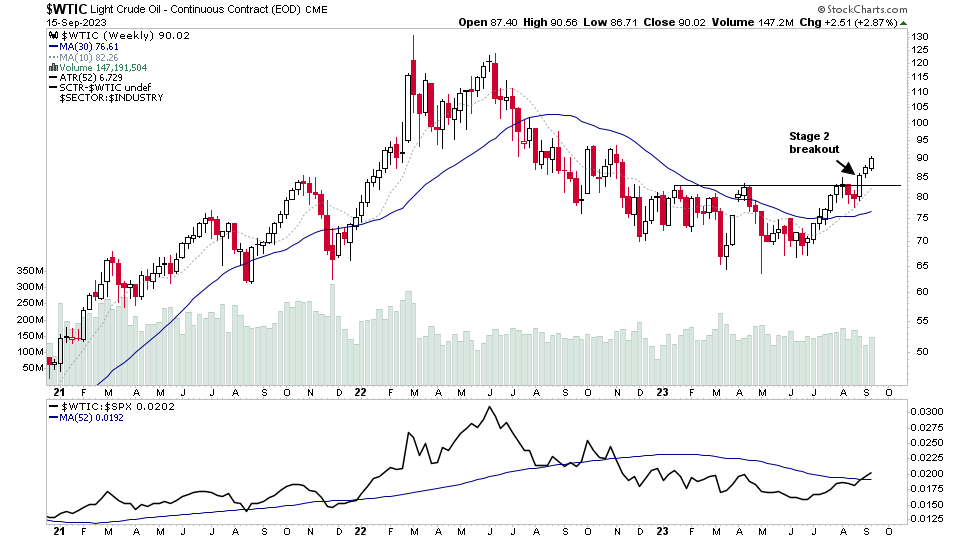
The Energy sector groups also continue to feature strongly, with Coal rising a further +38 RS points to 12th overall, and two of the Oil groups in the top 10, with Oil Equipment & Services up a further +4 RS points to 2nd overall, and Exploration & Production up to 9th overall. Which, has all been led by Crude Oil moving into Stage 2 in the last three weeks.
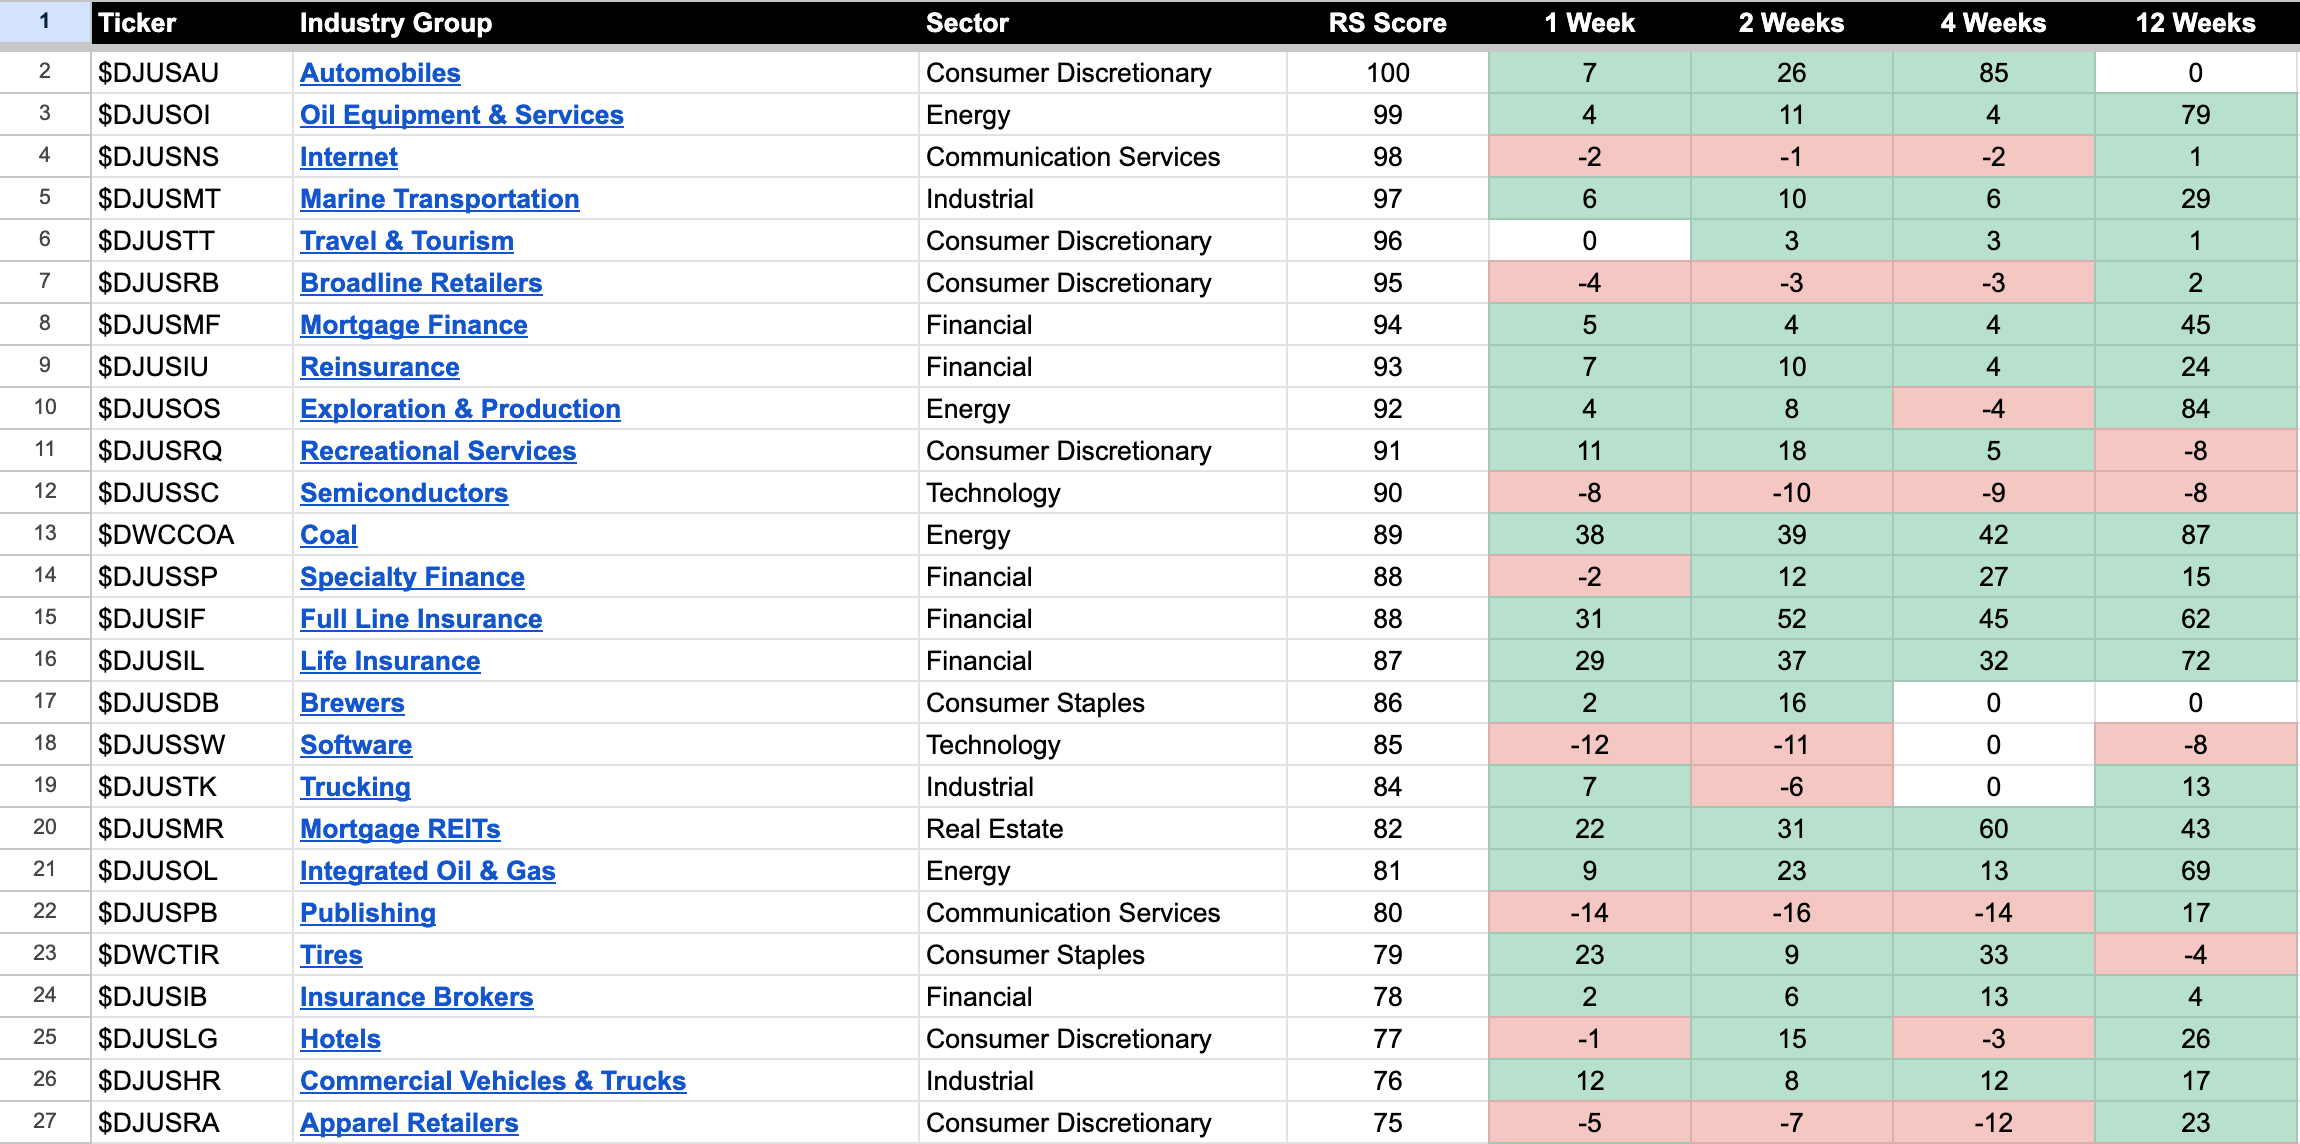
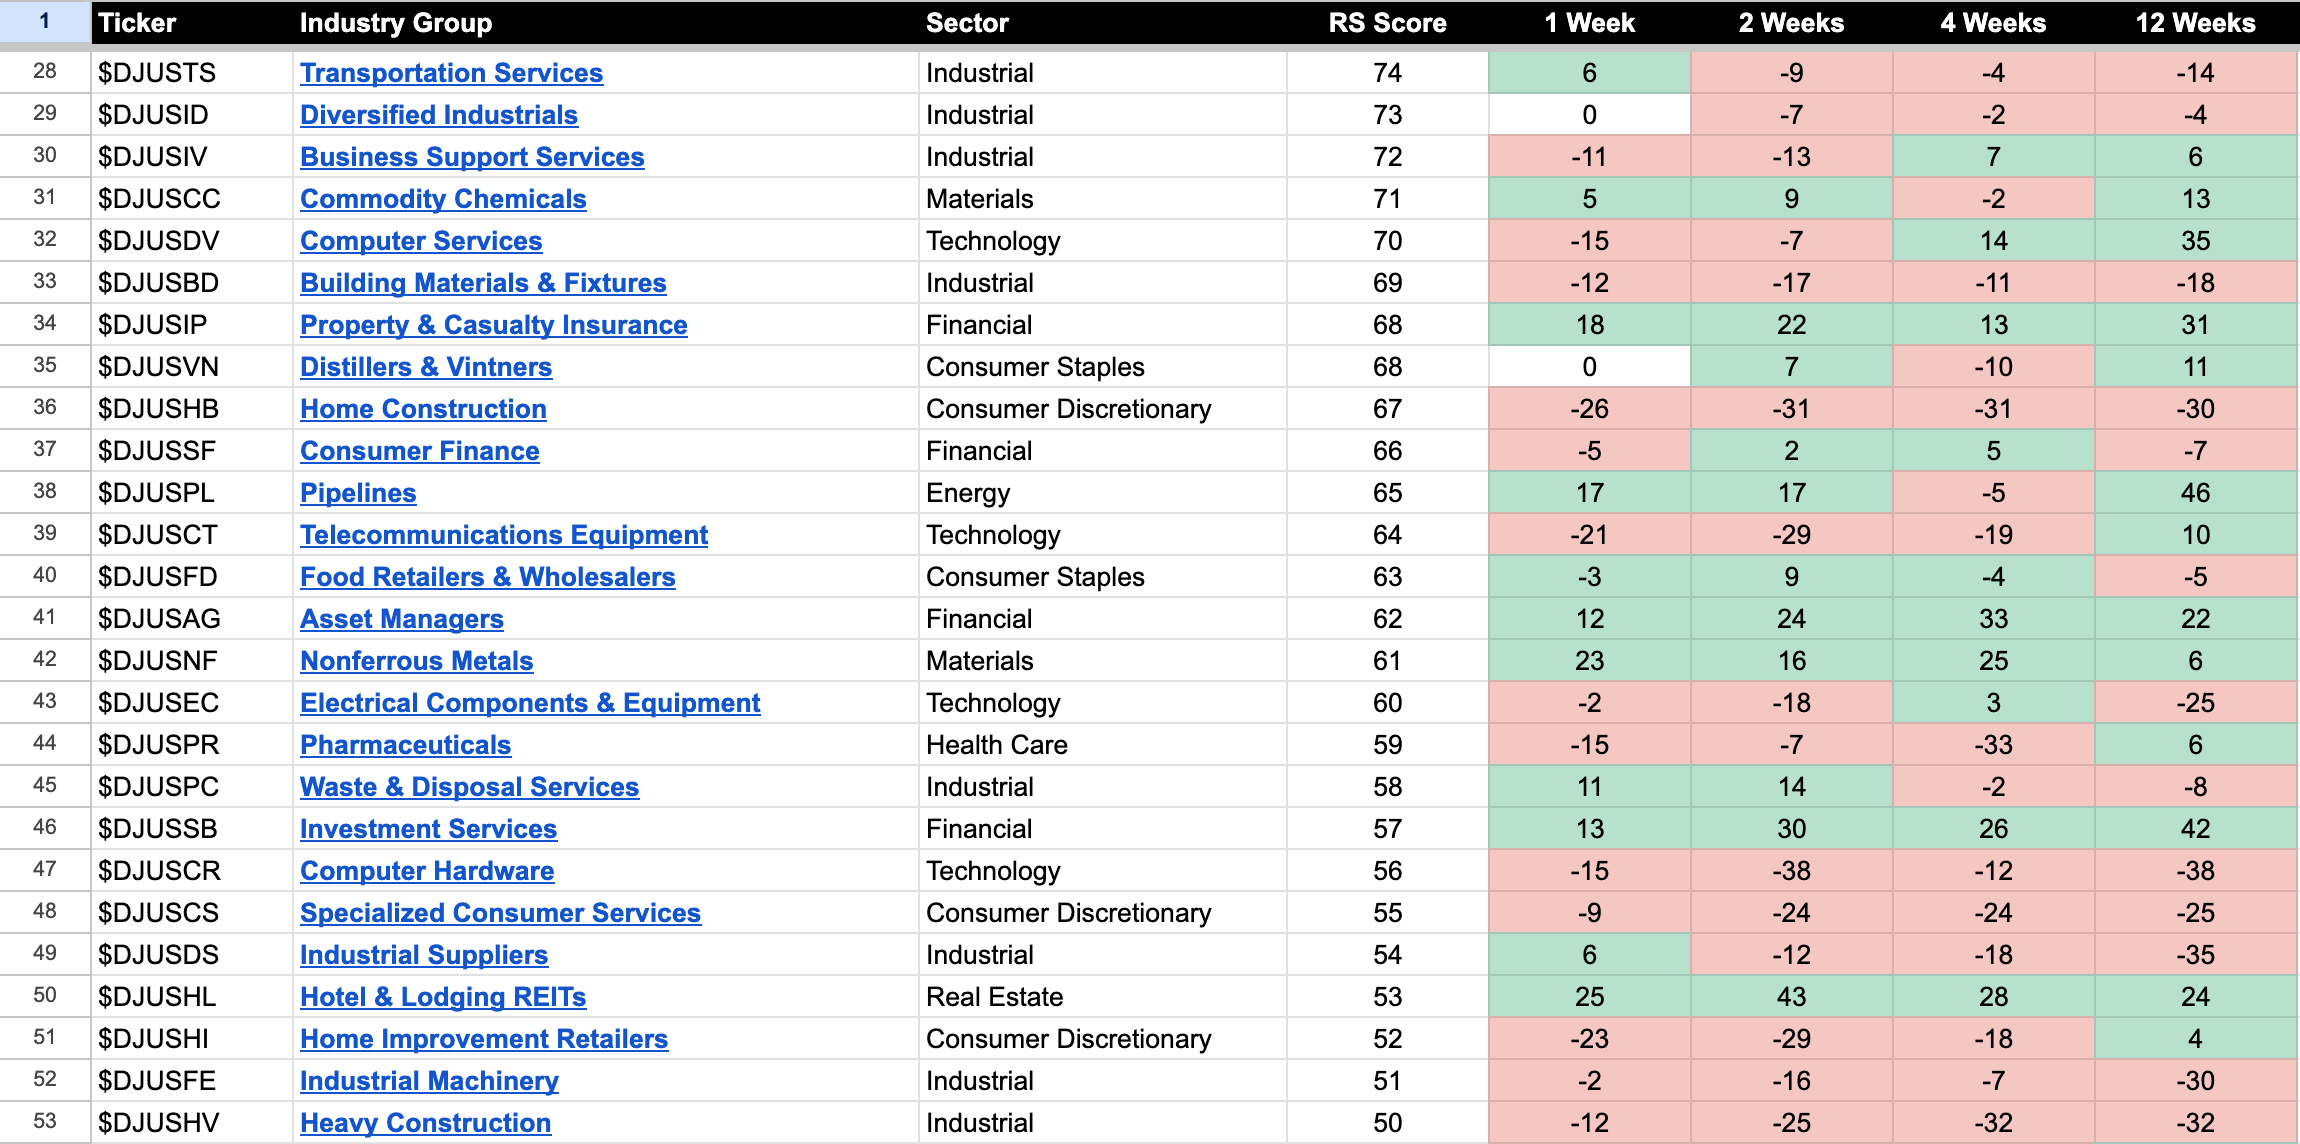
US Industry Groups sorted by Relative Strength
The purpose of the Relative Strength (RS) tables is to track the short, medium and long-term RS changes of the individual groups to find the new leadership earlier than the crowd.
RS Score of 100 is the strongest, and 0 is the weakest.
In the Stage Analysis method we are looking to focus on the strongest groups, as what is strong, tends to stay strong for a long time. But we also want to find the improving / up and coming groups that are starting to rise up strongly through the RS table from the lower zone, in order to find the future leading stocks before they break out from a Stage 1 base and move into a Stage 2 advancing phase.
Each week I go through the most interesting groups on the move in more detail during the Stage Analysis Members weekend video – as Industry Group analysis is a key part of Stan Weinstein's Stage Analysis method.
You can find out which stocks are in each industry group by going to https://stockcharts.com/freech... and clicking on the name of the group.
Note: A shortened post this week as I'm travelling until Tuesday. But the normal posts will resume from then.
Disclaimer: For educational purpose only. Not investment advice. Seek professional advice from a financial advisor before making any investing decisions.