
US Stockmarket Weekend Update - 23 January 2022
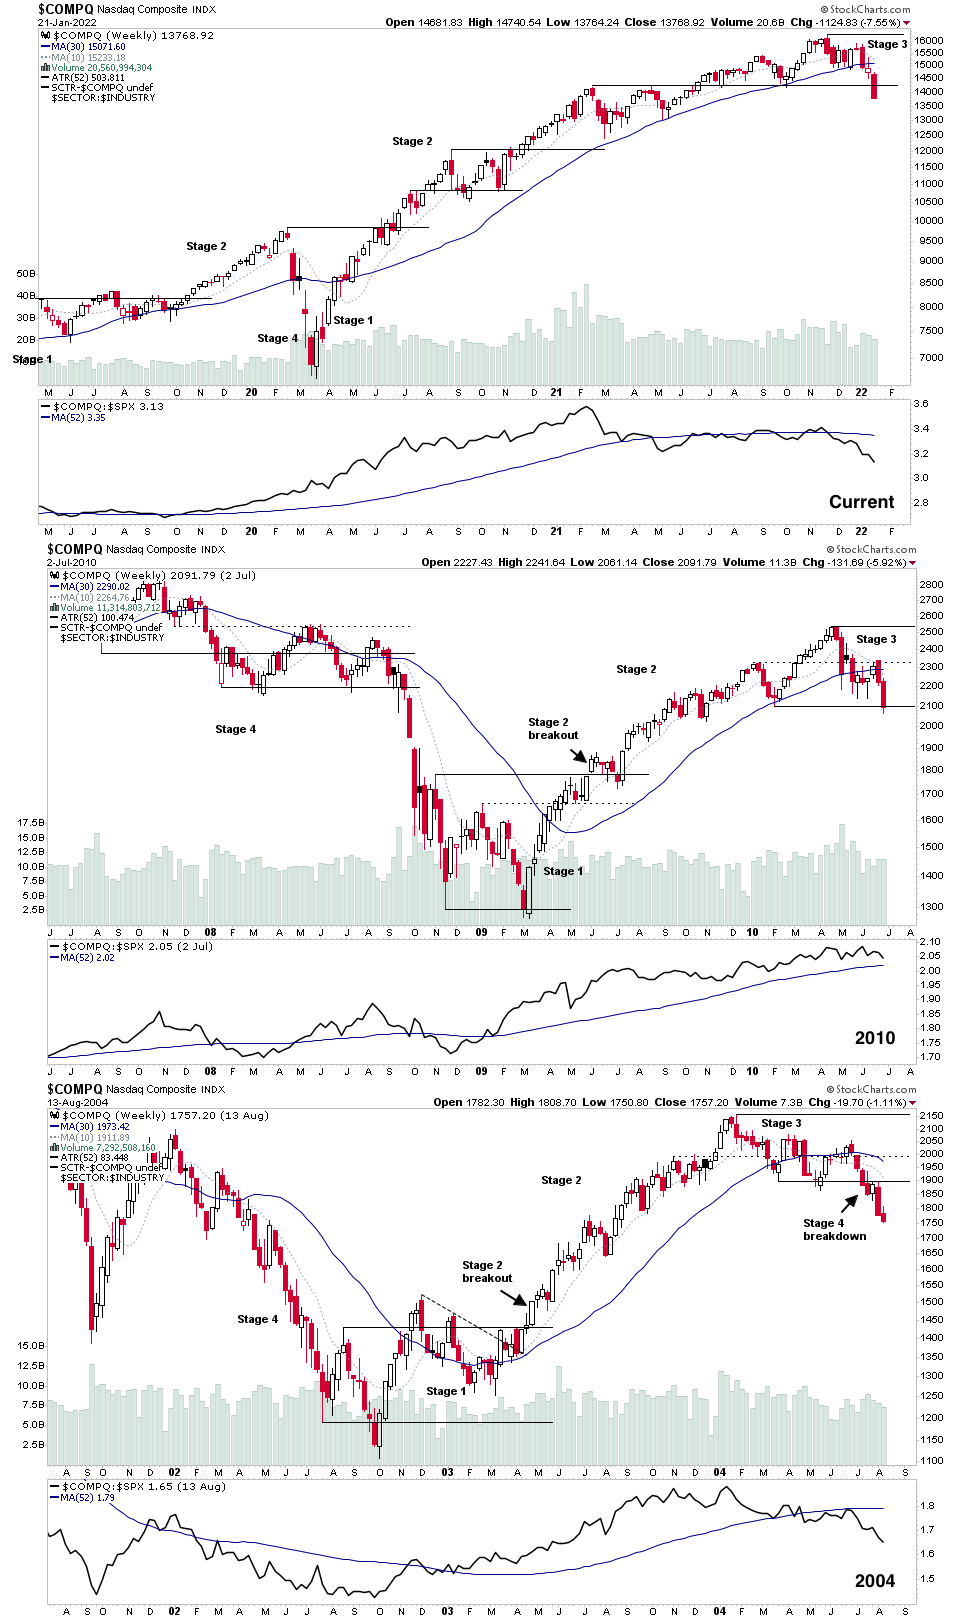
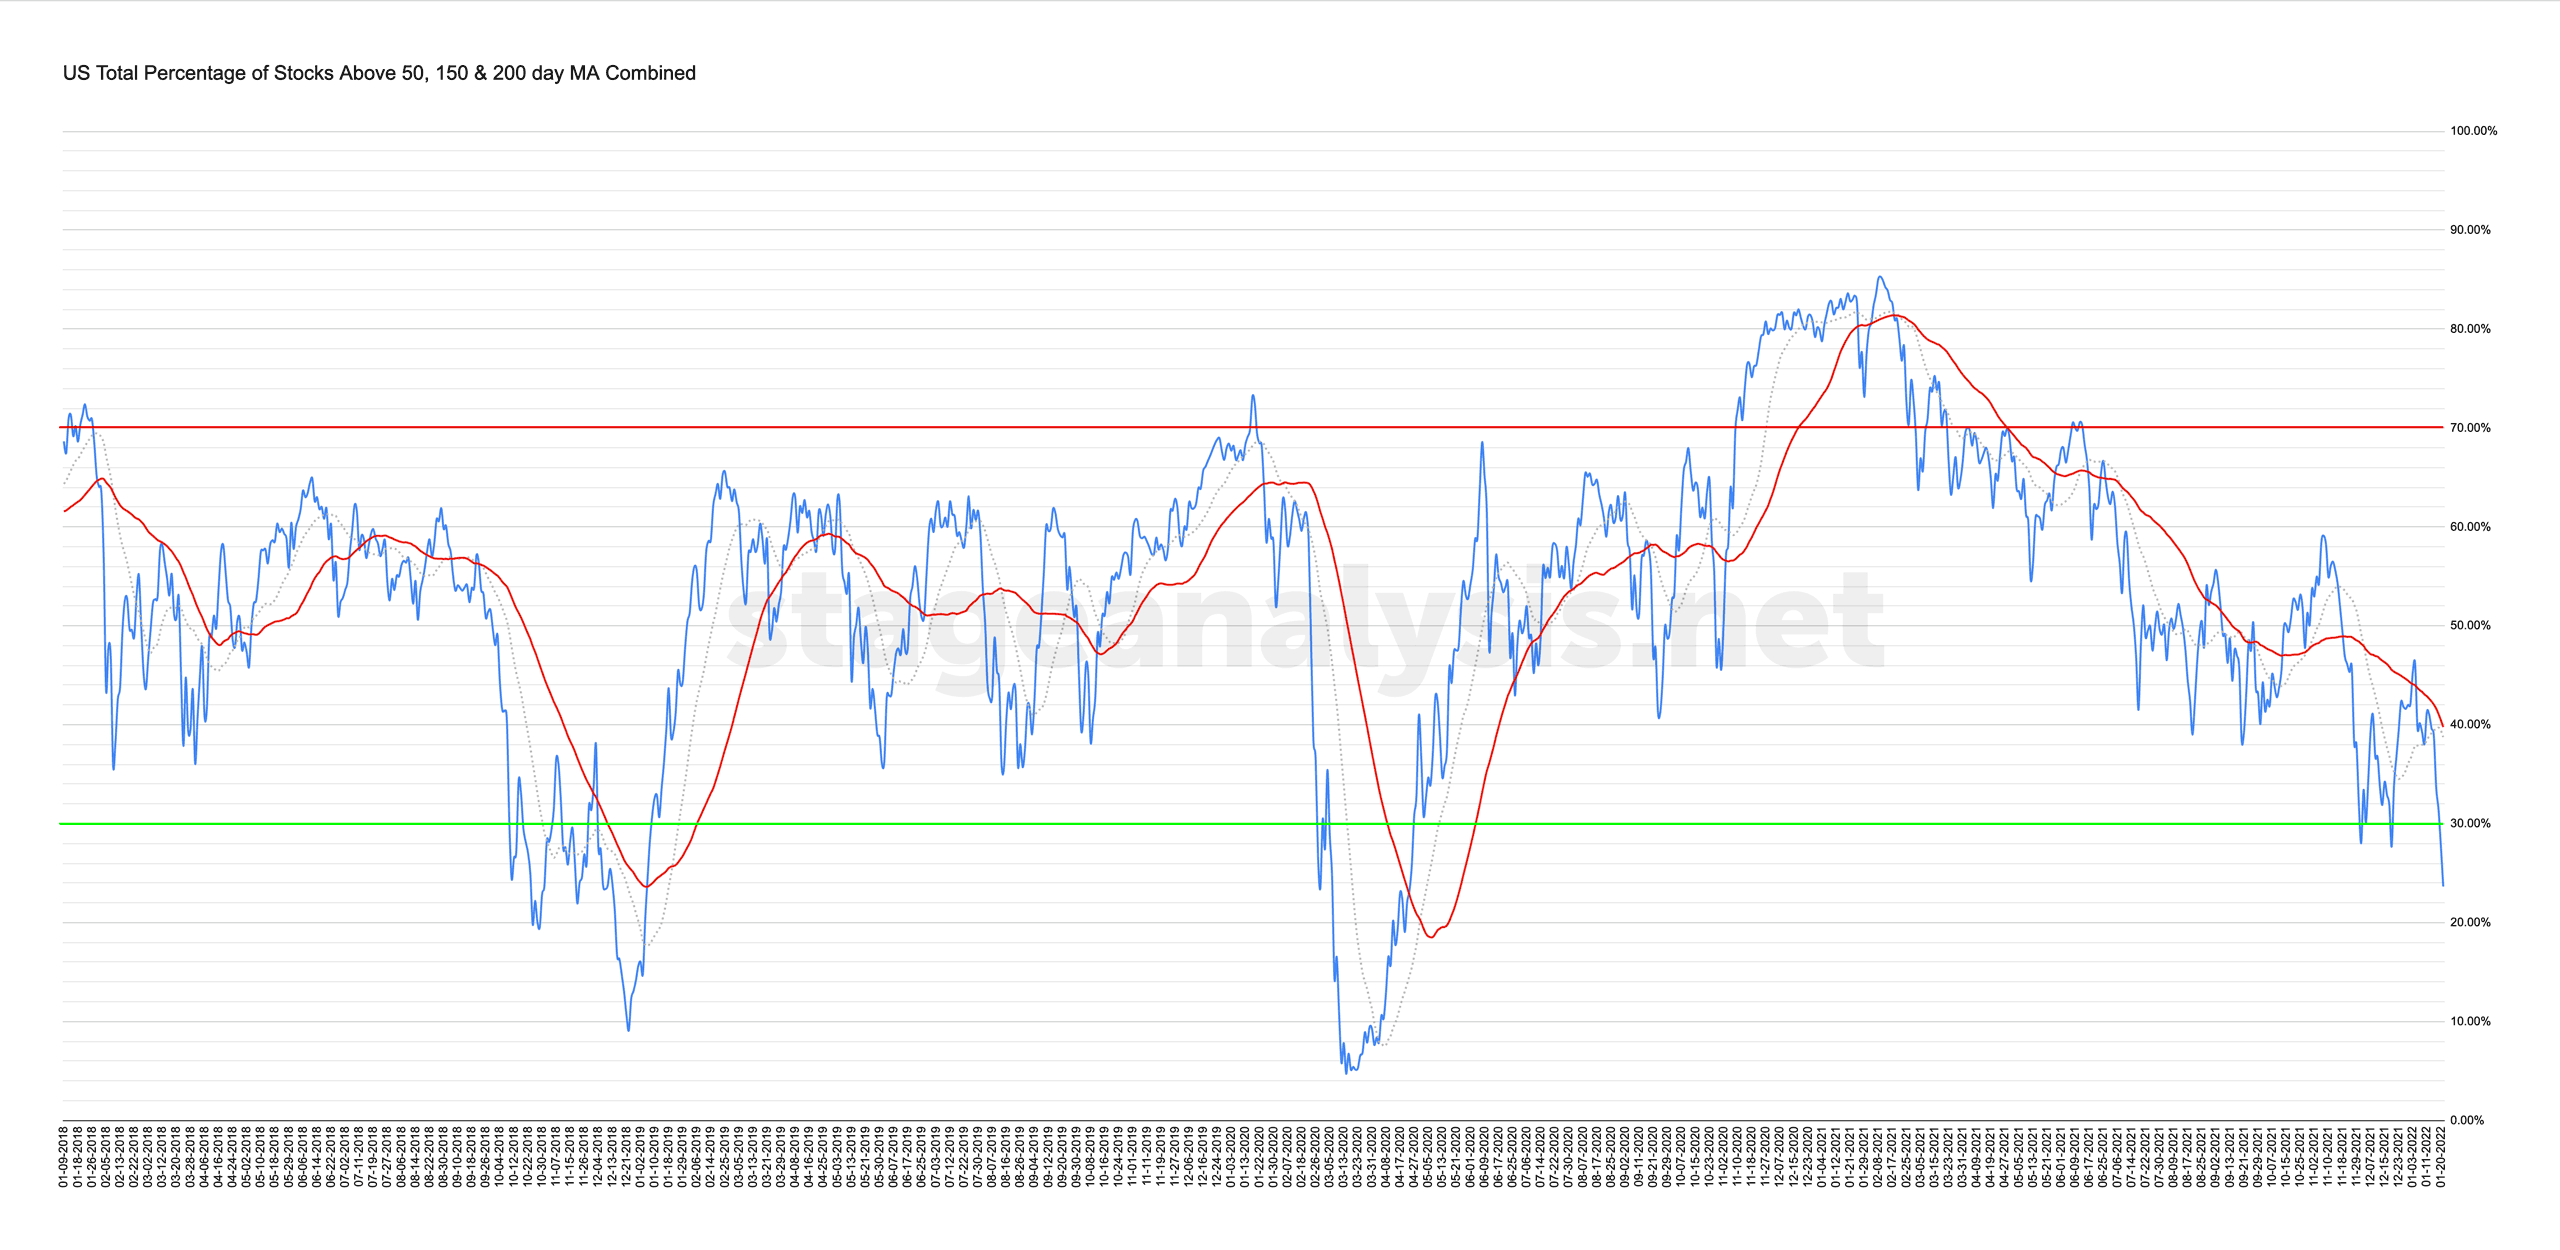
The combined percentage of stocks above their 50 day, 150 day & 200 day MA was at a similar low level (25% ish) following a similar 2 year breadth move on the 13th August 2004 and 6th July 2010.
Both cases was the near term low. So will be watching closely this week for signs of a reversal.
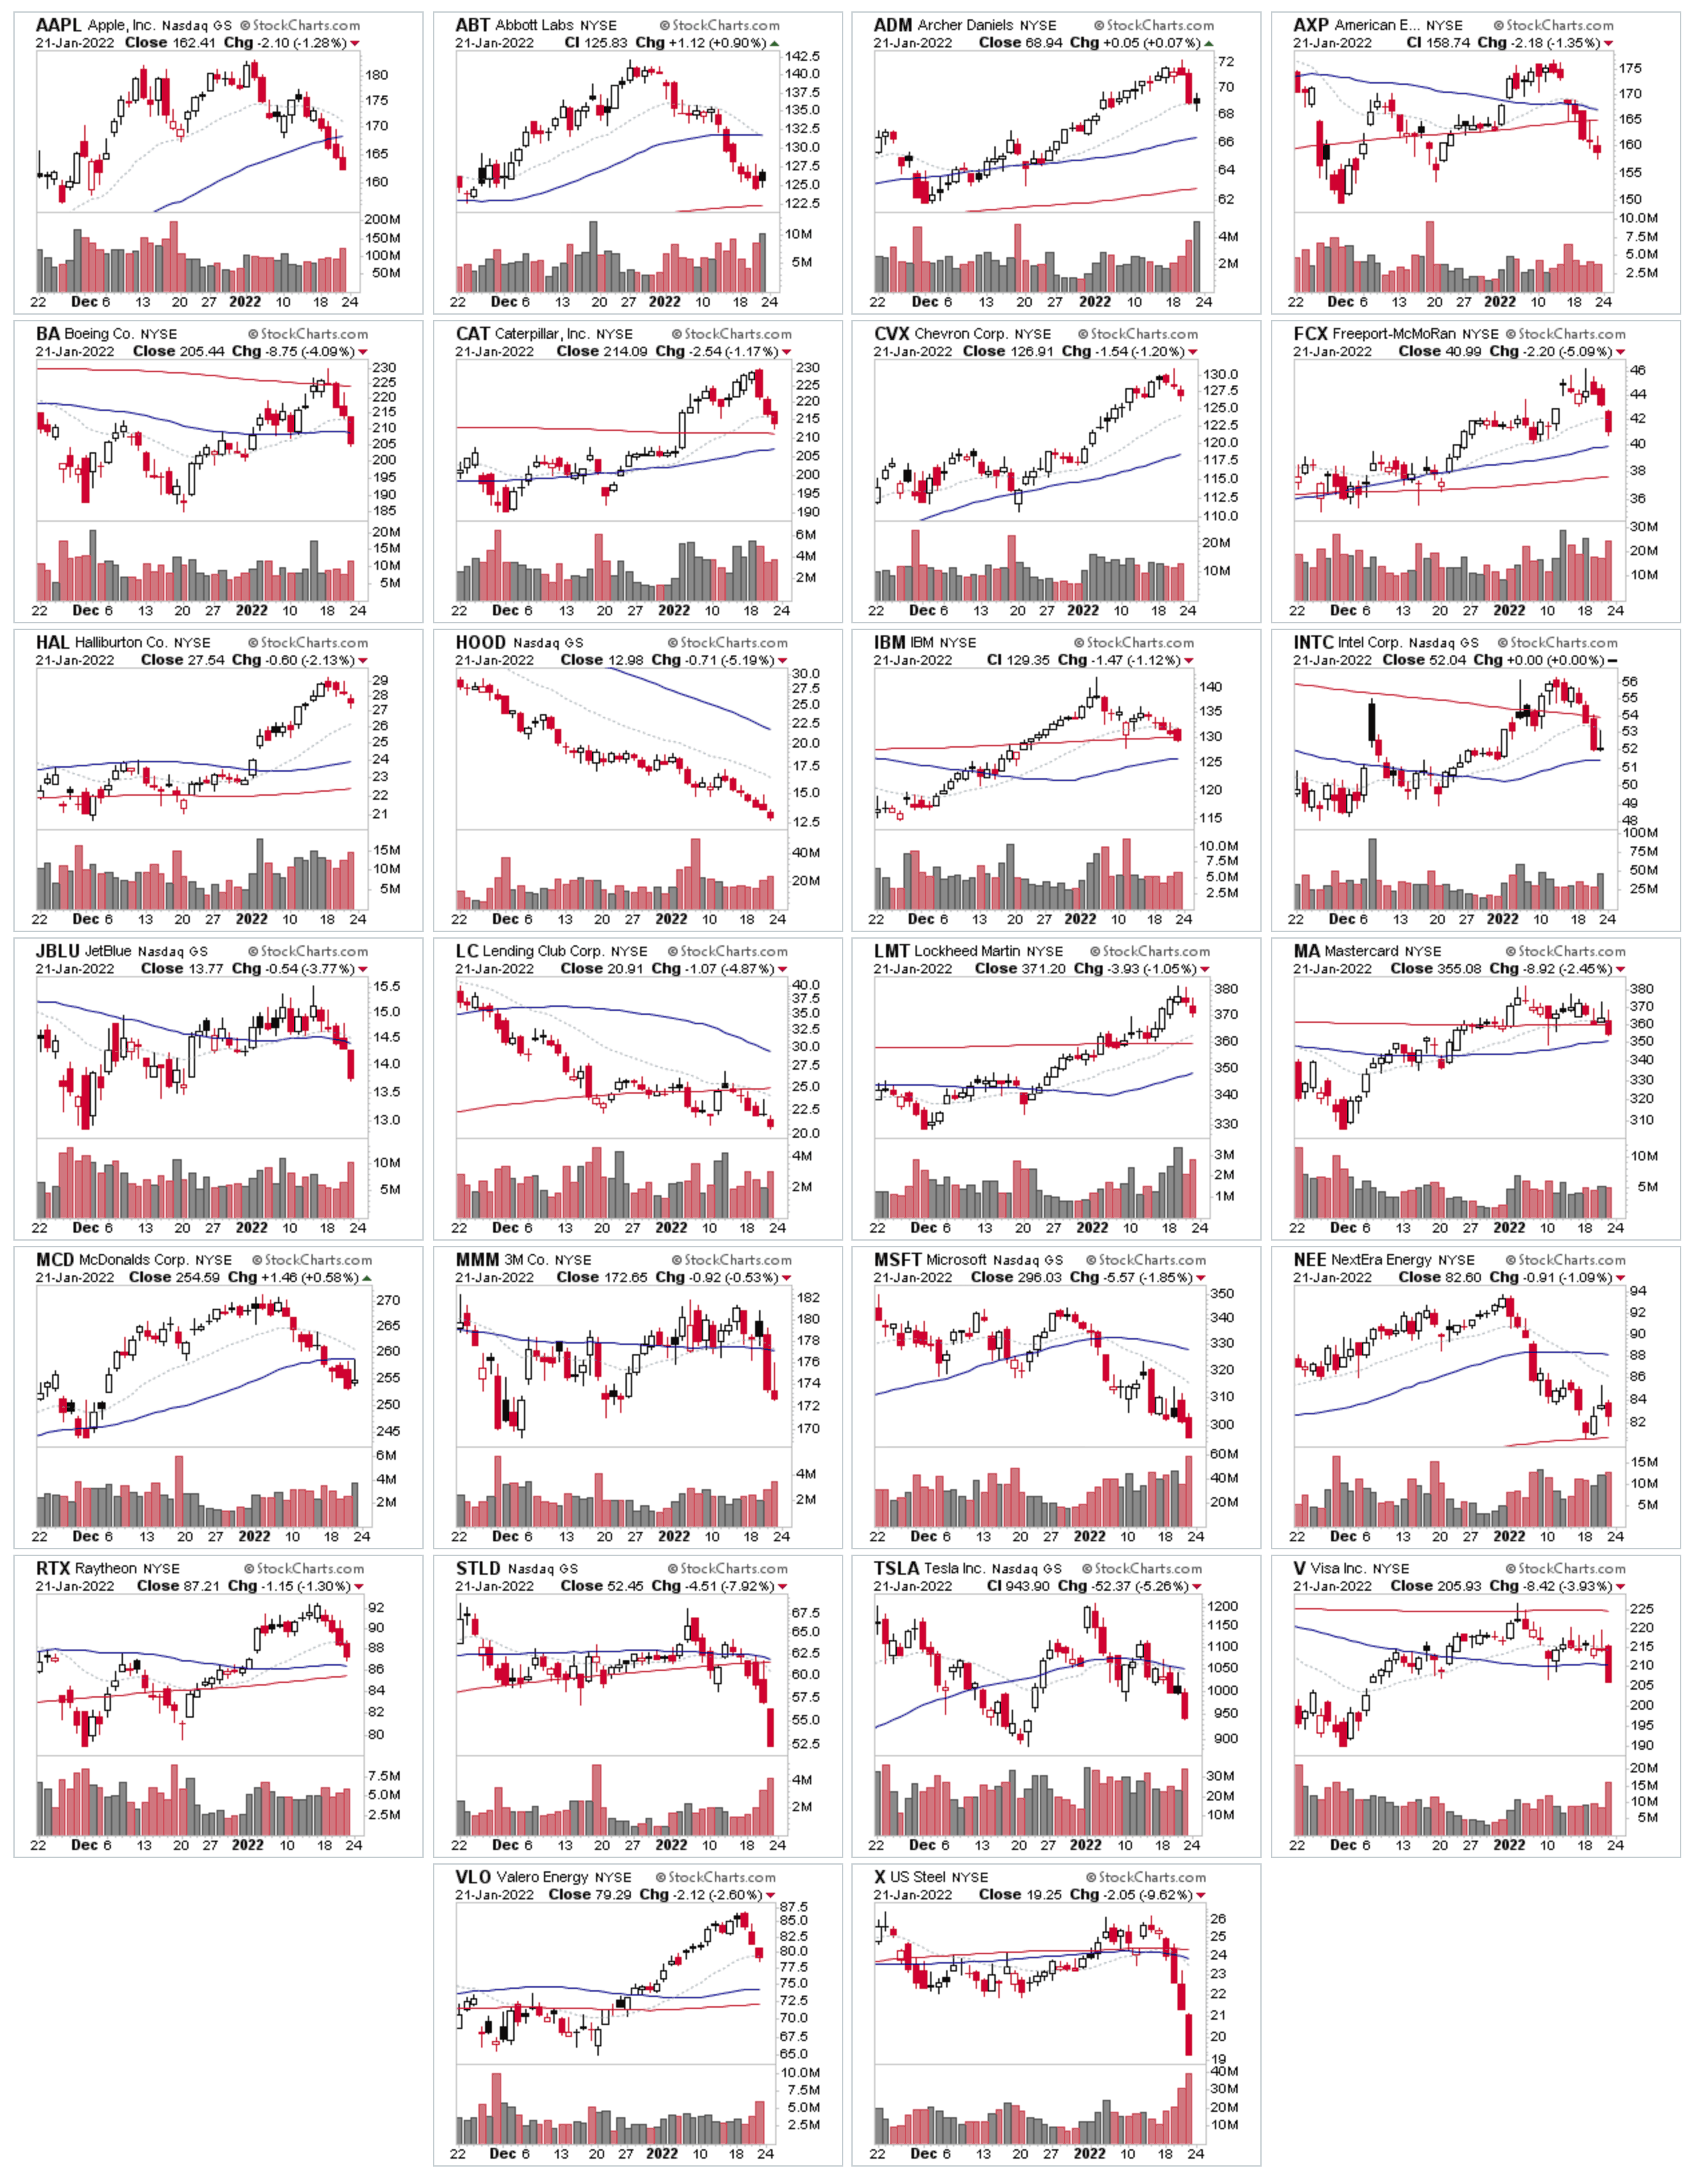
Earnings Watchlist: 24-28 January 2022
With the majority of stocks / groups in Stage 3 or 4, this weekends watchlist is a little different than usual as, as focusing instead on this weeks upcoming earnings:
TSLA, AAPL, MSFT, BA, INTC, JNJ, HAL, T, GE, VZ, IBM, AXP, LMT, FCX, MMM, HOOD, V, MA, NUE, ABT, PHG, CVX, MCD, NEE, STLD, VLO, CAT, RTX, BOH, X, BMRC, LRCX, CBU, SIFY, LEVI, LOGI, UMC, ADM, BX, ERIC, NOW, JBLU, LC, STX, NDAQ,
A lot of large caps reporting this week including some mega caps like TSLA, AAPL, MSFT. So a pivotal week for the market.
Major Indexes
S&P 500 remains the strongest closing just under its 200 day MA. But all major indexes broke down from their recent range over the last week.

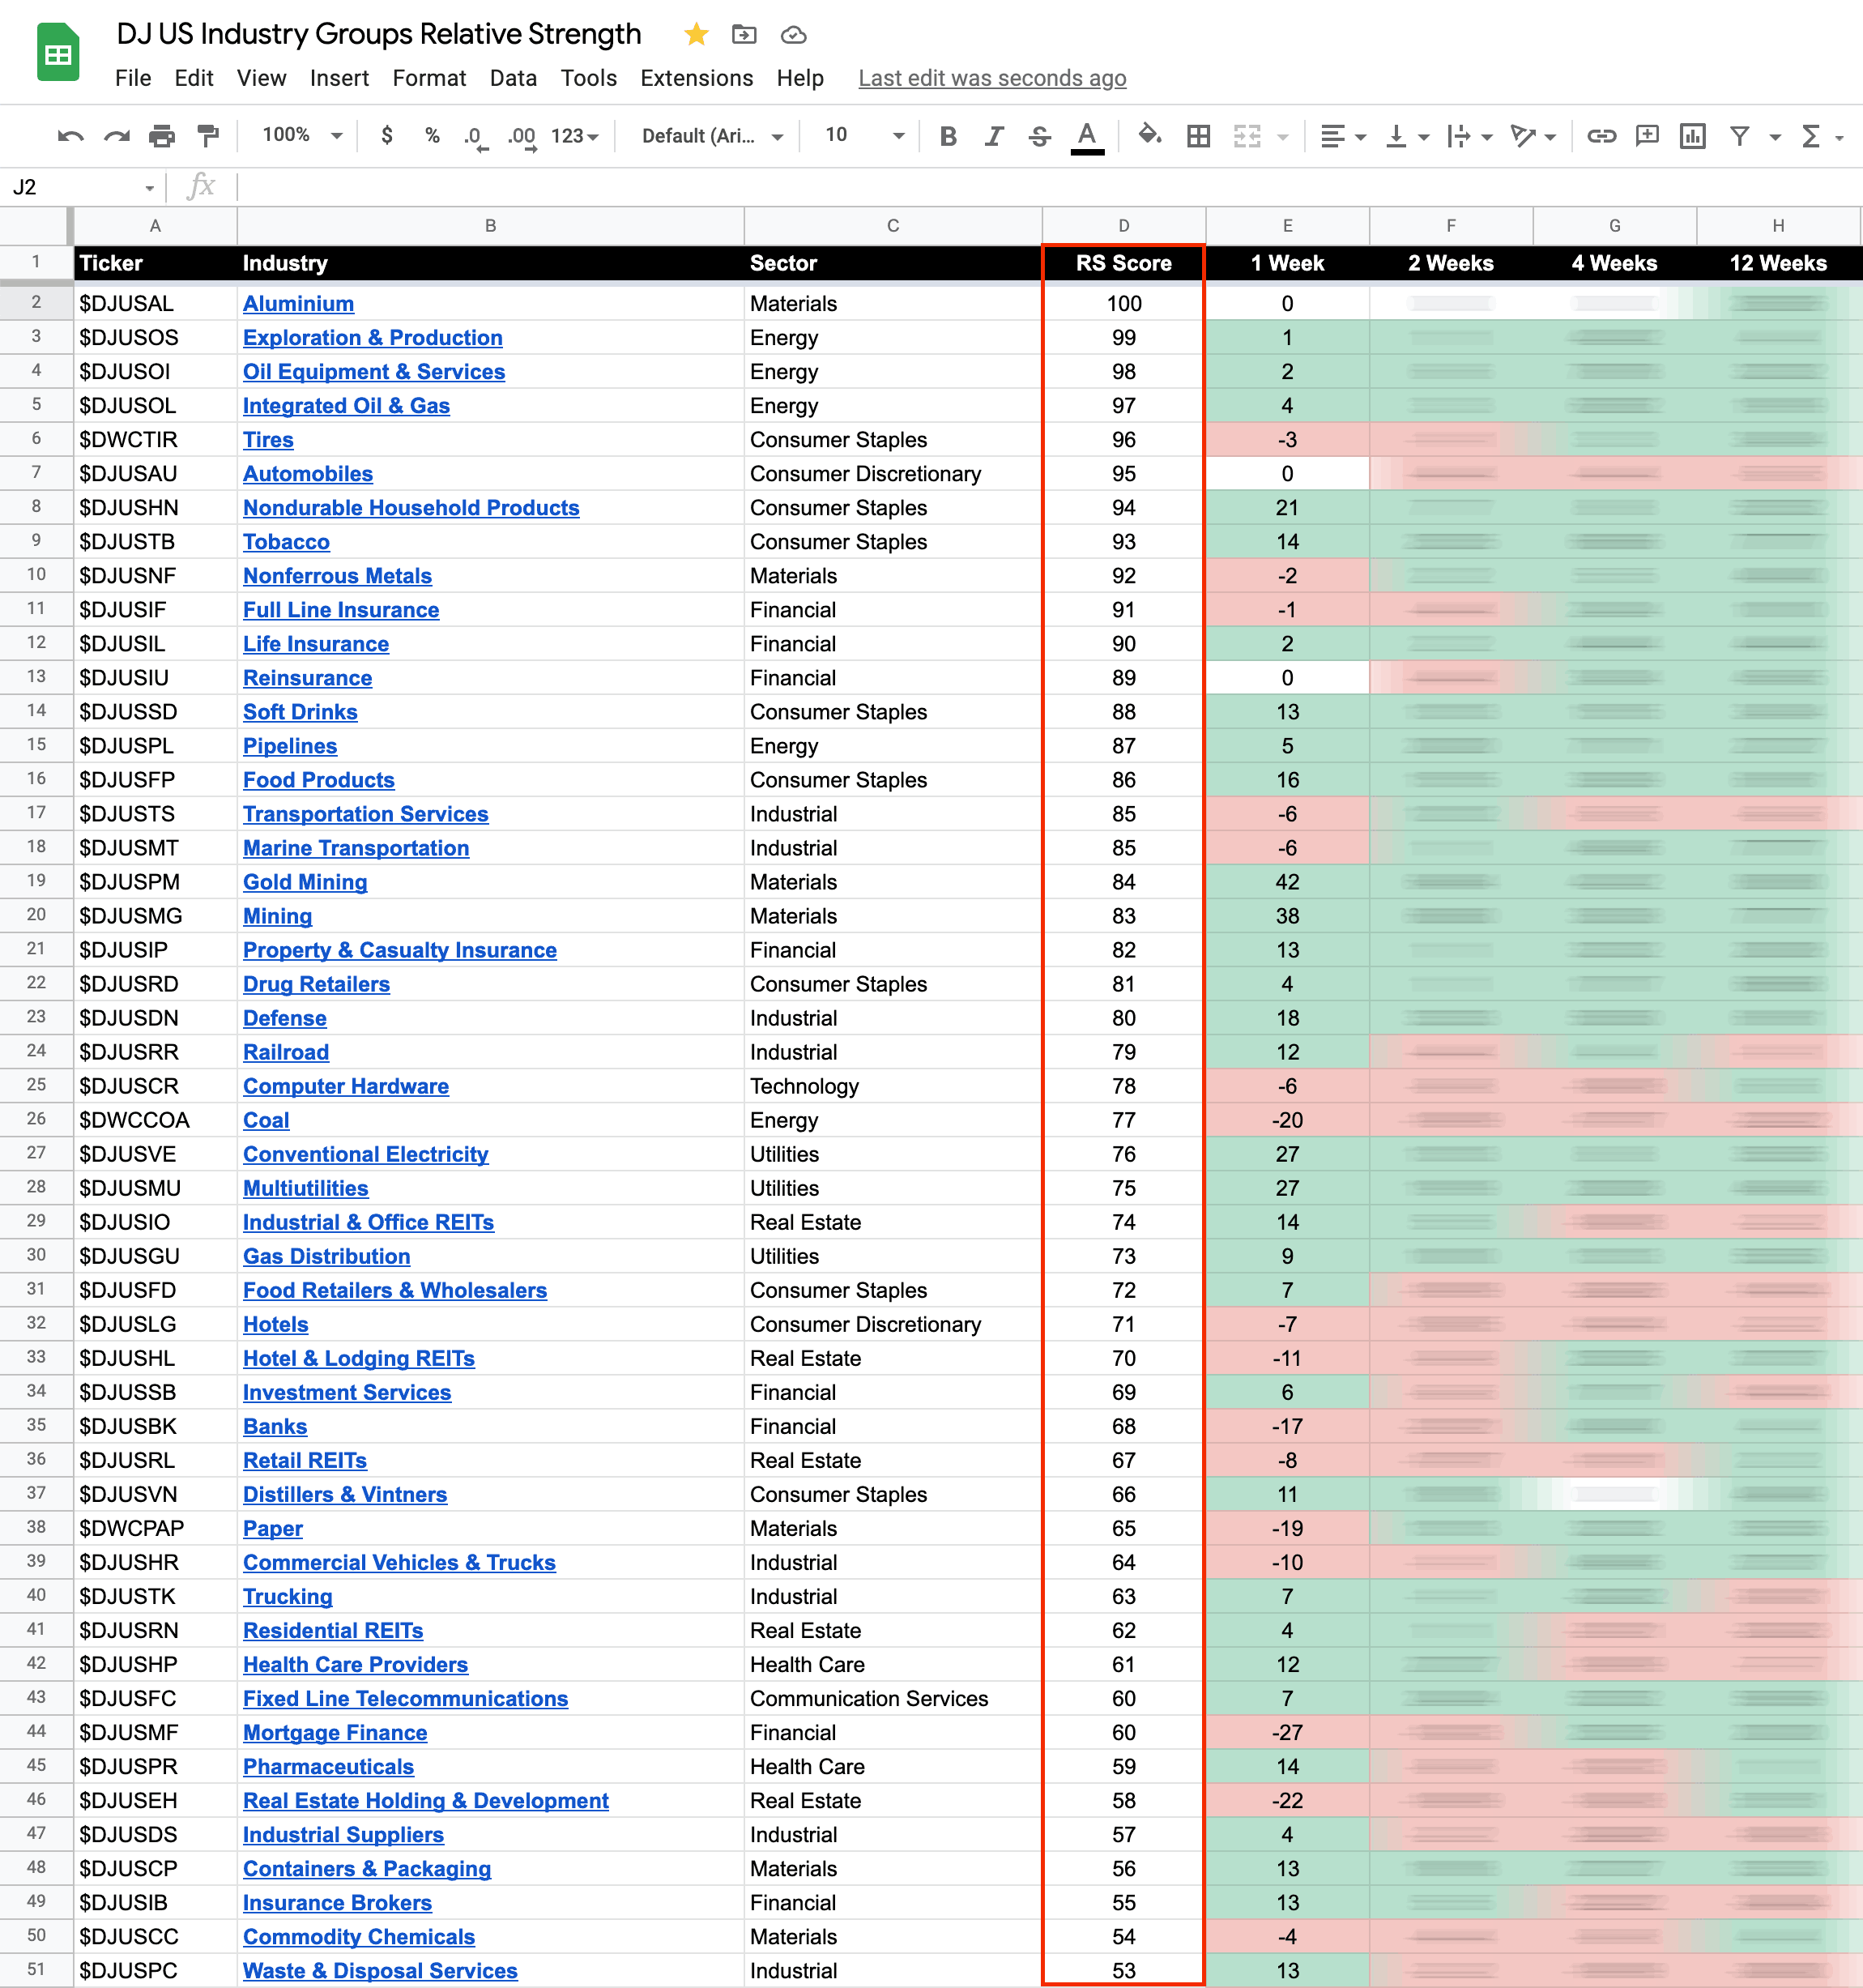
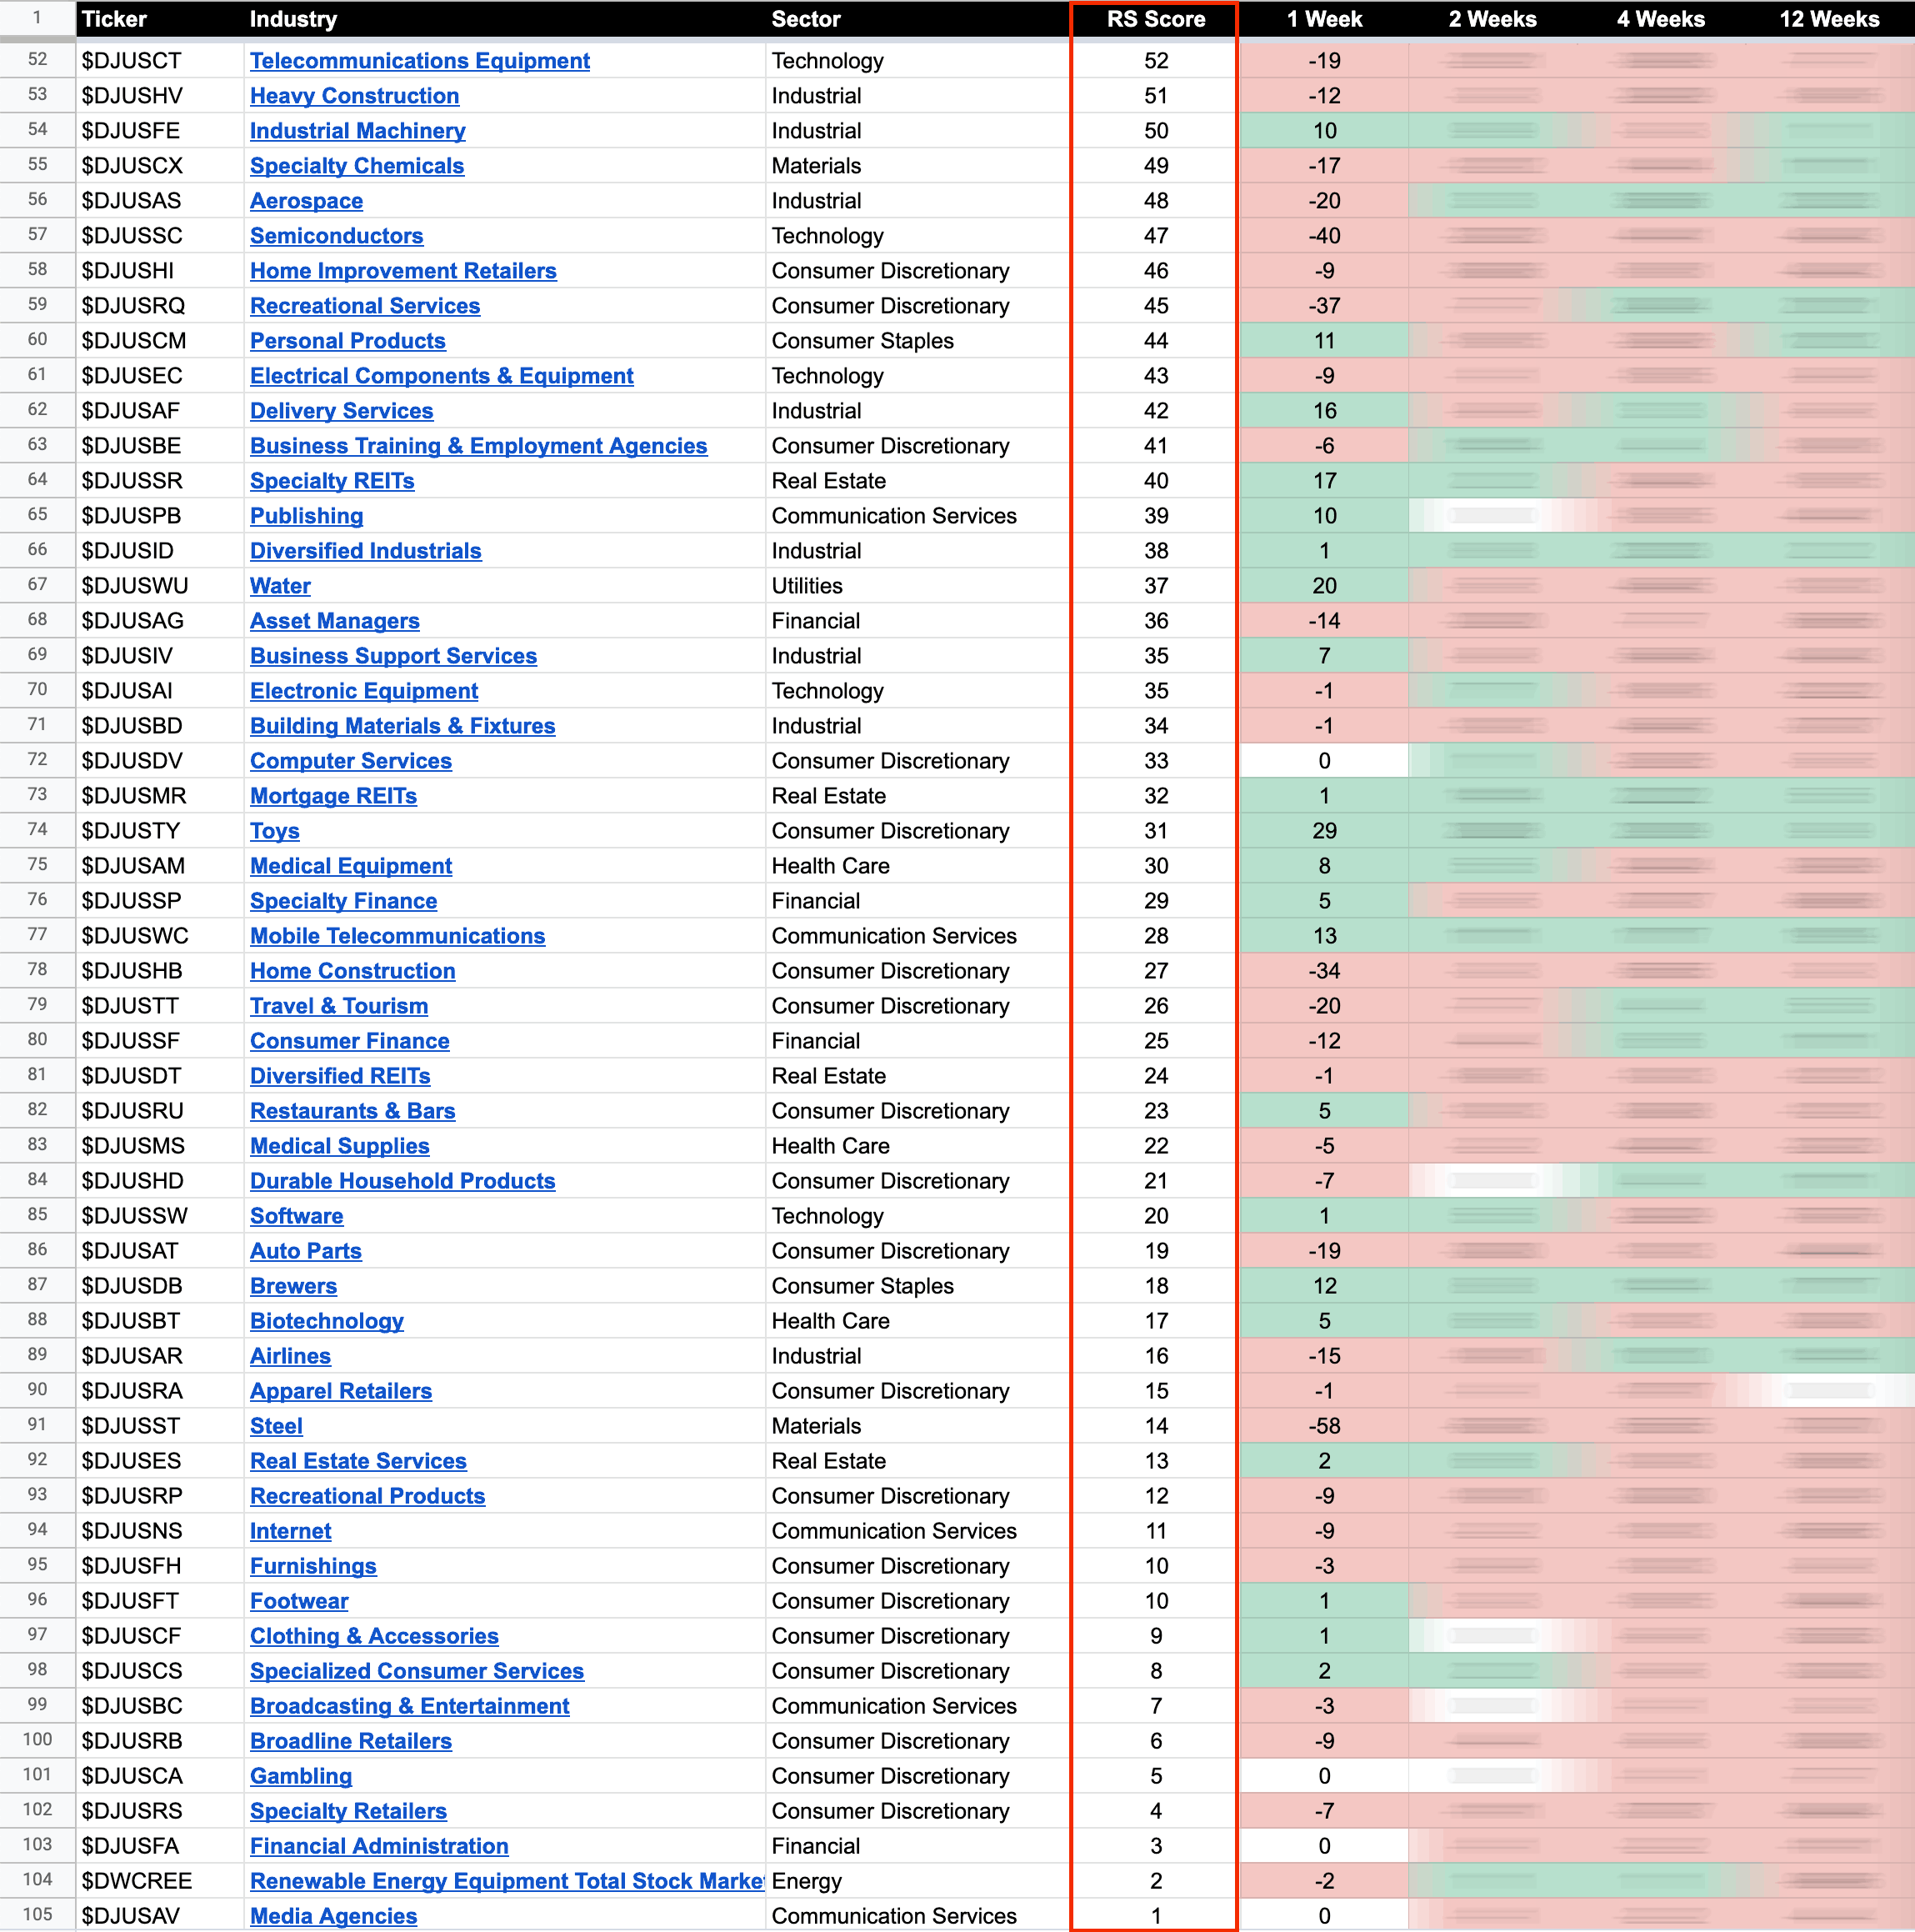
104 Dow Jones Industry Groups sorted by Relative Strength
The purpose of the RS tables is to track the short, medium and long term RS changes of the individual groups to find the new leadership earlier than the crowd.
100 is strongest, 0 is weakest
US Total % Stocks Above their 50 Day, 150 Day & 200 Day Moving Averages Combined
23.65% (-15.19% 1wk)
Status: Very Difficult Environment (Lower Zone)
Become a Stage Analysis Member:
To see more like this – US Stocks watchlist posts, detailed videos each weekend, use our unique Stage Analysis tools, such as the US Stocks & ETFs Screener, Charts, Market Breadth, Group Relative Strength and more...
Join Today
Disclaimer: For educational purpose only. Not investment advice. Seek professional advice from a financial advisor before making any investing decisions.