
Stage Analysis Technical Attributes Scores – Nasdaq 100
The Stage Analysis Technical Attributes (SATA) score is our proprietary indicator that helps to identify the four stages from Stan Weinstein's Stage Analysis method, using a scoring system from 0 to 10 that rates ten of the key technical characteristics that we look for when analysing the weekly charts.
We last covered the weekly SATA scores for the Nasdaq 100 back on 24th July, which gives a rough guide of the Stages of the individual stocks within the Nasdaq 100. i.e. everything above a 7 would be considered in the Stage 2 zone (Strong), 4-6 in the Stage 1 or Stage 3 zone (Neutral), and 3 or below is the Stage 4 zone (Weak).
Currently the Nasdaq 100 consists of:
- 46% Stage 2 zone (Strong)
- 29% Stage 1 or Stage 3 zone (Neutral)
- 24% Stage 4 zone (Weak)
- 1% has no SATA score yet
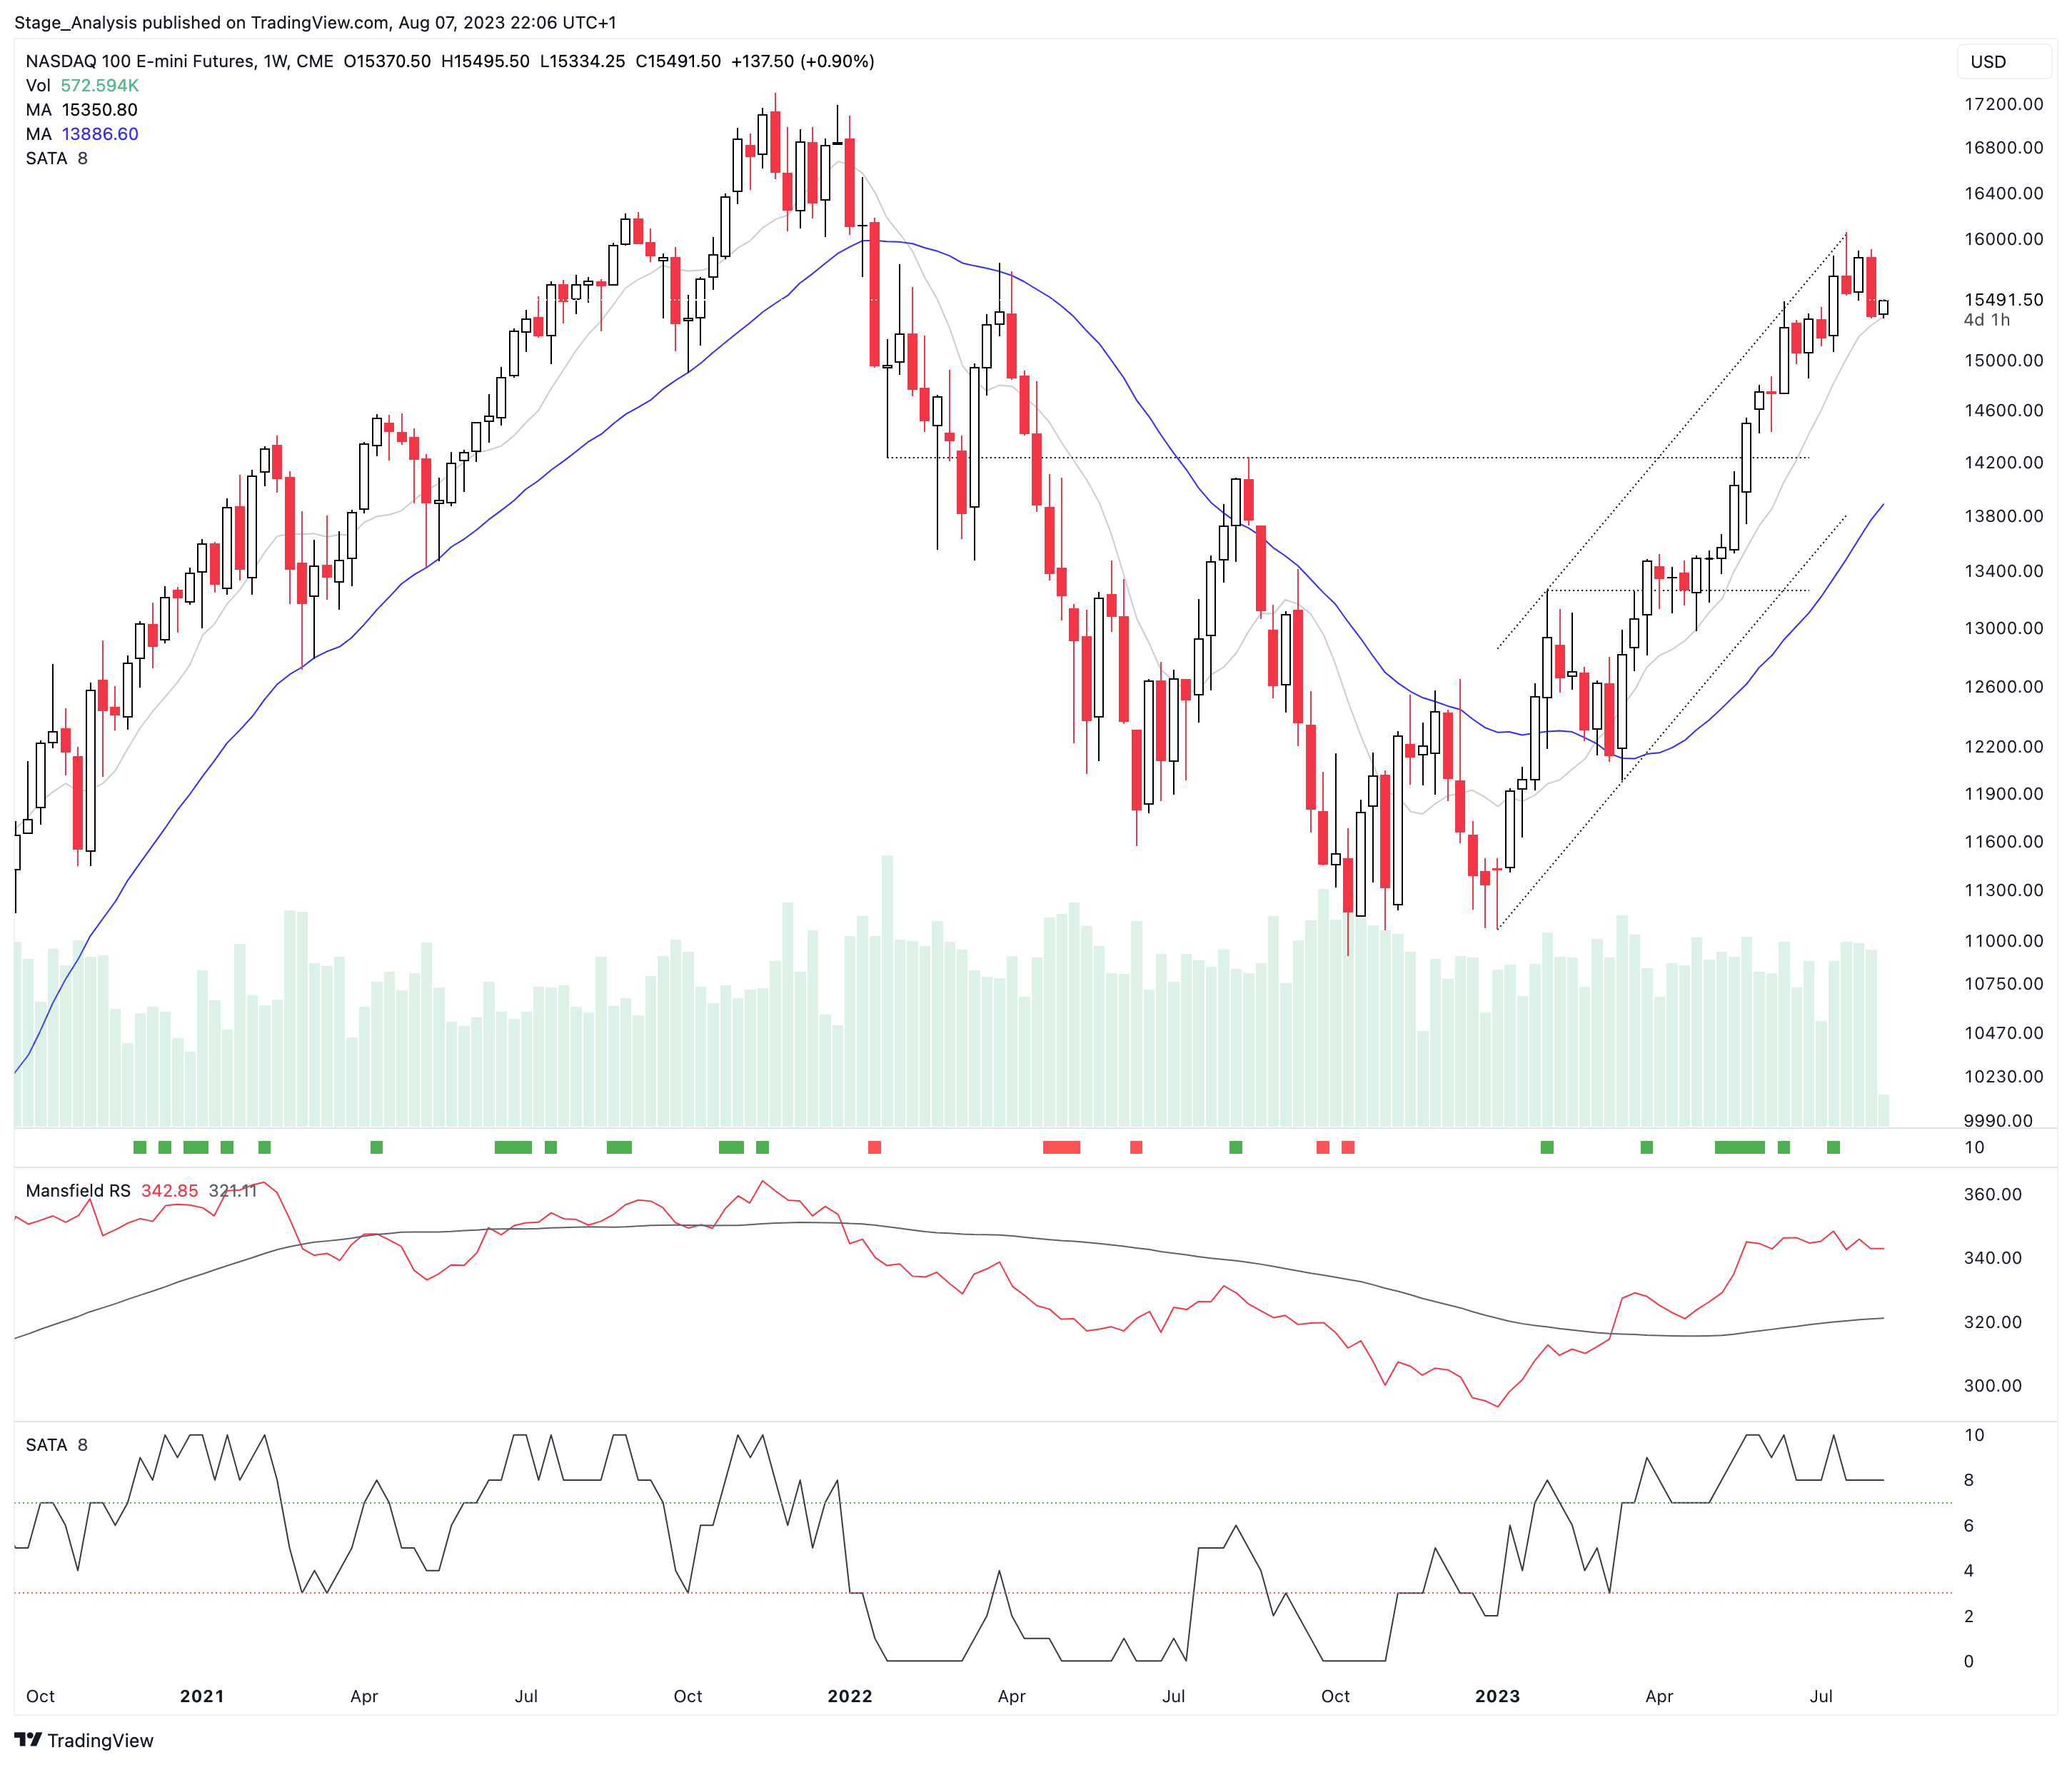
Nasdaq 100 weekly SATA Score: 8 (Strong), daily SATA Score: 2 (Weak)
Percentage of stocks with a technically healthy SATA Score (6+): 54%
Compared to the 24th July post there are -15% less stocks in the Stage 2 zone, +3% more stocks in the Stage 1 or Stage 3 zone, and +12% more stocks in the Stage 4 zone, and the overall weighting has shifted back towards a more Neutral position of the bell curve, with 54% of the Nasdaq 100 stocks in a technically healthy position (based on their SATA score data). So that's decline of 18% in the last 2 weeks, as it was previously at 72%.
Below are the updated SATA data tables for the Nasdaq 100, sorted in three different ways to help you see the technical positions as well as relative strength and the SATA changes. As each gives a different perspective.
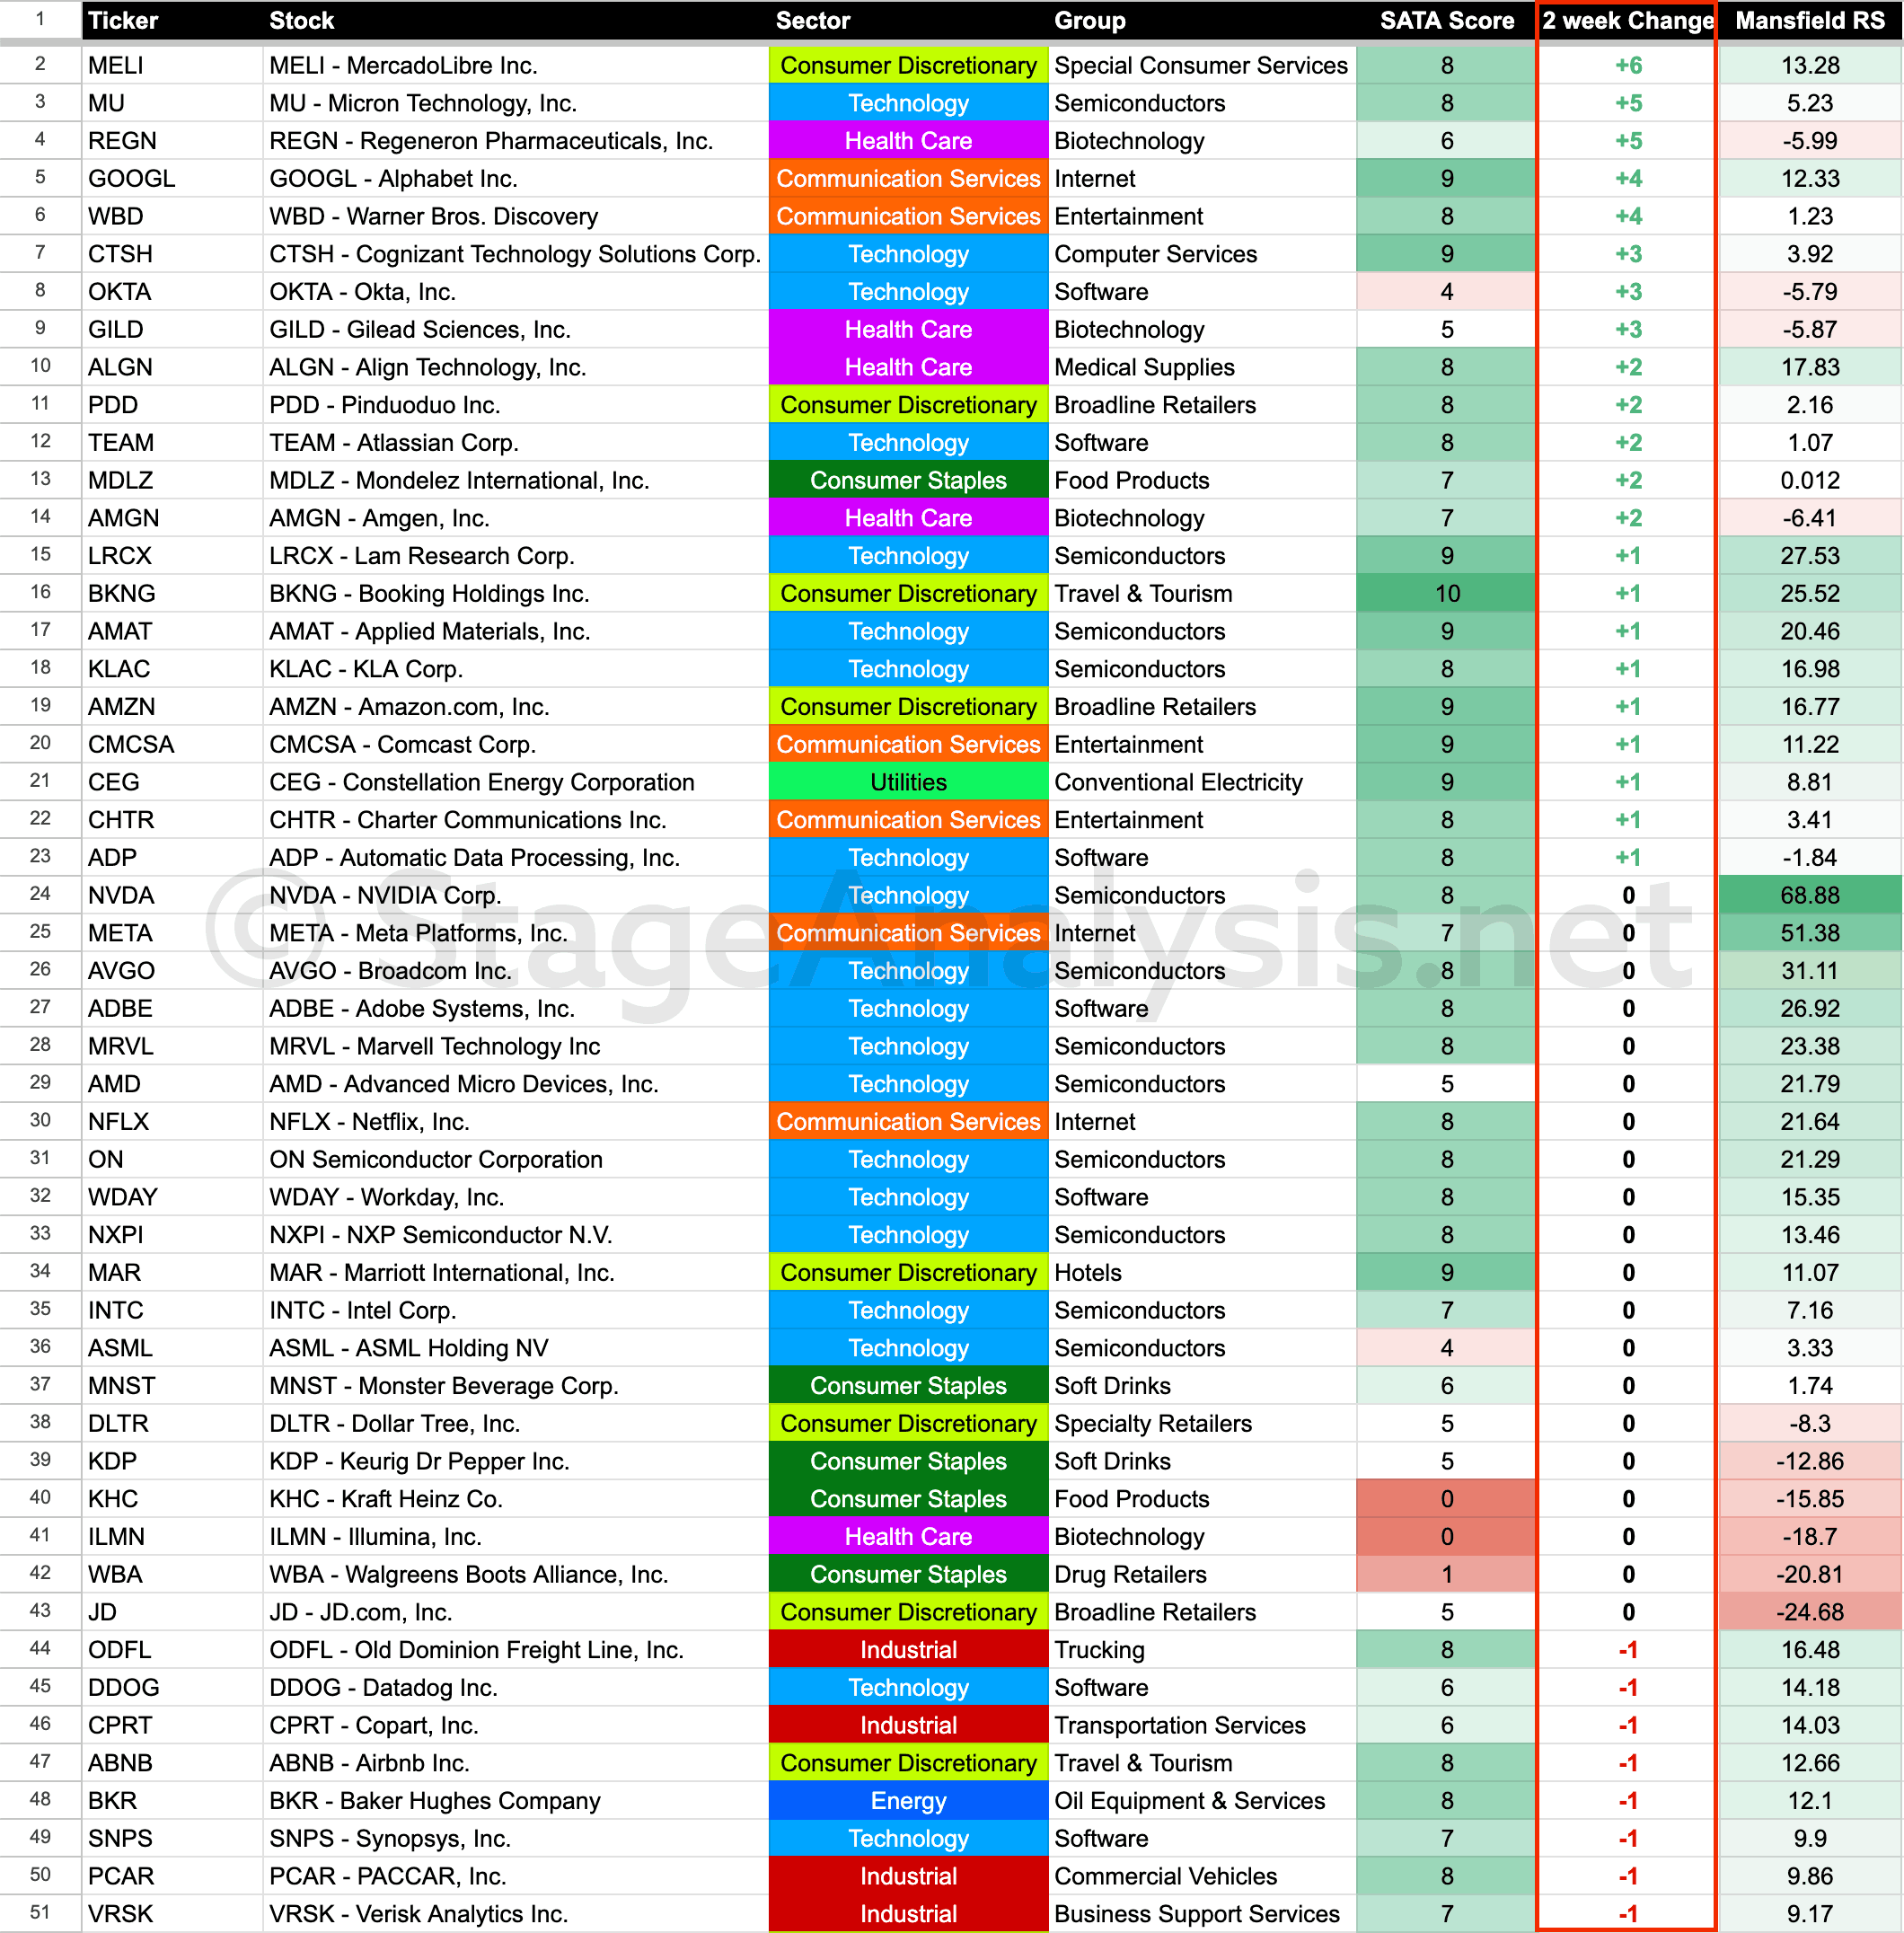
Nasdaq 100 Stocks – Ordered by Highest SATA Score + Mansfield Relative Strength
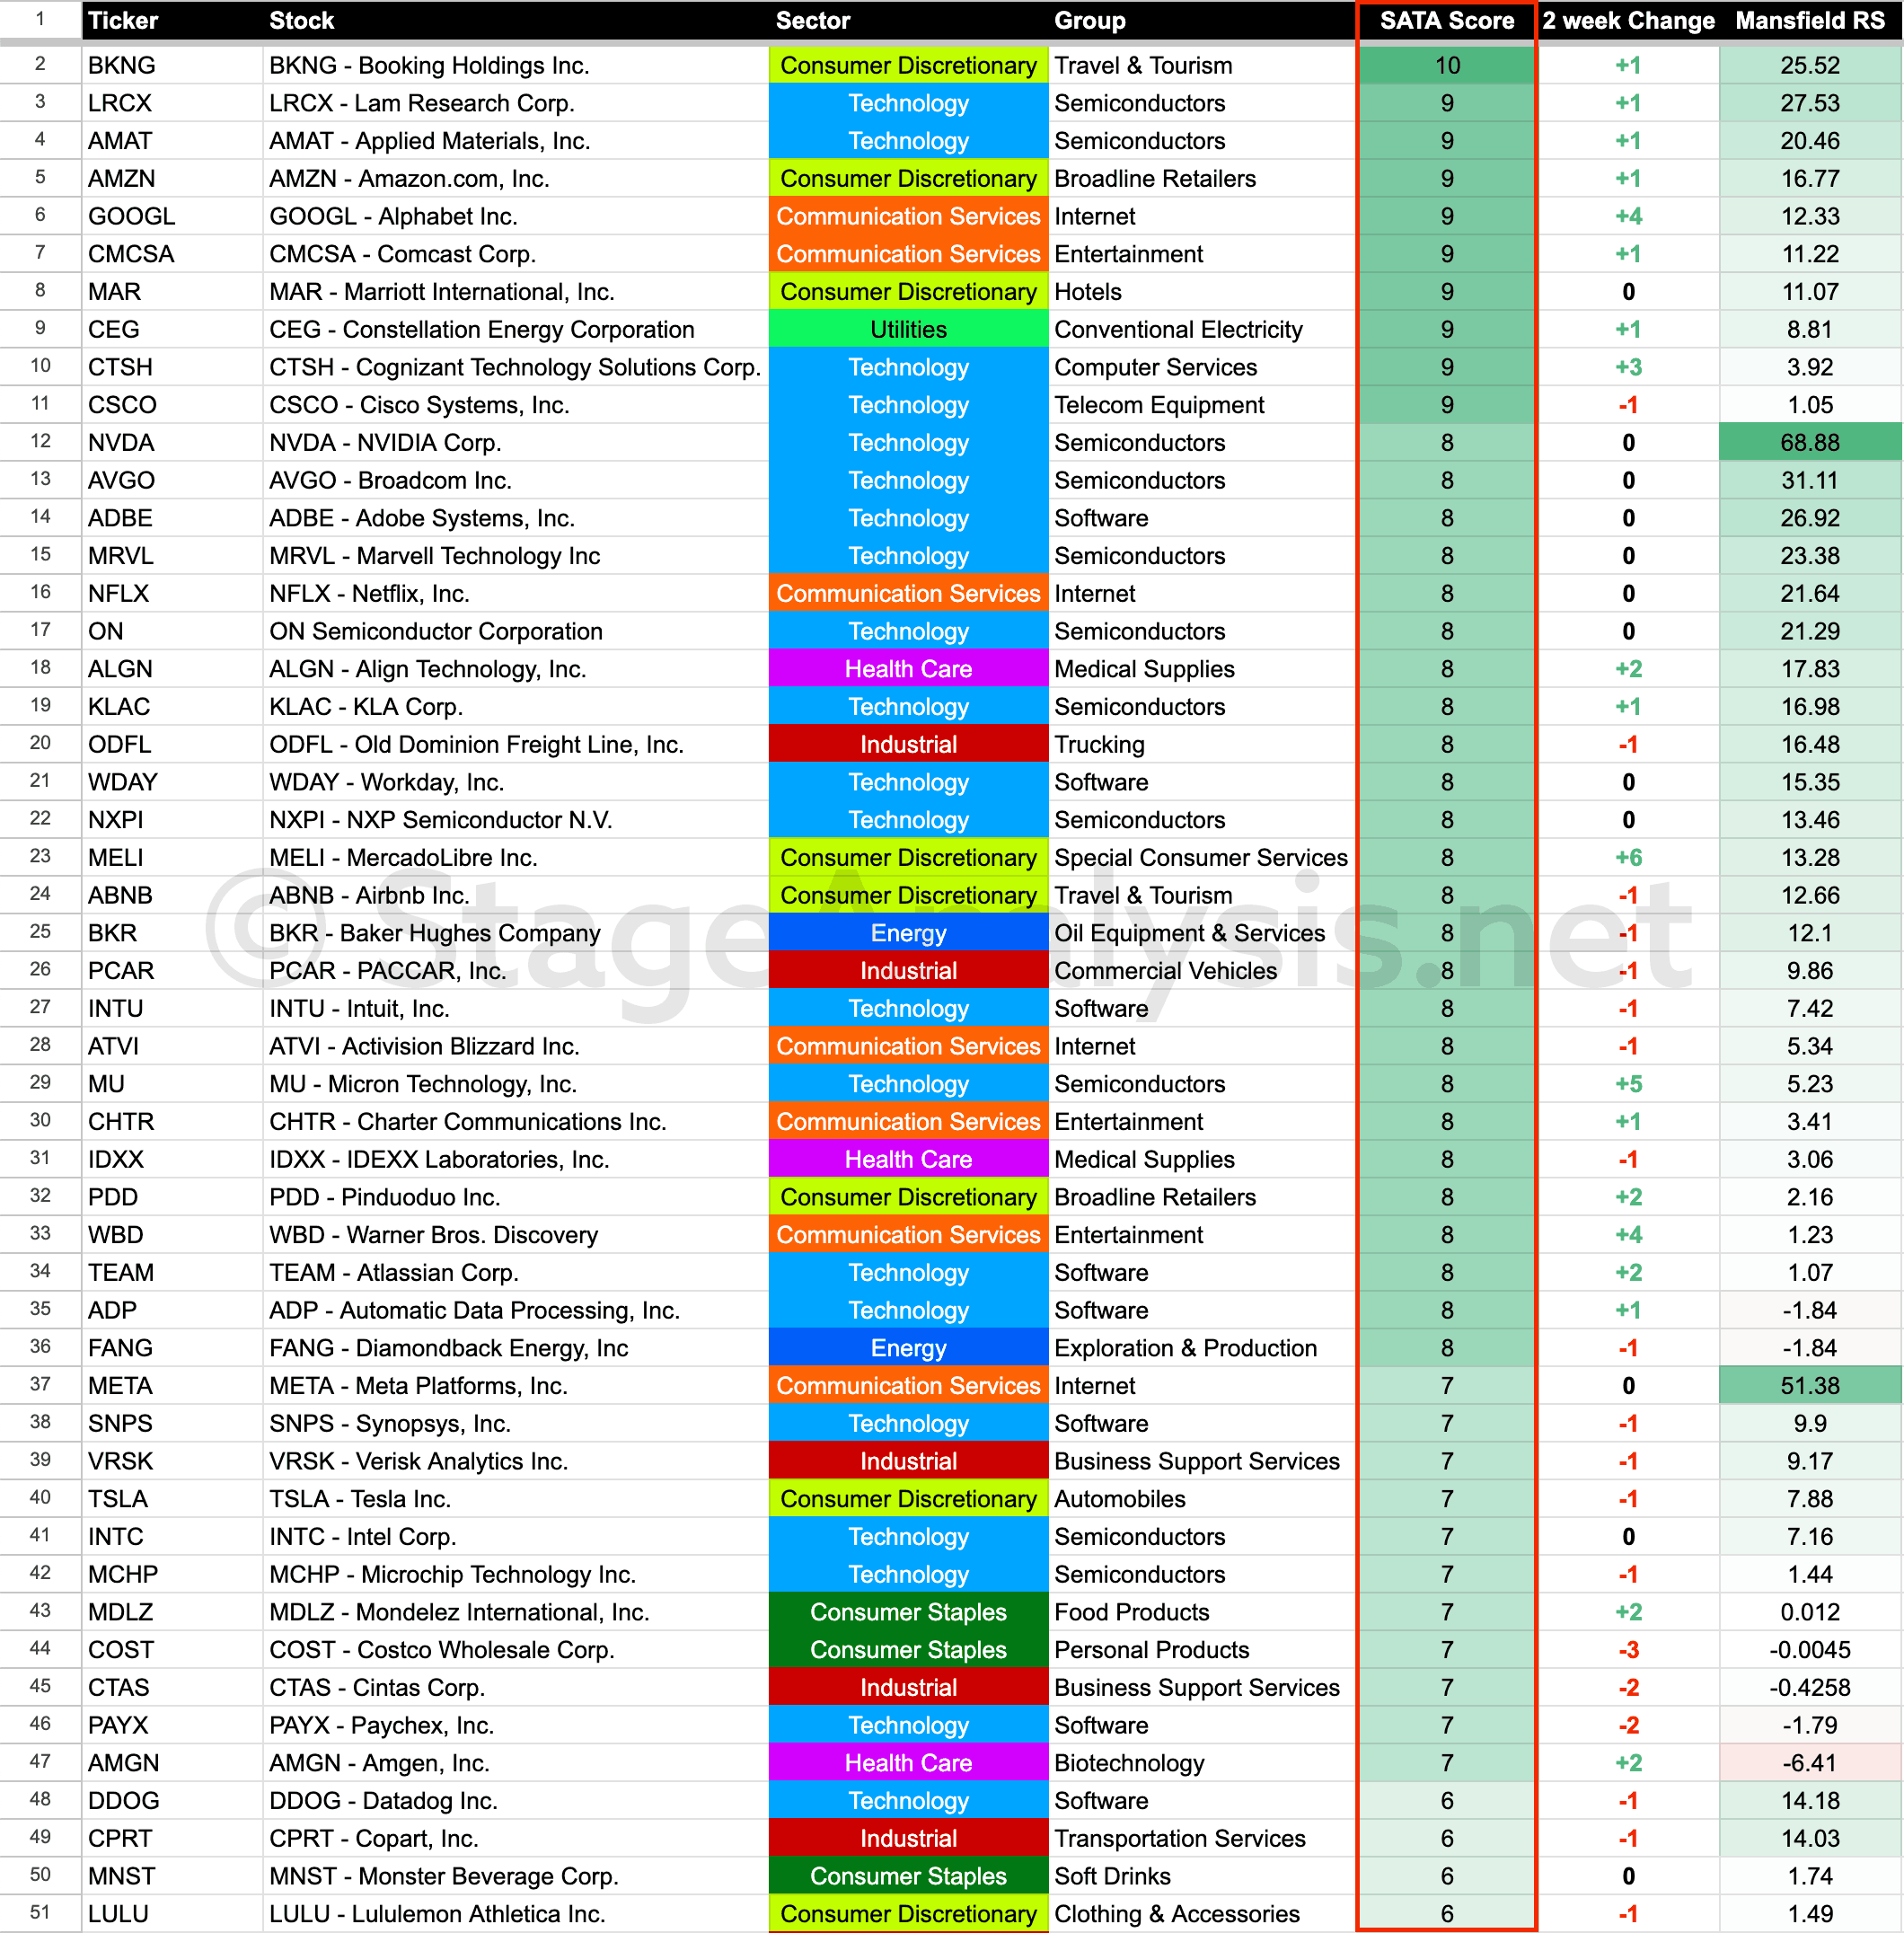
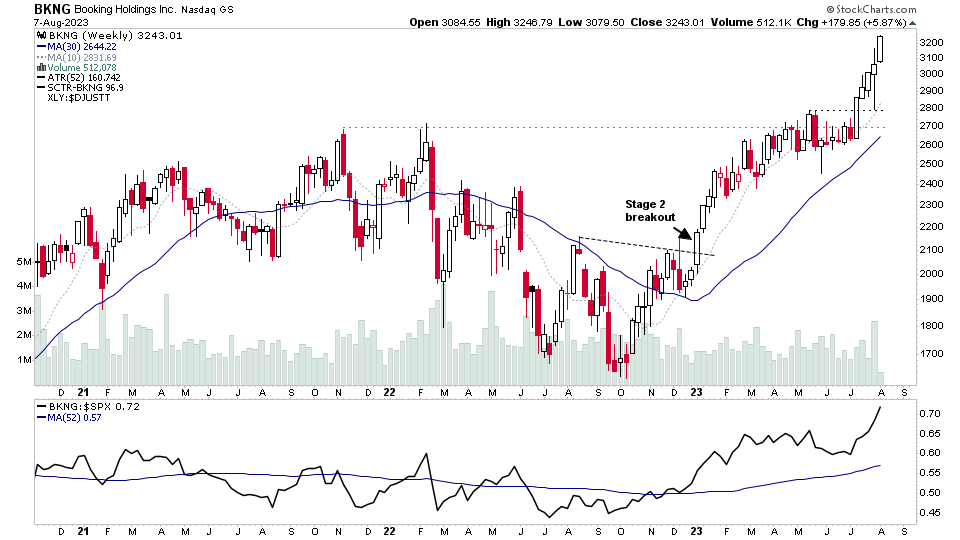
BKNG is the only stock currently on max SATA score of 10 with a gap up on the 4th August following earnings results and a continuation to new all time highs today.
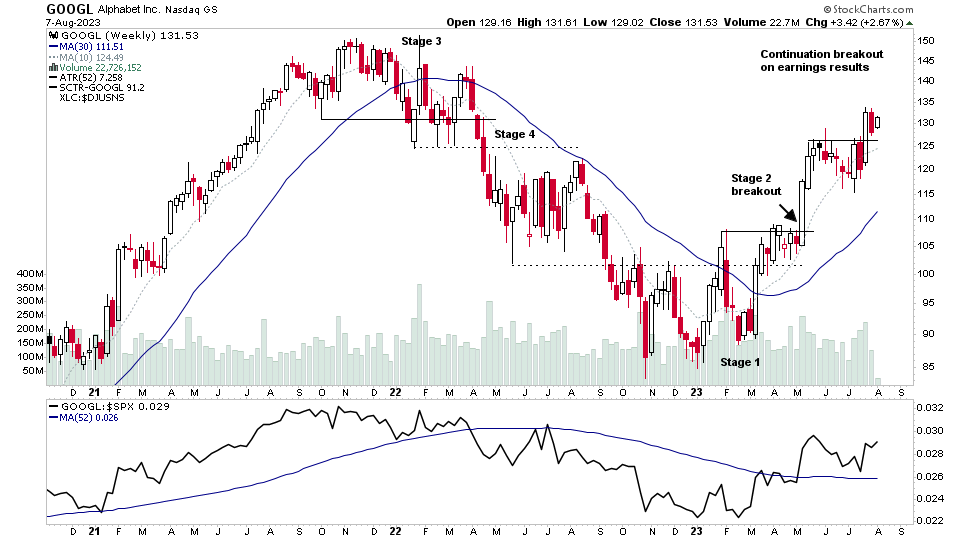
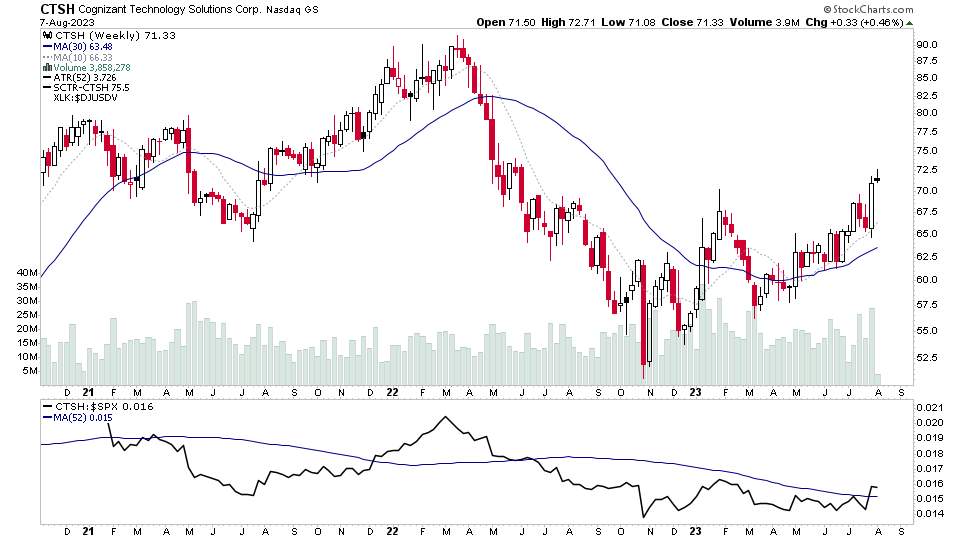
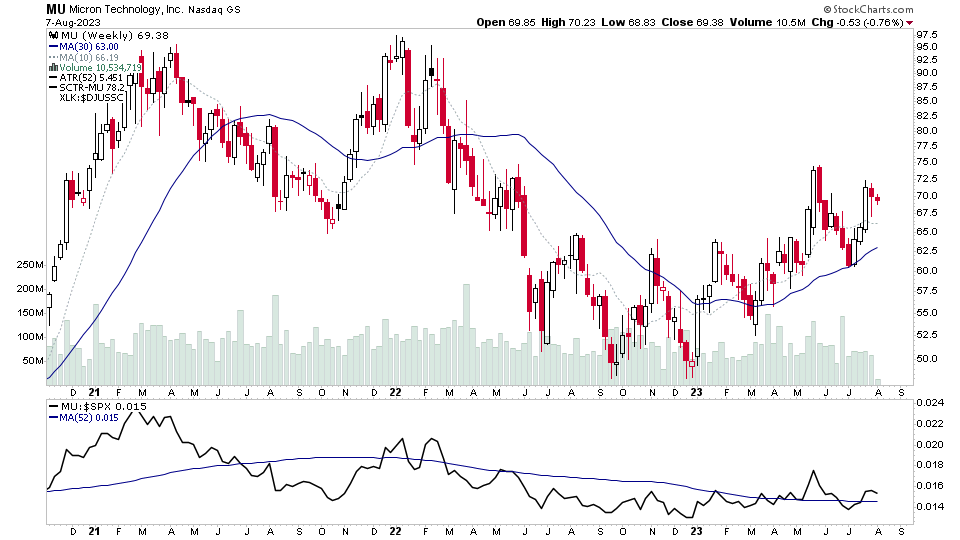
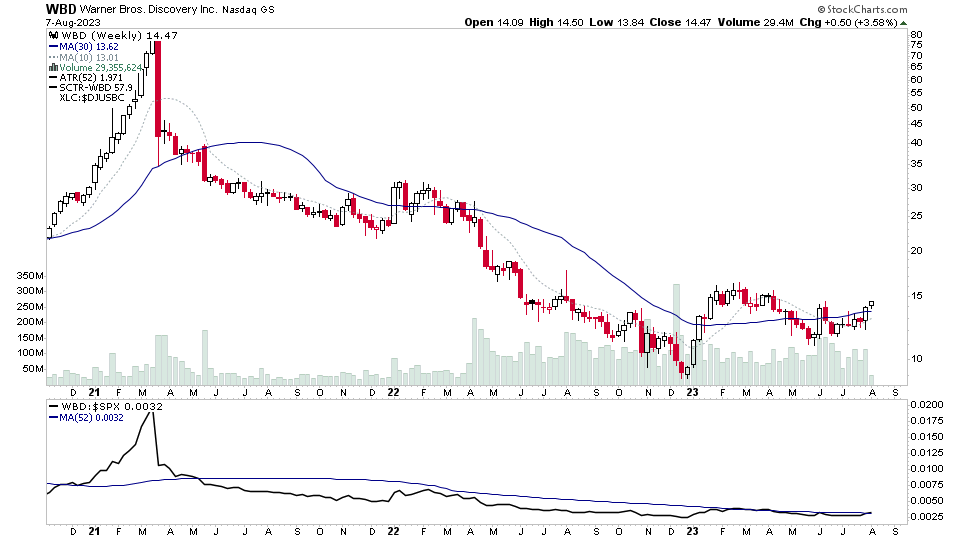
Stocks with SATA scores of 8 or above, with some of the strongest SATA changes over the last few weeks include: GOOGL, CTSH, MELI, MU, WBD.
GOOGL's score for example has risen by an impressive +4 in the last 2 weeks from a neutral score of SATA 5 to a very strong score of SATA 9 currently, as it's made a Stage 2 continuation breakout following earnings results from it's first re-accumulation base in Stage 2.

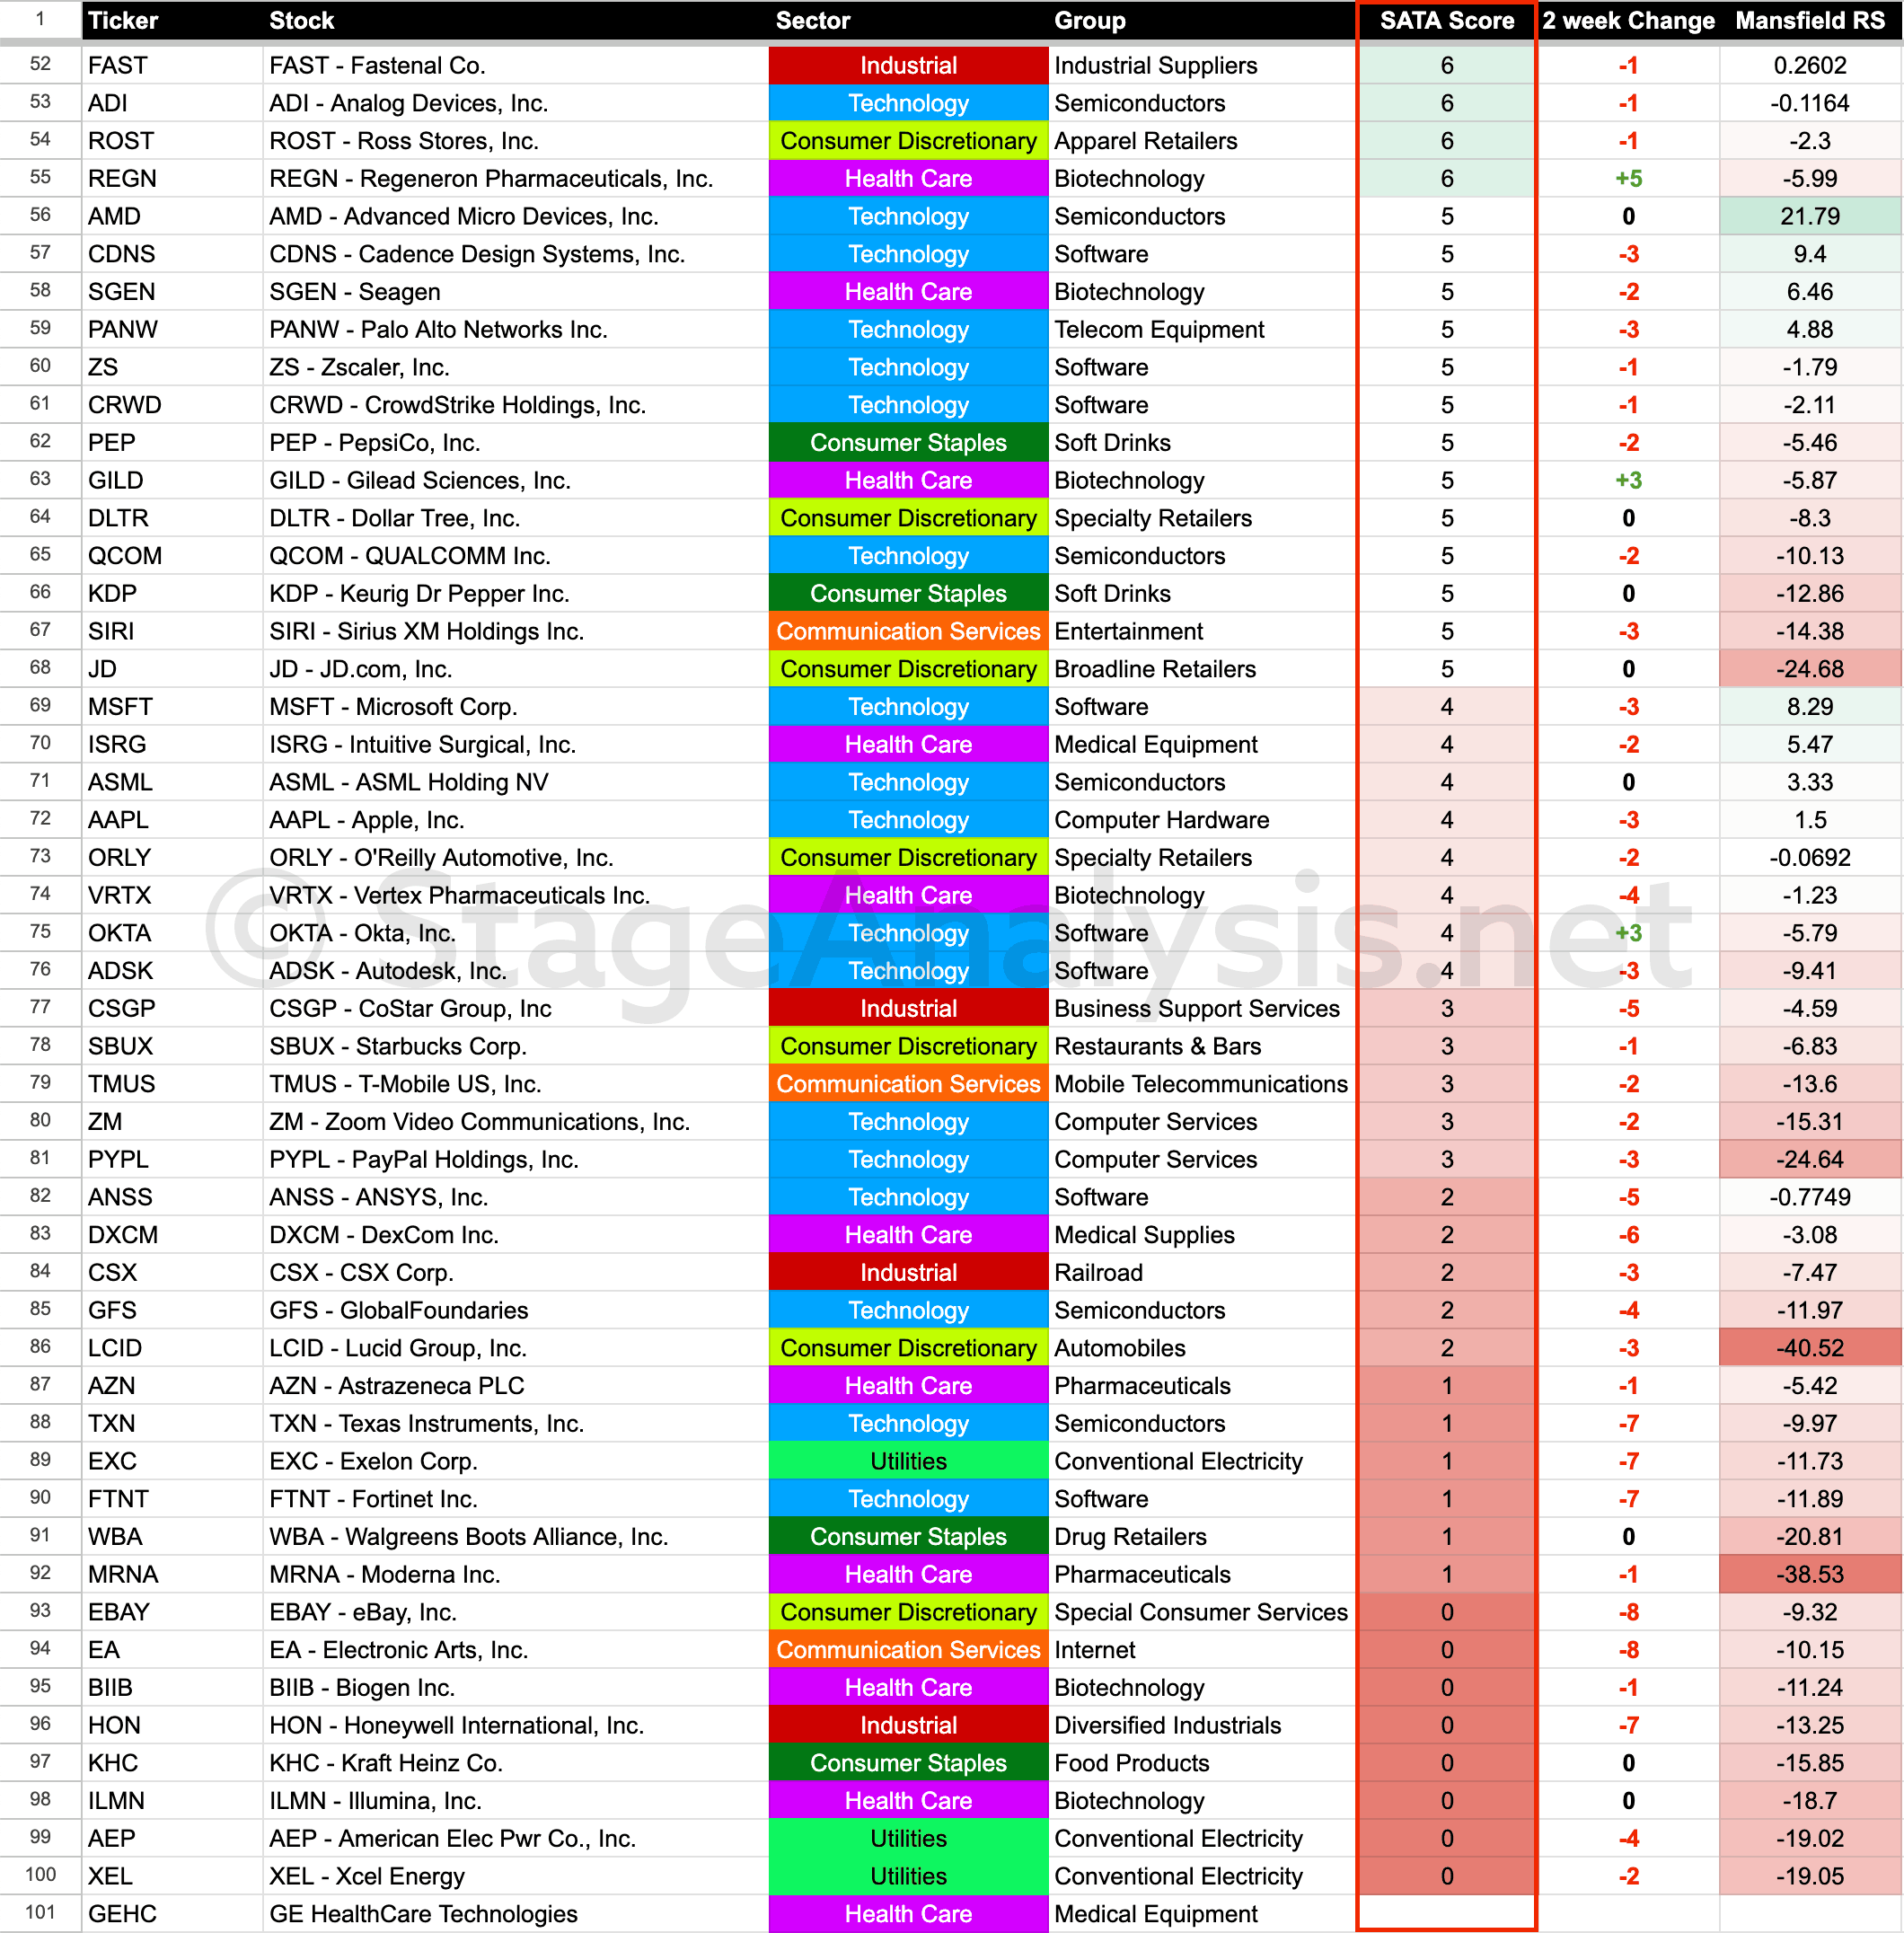
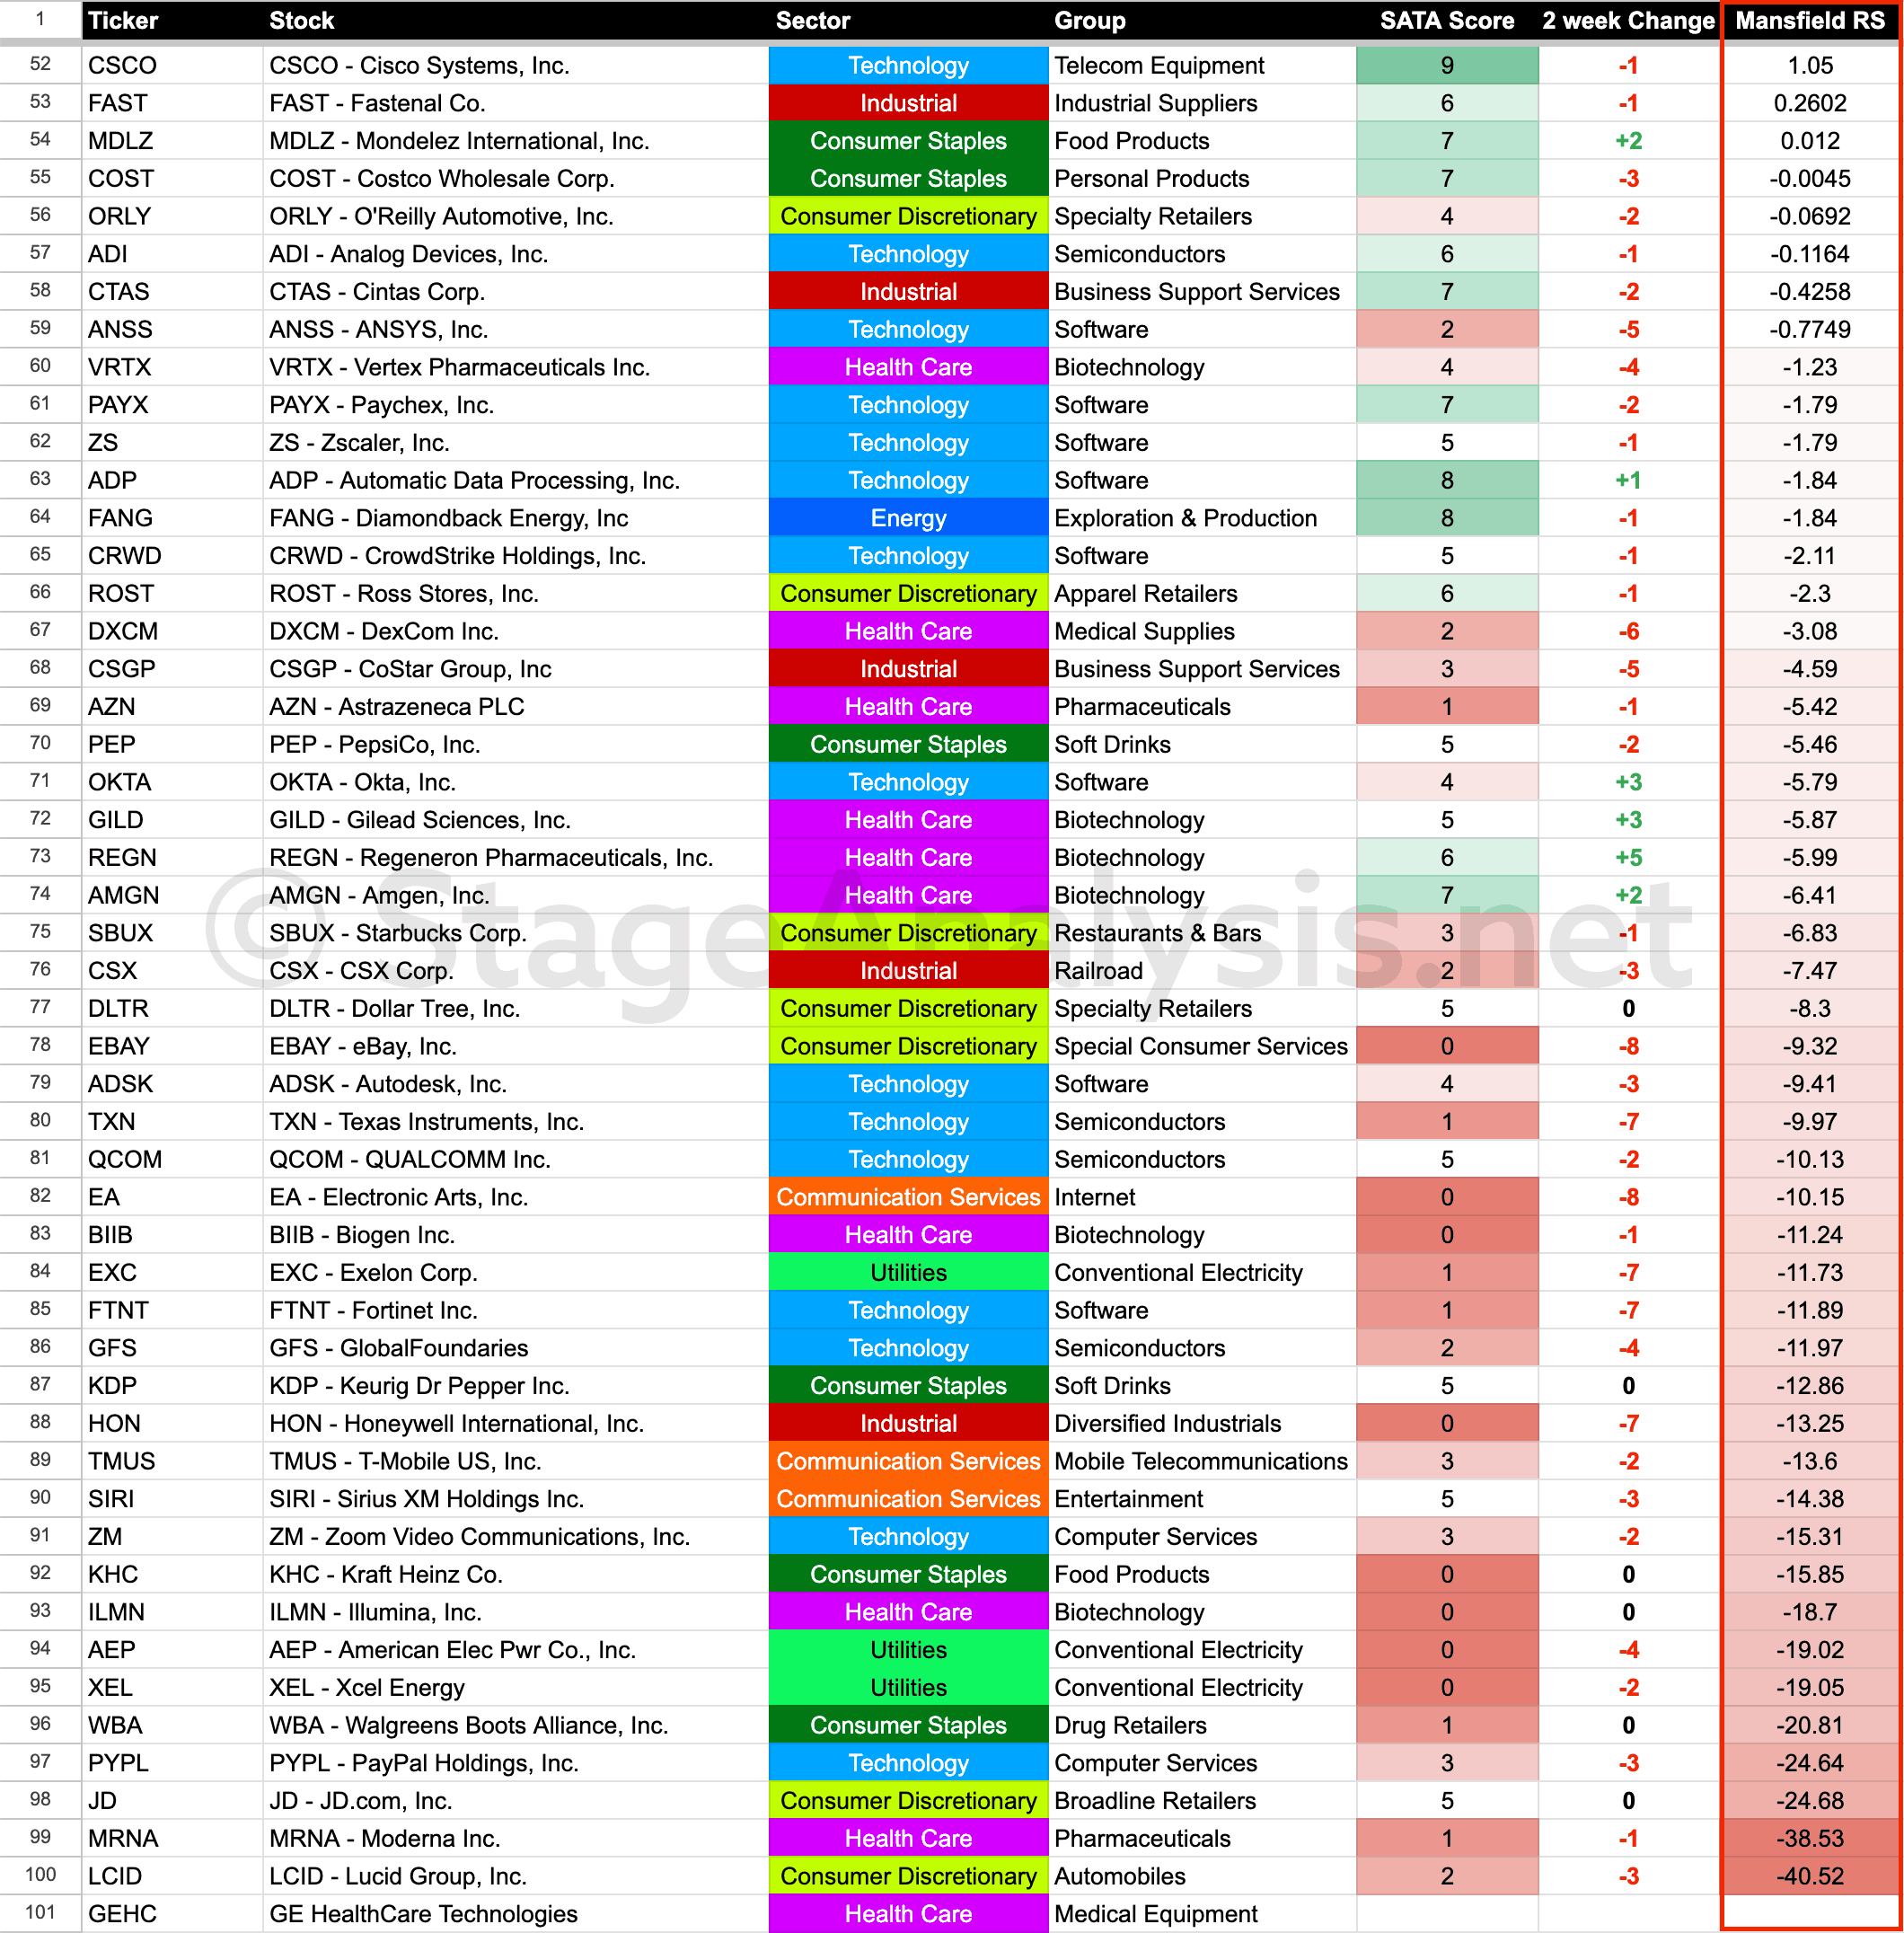
Ordered by Mansfield Relative Strength (RS) Score
The below table shows the Nasdaq 100 stocks ordered by relative strength using the Mansfield Relative Strength score. So for example NVDA is the current strongest stock in terms of relative strength score, and also has SATA score of 8. Whereas LCID has the current weakest relative strength score, and also a weak SATA score of 2.

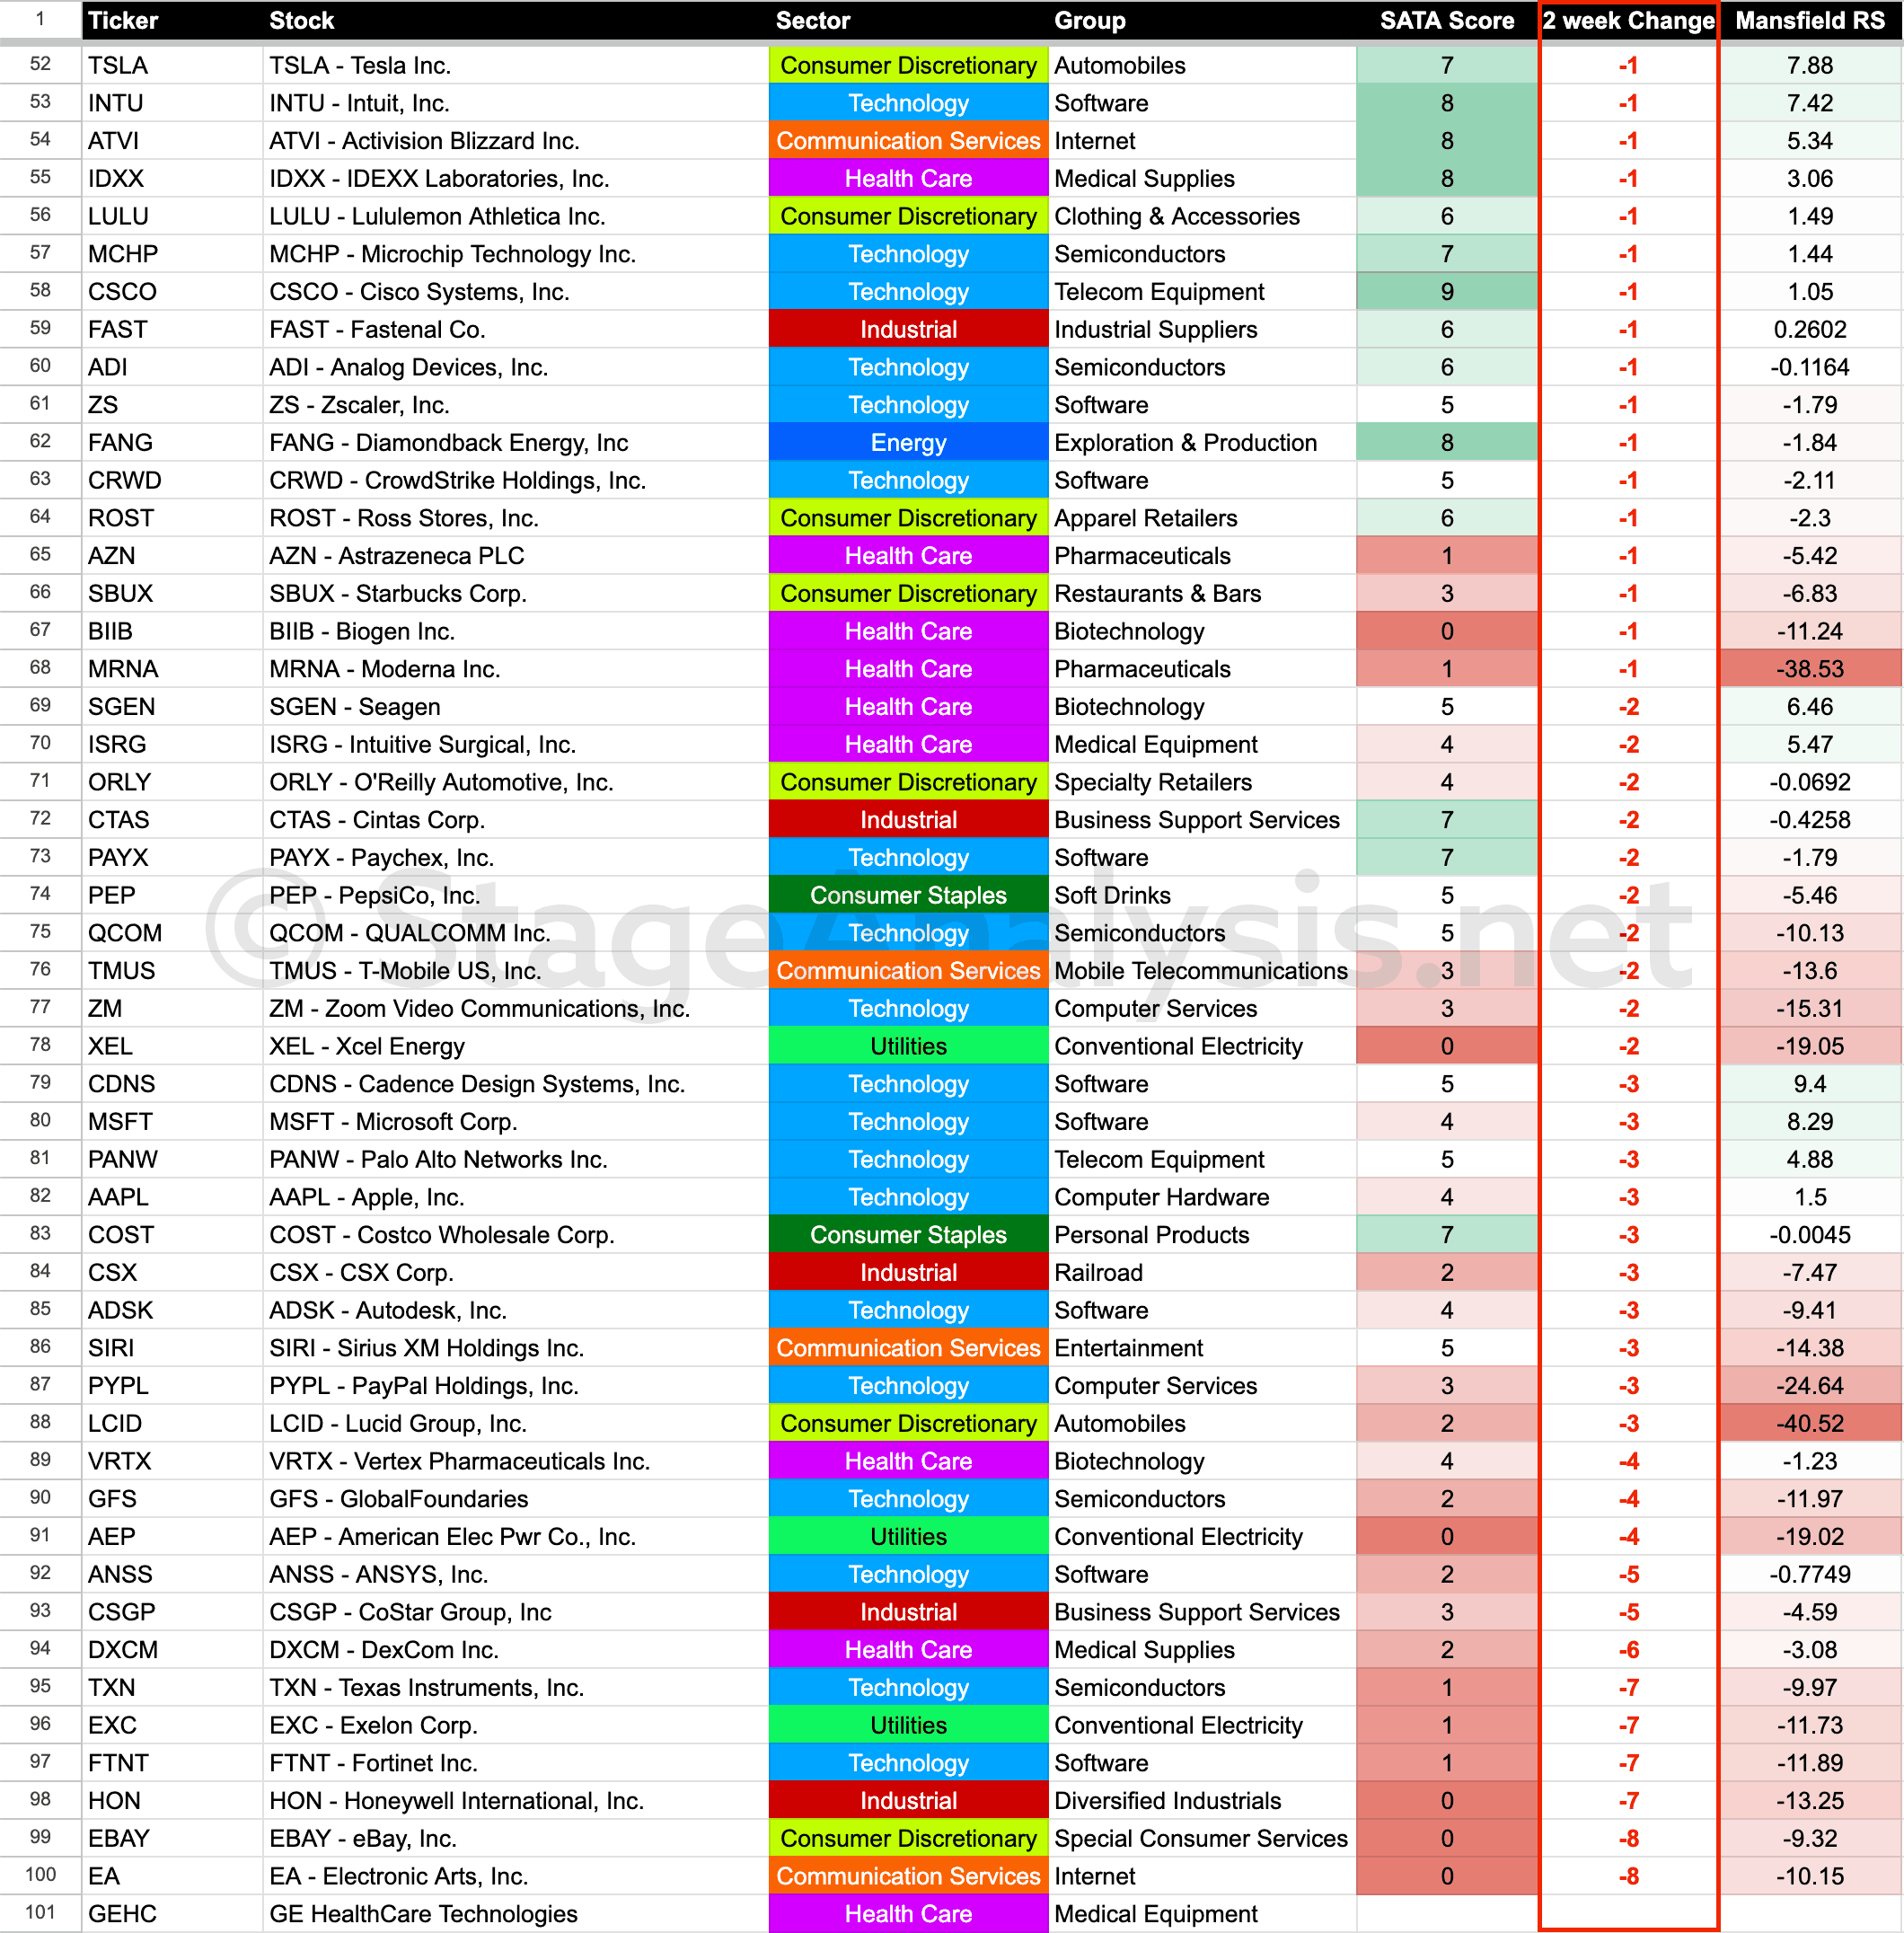
Ordered by SATA 2 Week Change
The final data tables order the Nasdaq 100 stocks by the amount of change in the SATA score since the last post two weeks ago. Which gives a different perspective, as you can see MELI for example has had the biggest SATA change of +6, as it's now on a SATA 8 and was previously on a SATA 2. So it has moved dramatically from a weak technical position into a strong position in a short period, as it's attempting to make a Stage 2 continuation breakout.
Coming Soon – SATA Scores on the Website
The initial SATA tool for the website is getting closer to being ready. But it is a challenging project that's already taken 8 months to develop so far. But once complete, it will make the SATA scores available for the whole US market on the Stage Analysis website, and in time potentially other markets too. Which will give Stage Analysis members the ability to see the SATA scores and changes on a daily basis and then make use of that information.
There's multiple ways that this data could be useful on both the long and short side of the market and also as market breadth data and charts. So we are excited to get it up and running on the website. So stay tuned for more info about it the coming months, as we think that it will become an essential tool for people using Stan Weinstein's method.
Become a Stage Analysis Member:
To see more like this – US Stocks watchlist posts, detailed videos each weekend, use our unique Stage Analysis tools, such as the US Stocks & ETFs Screener, Charts, Market Breadth, Group Relative Strength and more...
Join Today
Disclaimer: For educational purpose only. Not investment advice. Seek professional advice from a financial advisor before making any investing decisions.