
Market Breadth: Percentage of Stocks Above their 50 Day, 150 Day & 200 Day Moving Averages Combined
The full post is available to view by members only. For immediate access:
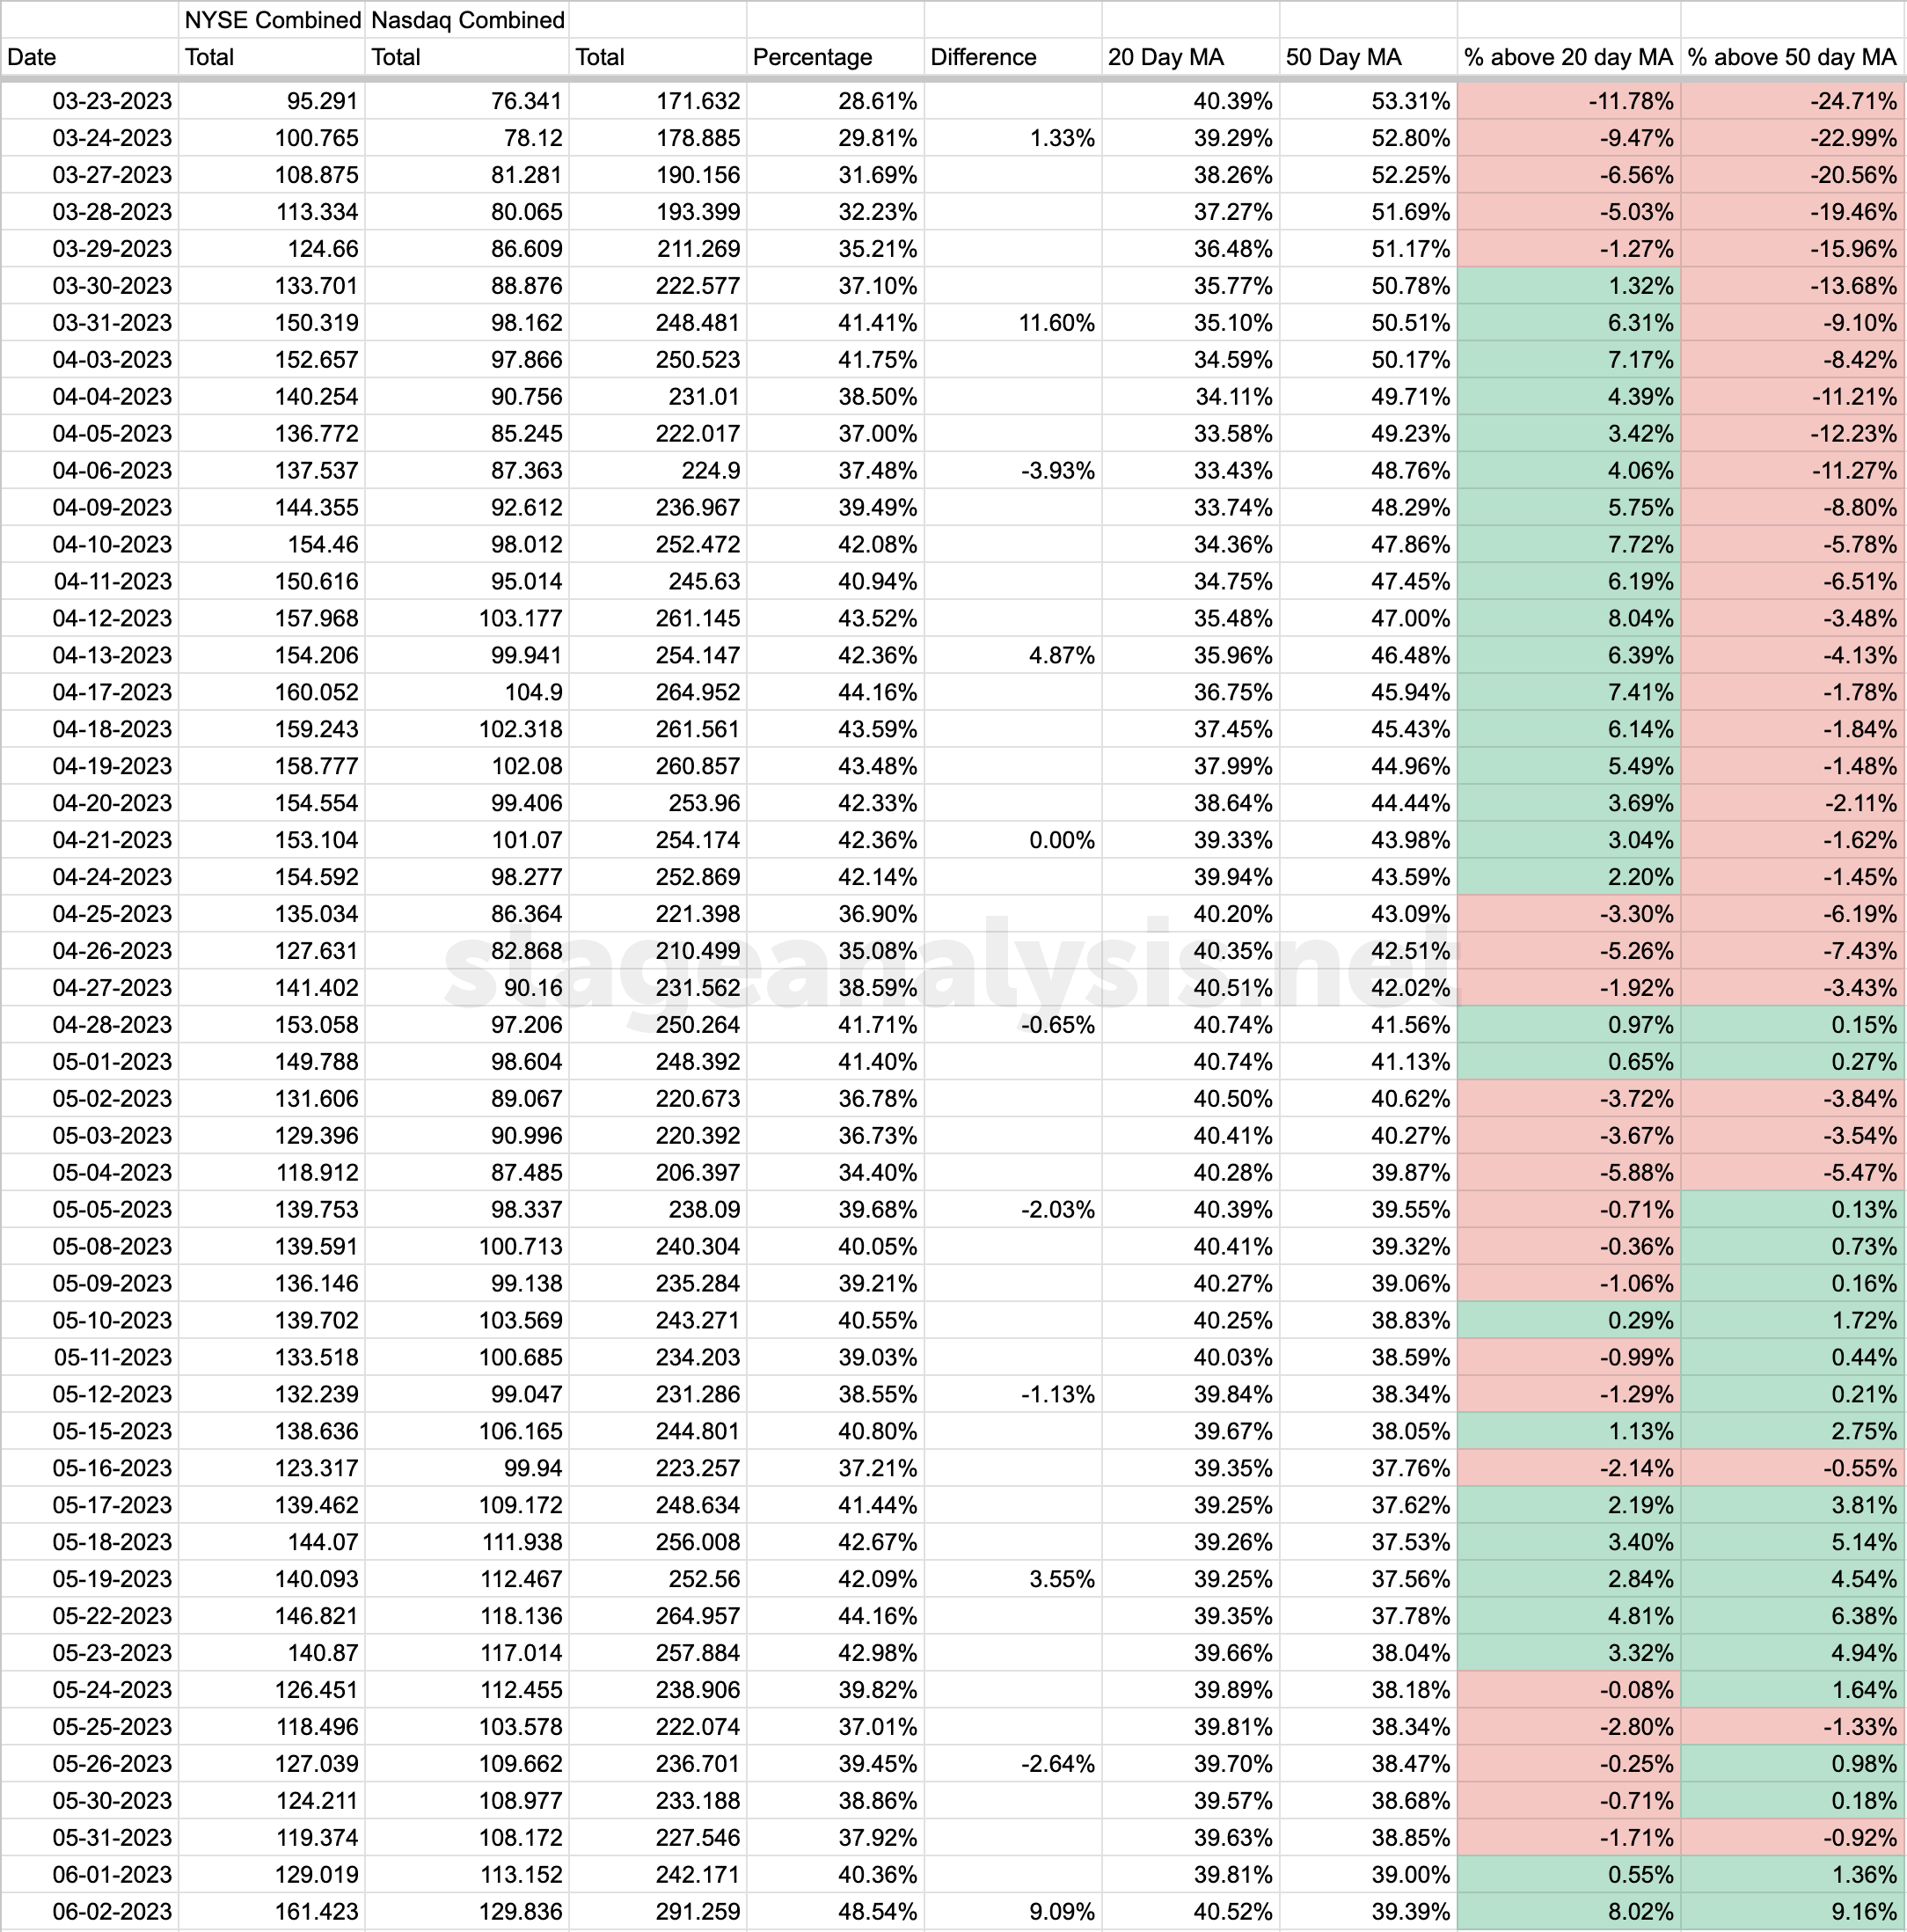
48.54% (+9.09% 1wk)
Status: Positive Environment (status change)
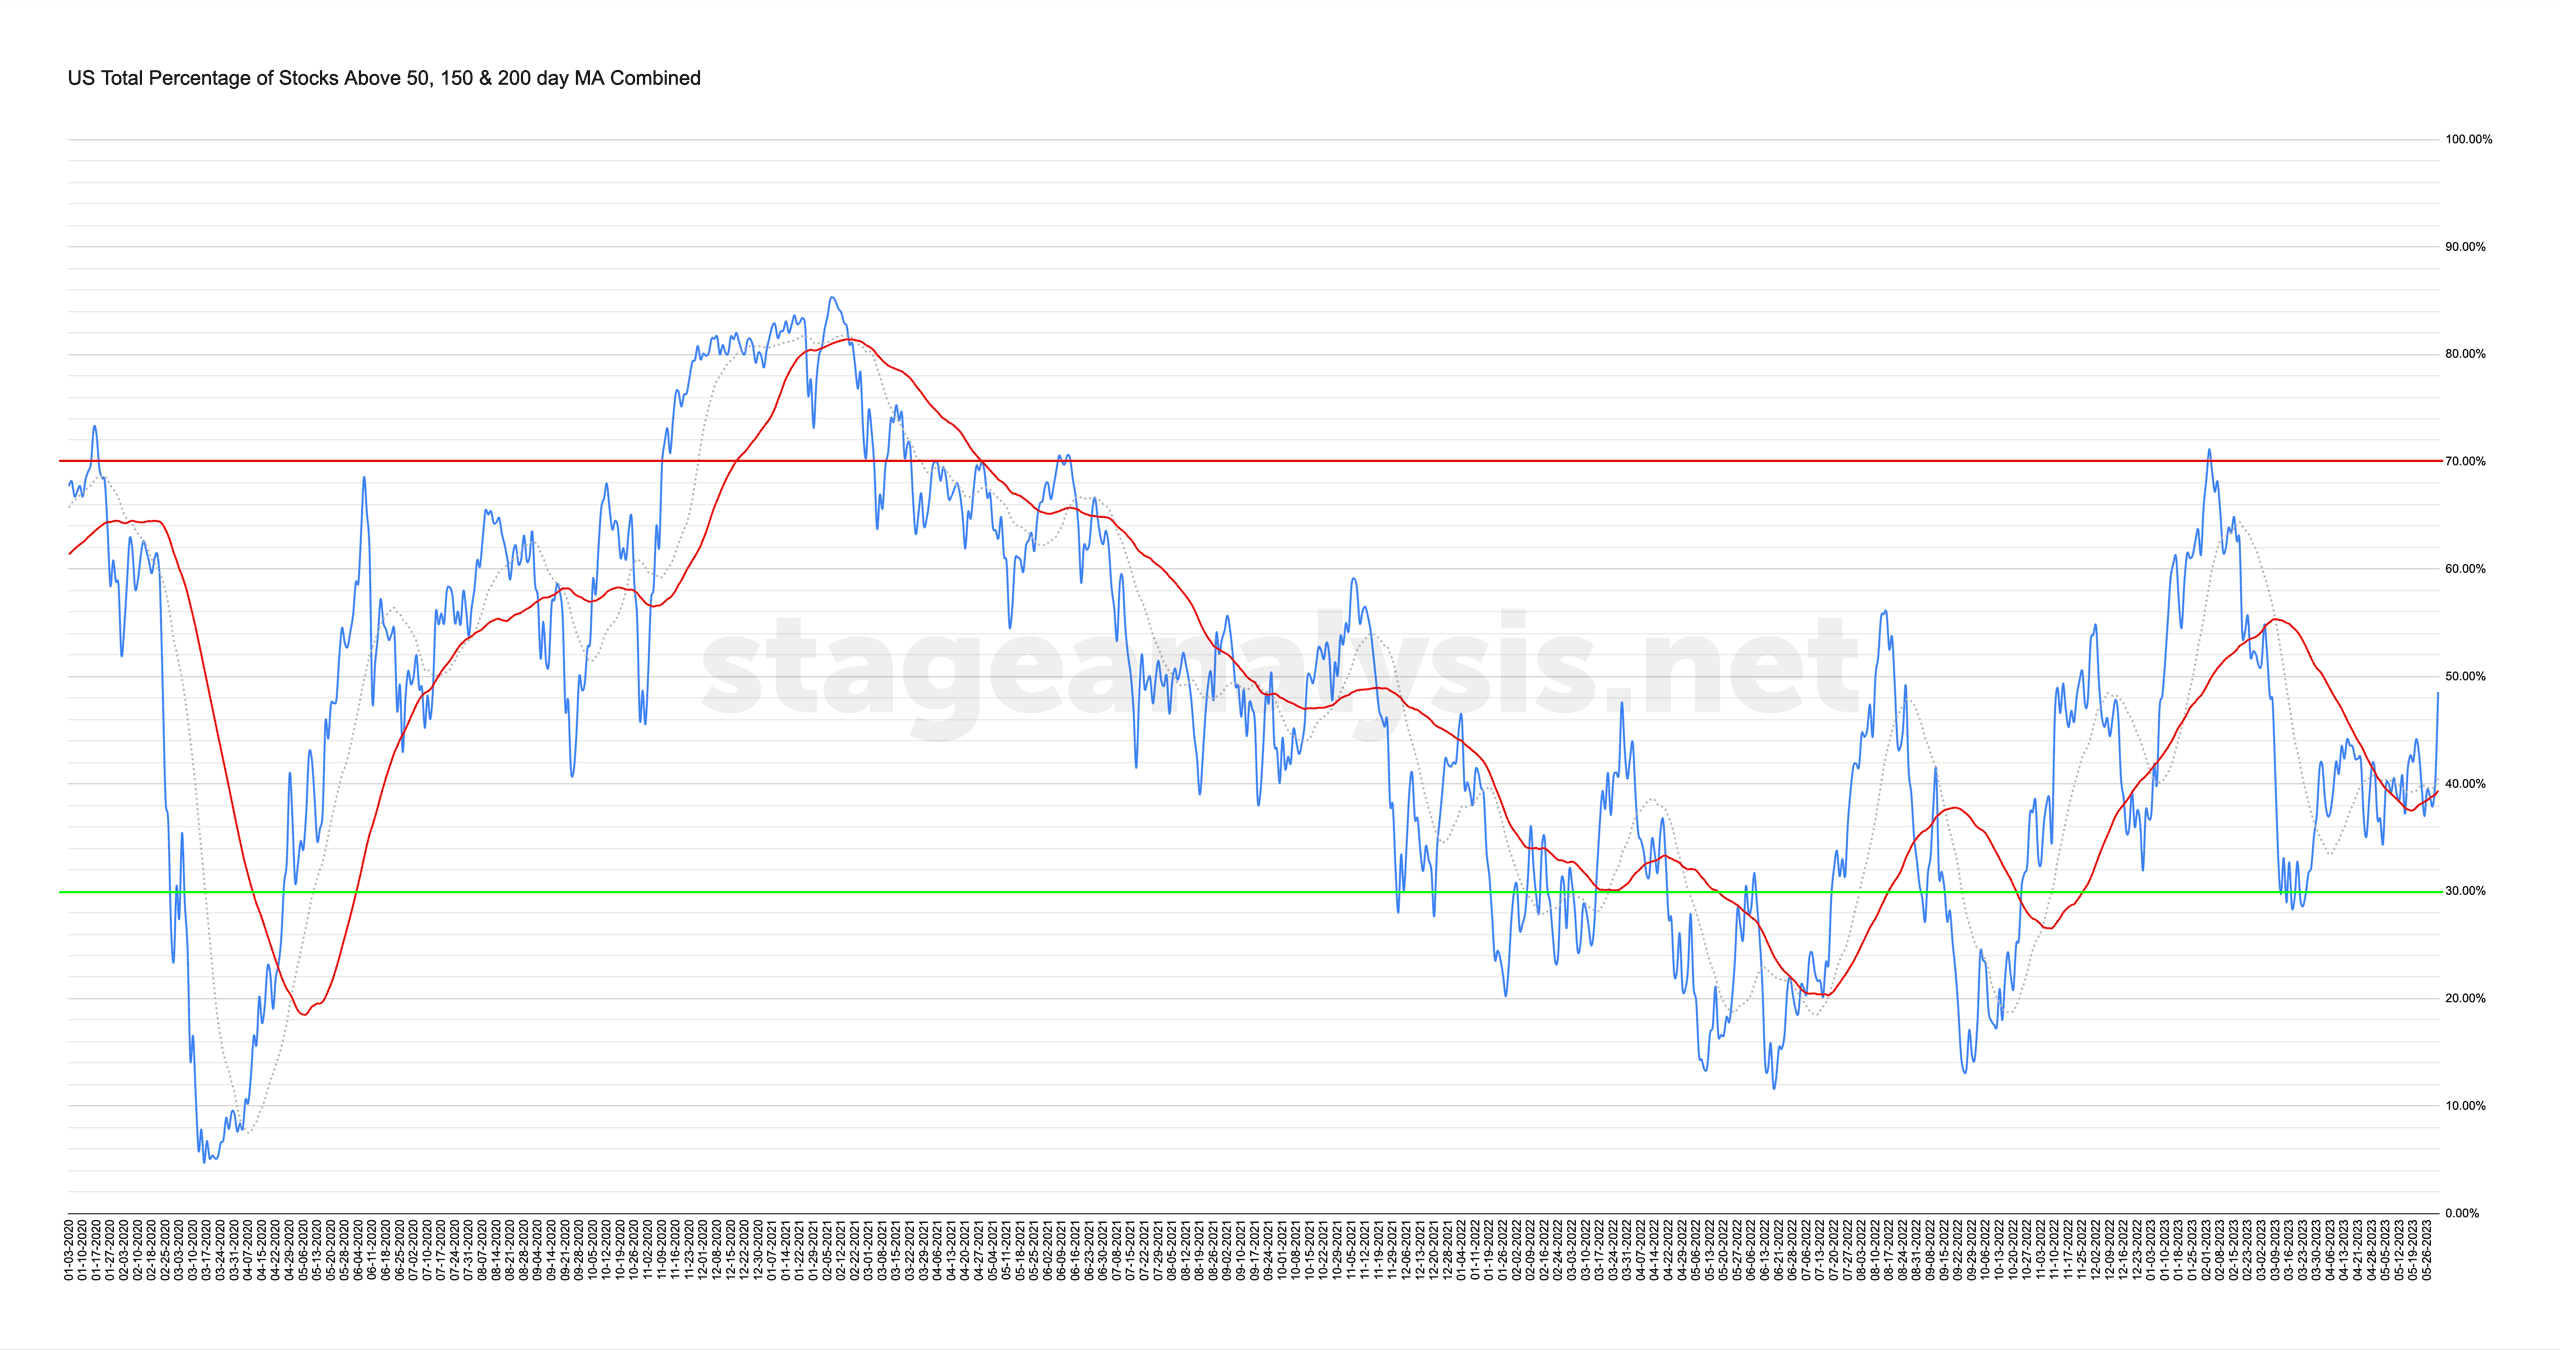
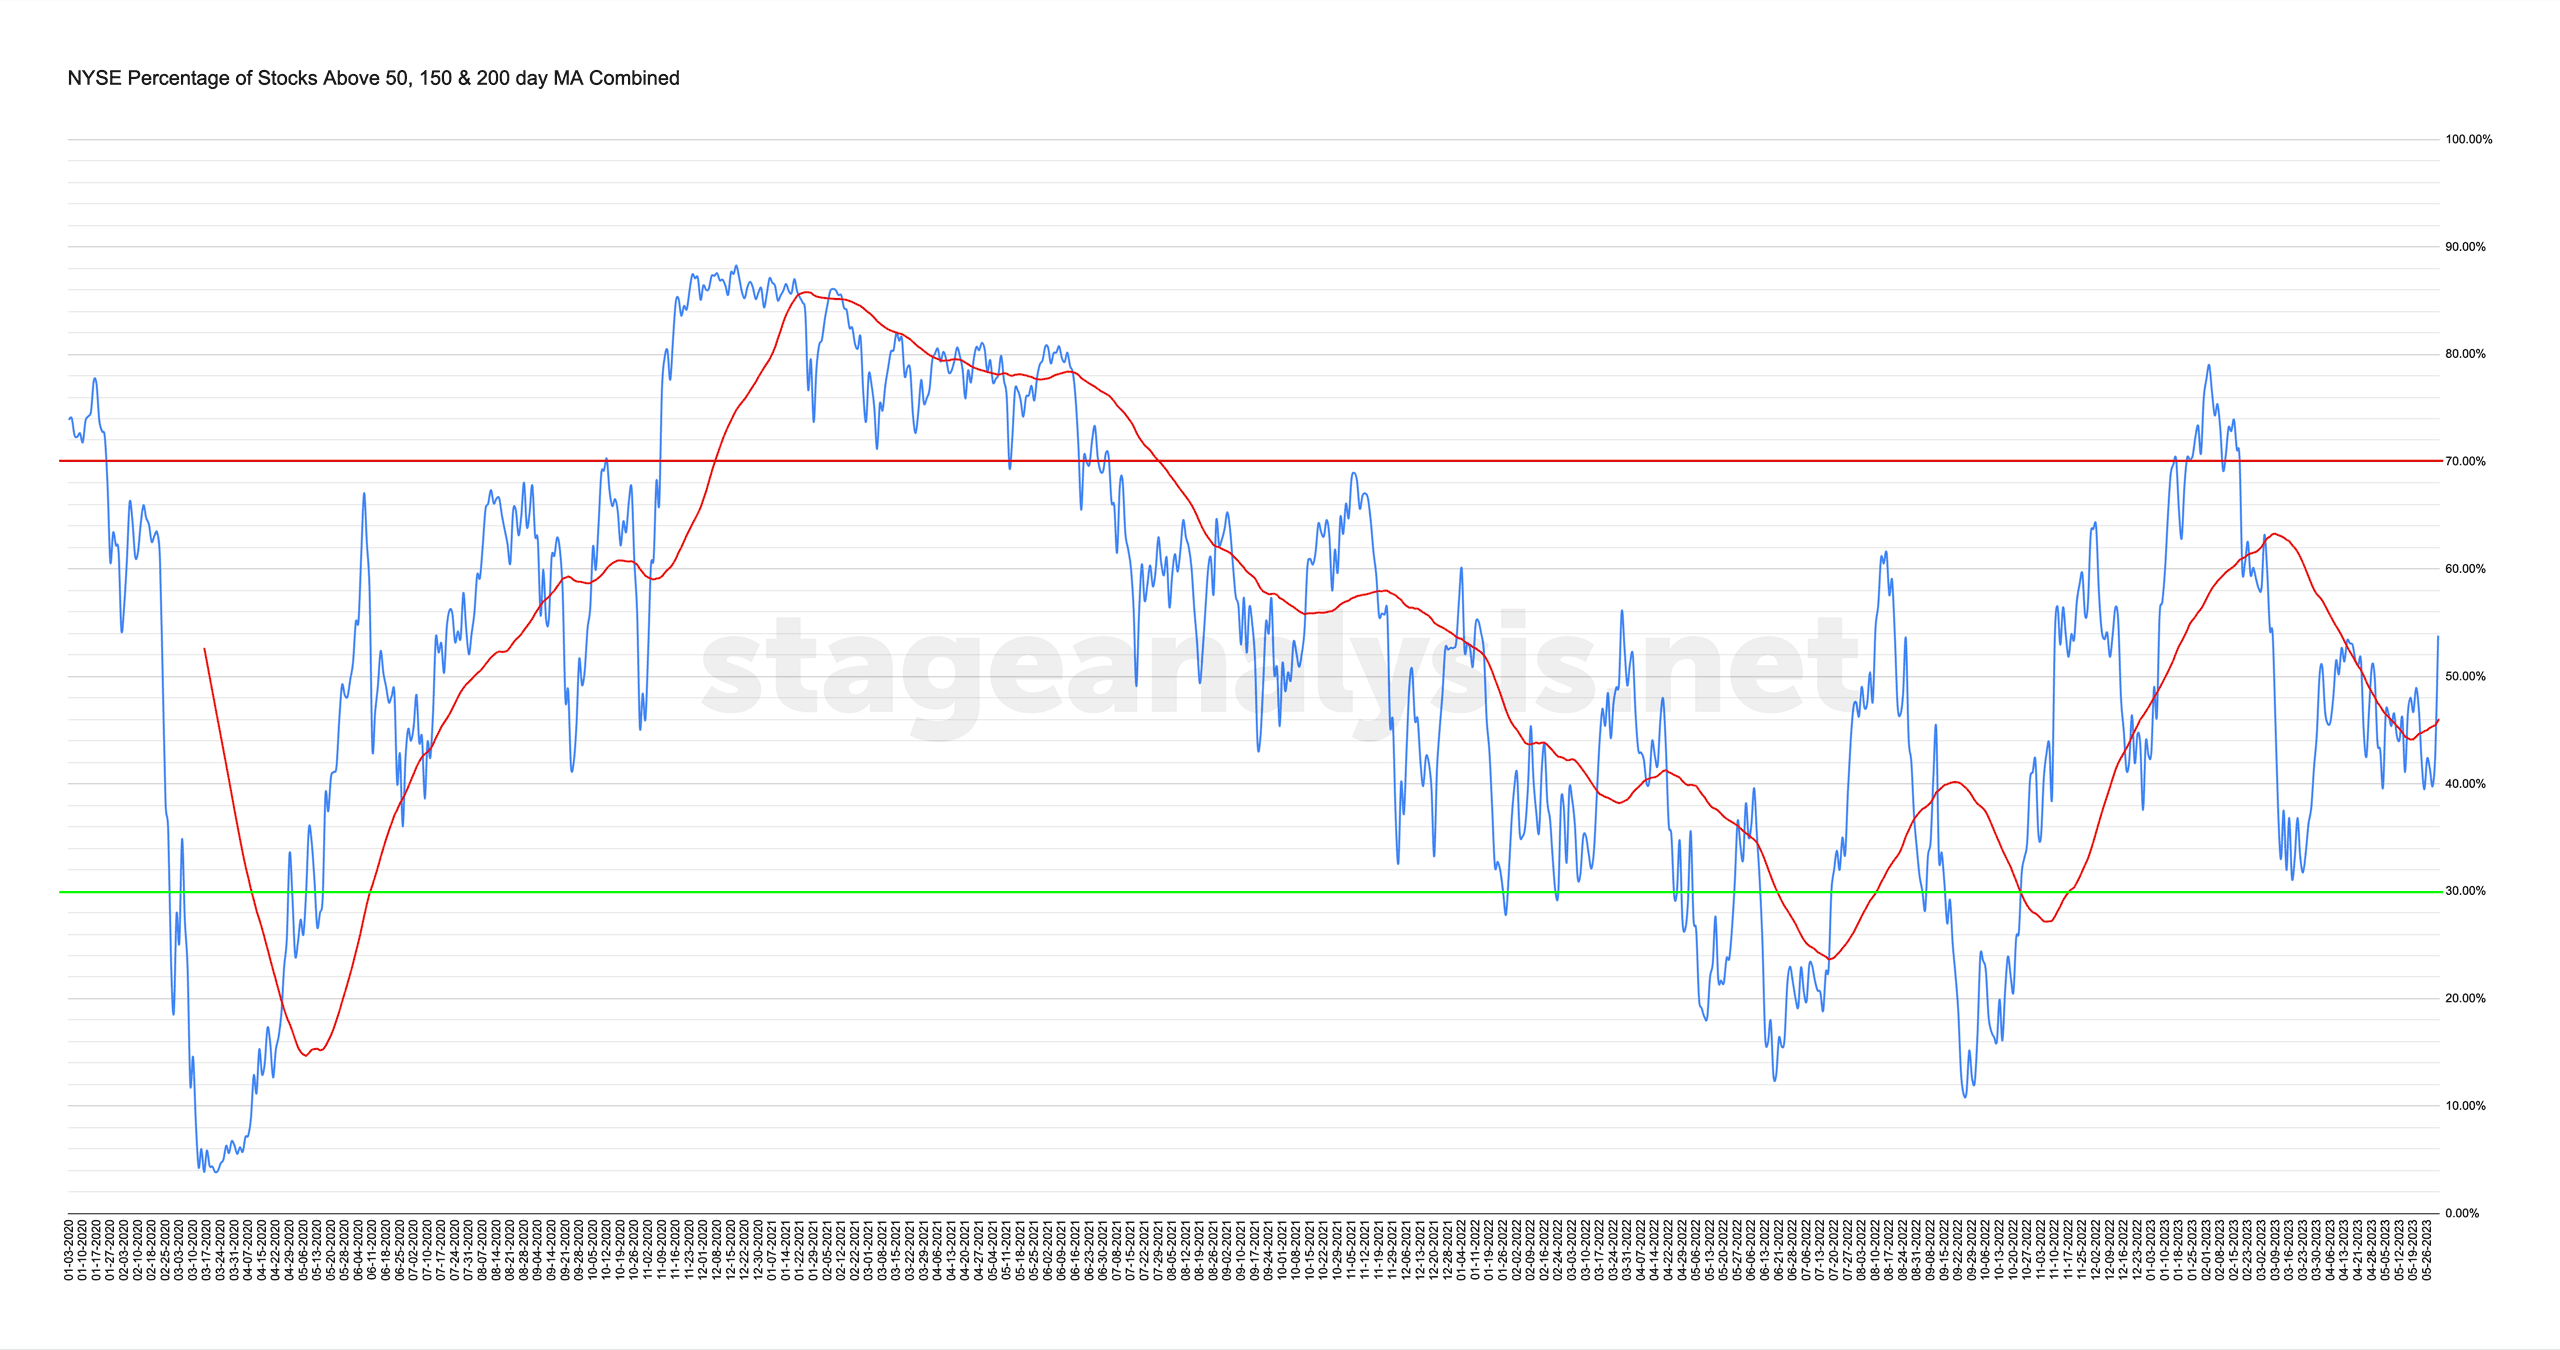
The US Total Percentage of Stocks above their 50 Day, 150 Day & 200 Day Moving Averages (shown above) increased strongly this week by +9.09%.
Therefore, the overall combined average is at 48.54% in the US market (NYSE and Nasdaq markets combined) above their short, medium and long term moving averages, which is in the lower-middle zone.
Of note this week, was the breakout above the April and May pivot high level of 44.16%. As Friday's increase cleared it by a significant margin, and hence the status has changed from a Neutral to Positive Environment status.
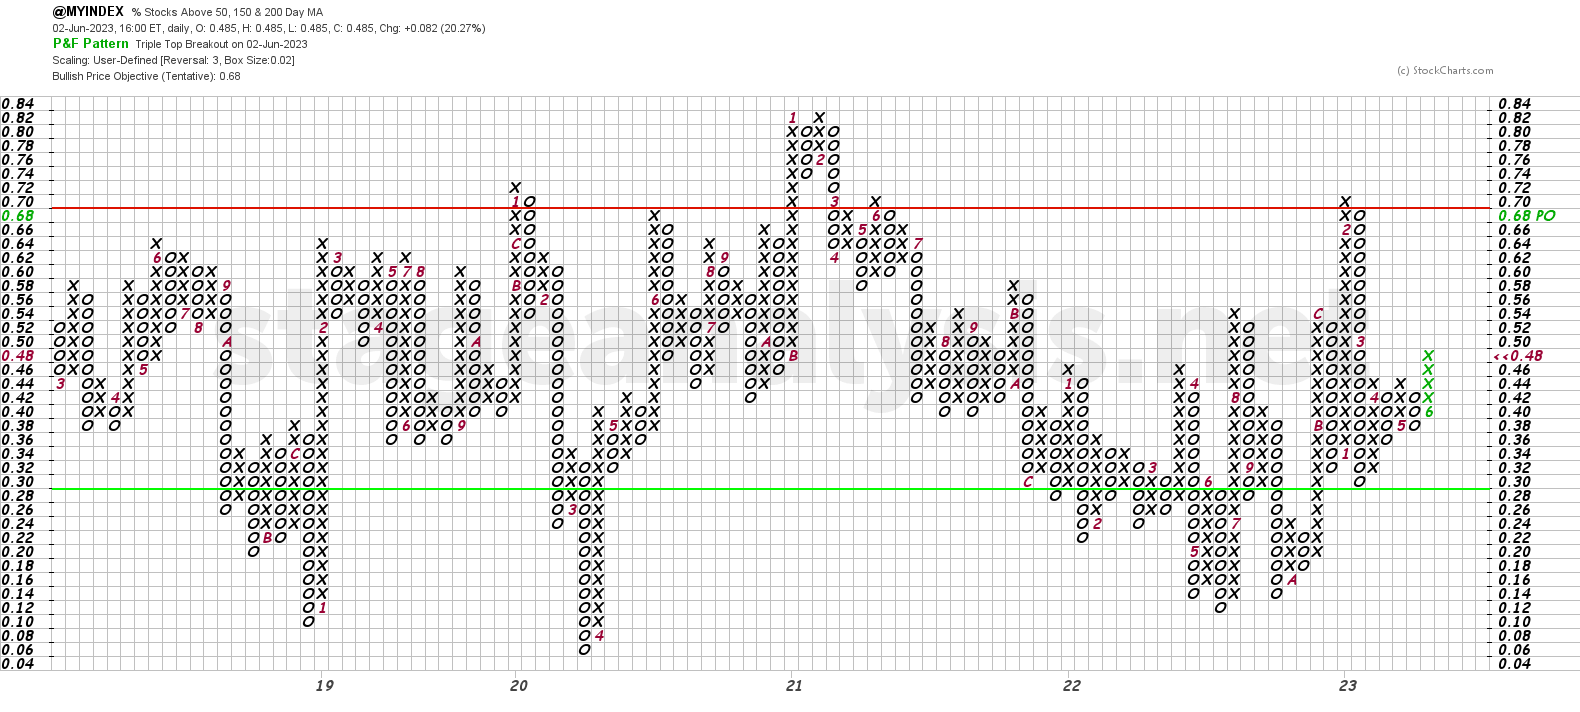
The Point and Figure (P&F) chart (shown above) reversed to a column of Xs on Friday, which changes the P&F strategy back to Offense (as it's in a column of Xs), and the overall average also made a triple top breakout, which also changes the P&F status to Bull Confirmed status in the middle of the field. i.e. you have ball and your offensive team is on the field in a very neutral field position.
Status on Positive Environment with P&F column in Xs in the middle zone.
- Offensive posture
- Point & Figure Bull Confirmed Status
- ETFs can be a lower-risk way to get exposure to certain groups, sectors or indexes if setups in individual stocks are lacking, and a way to increase exposure more quickly if market conditions improve, or as a way to hedge and to short via inverse funds.
- Progressive Exposure – testing the market on the long side. But only increasing exposure if account progress is made. i.e. no need to get more invested unless positive account progress is giving you a reason to increase your exposure.
- Focus on stocks with strong technical attributes (i.e. looking for A+ characteristics when analysing base structures / potential setups)
- Focus on strong and strengthening Relative Strength Industry Groups
- Looking for Stage 2 Breakouts and Backups, Stage 2 Continuation Breakouts, Earnings Gap Significant Bars, constructive pullbacks, consolidation, Volatility Contraction Patterns (VCP), springs, and tight action in re-accumulation bases
- Hold leaders
- Sell laggards on rallies
- Set price alerts at key levels in stocks developing Stage 1 bases and re-accumulation base in Stage 2 with the strongest characteristics.
- Watch for signs of developing relative strength (i.e. groups moving strongly up the RS rankings table).
- Build watchlists in groups showing signs of accumulation and building constructive bases with strong volume coming into the stocks in the group. So that you are ready to act when the stocks reach proper entry zones in Phases C to E of the bases. Or late Stage 1 / early Stage 2
- Focus on risk management
- Overall strategy (based only this breadth data) flipped back to Offense again this week, with the P&F column reversal to Xs, and the line chart surging above its 20 day MA and 50 day MA, as well as breaking above the April and May pivot highs, and so the status changed to a Positive Environment. So suggests testing on the long side in the most promising groups at proper buy points, if they present themselves, while avoiding chasing short-term extended stocks/groups, as some leading groups remain very extended in the short-term. So even though the breadth has expanded a bit, we still need to continue to be selective, as the weight of evidence is still relatively neutral.
- Remember, always manage risk first. No matter what the market sentiment is.
*Not a recommendation to buy or sell securities. Information is for educational purposes only. See full terms and conditions.
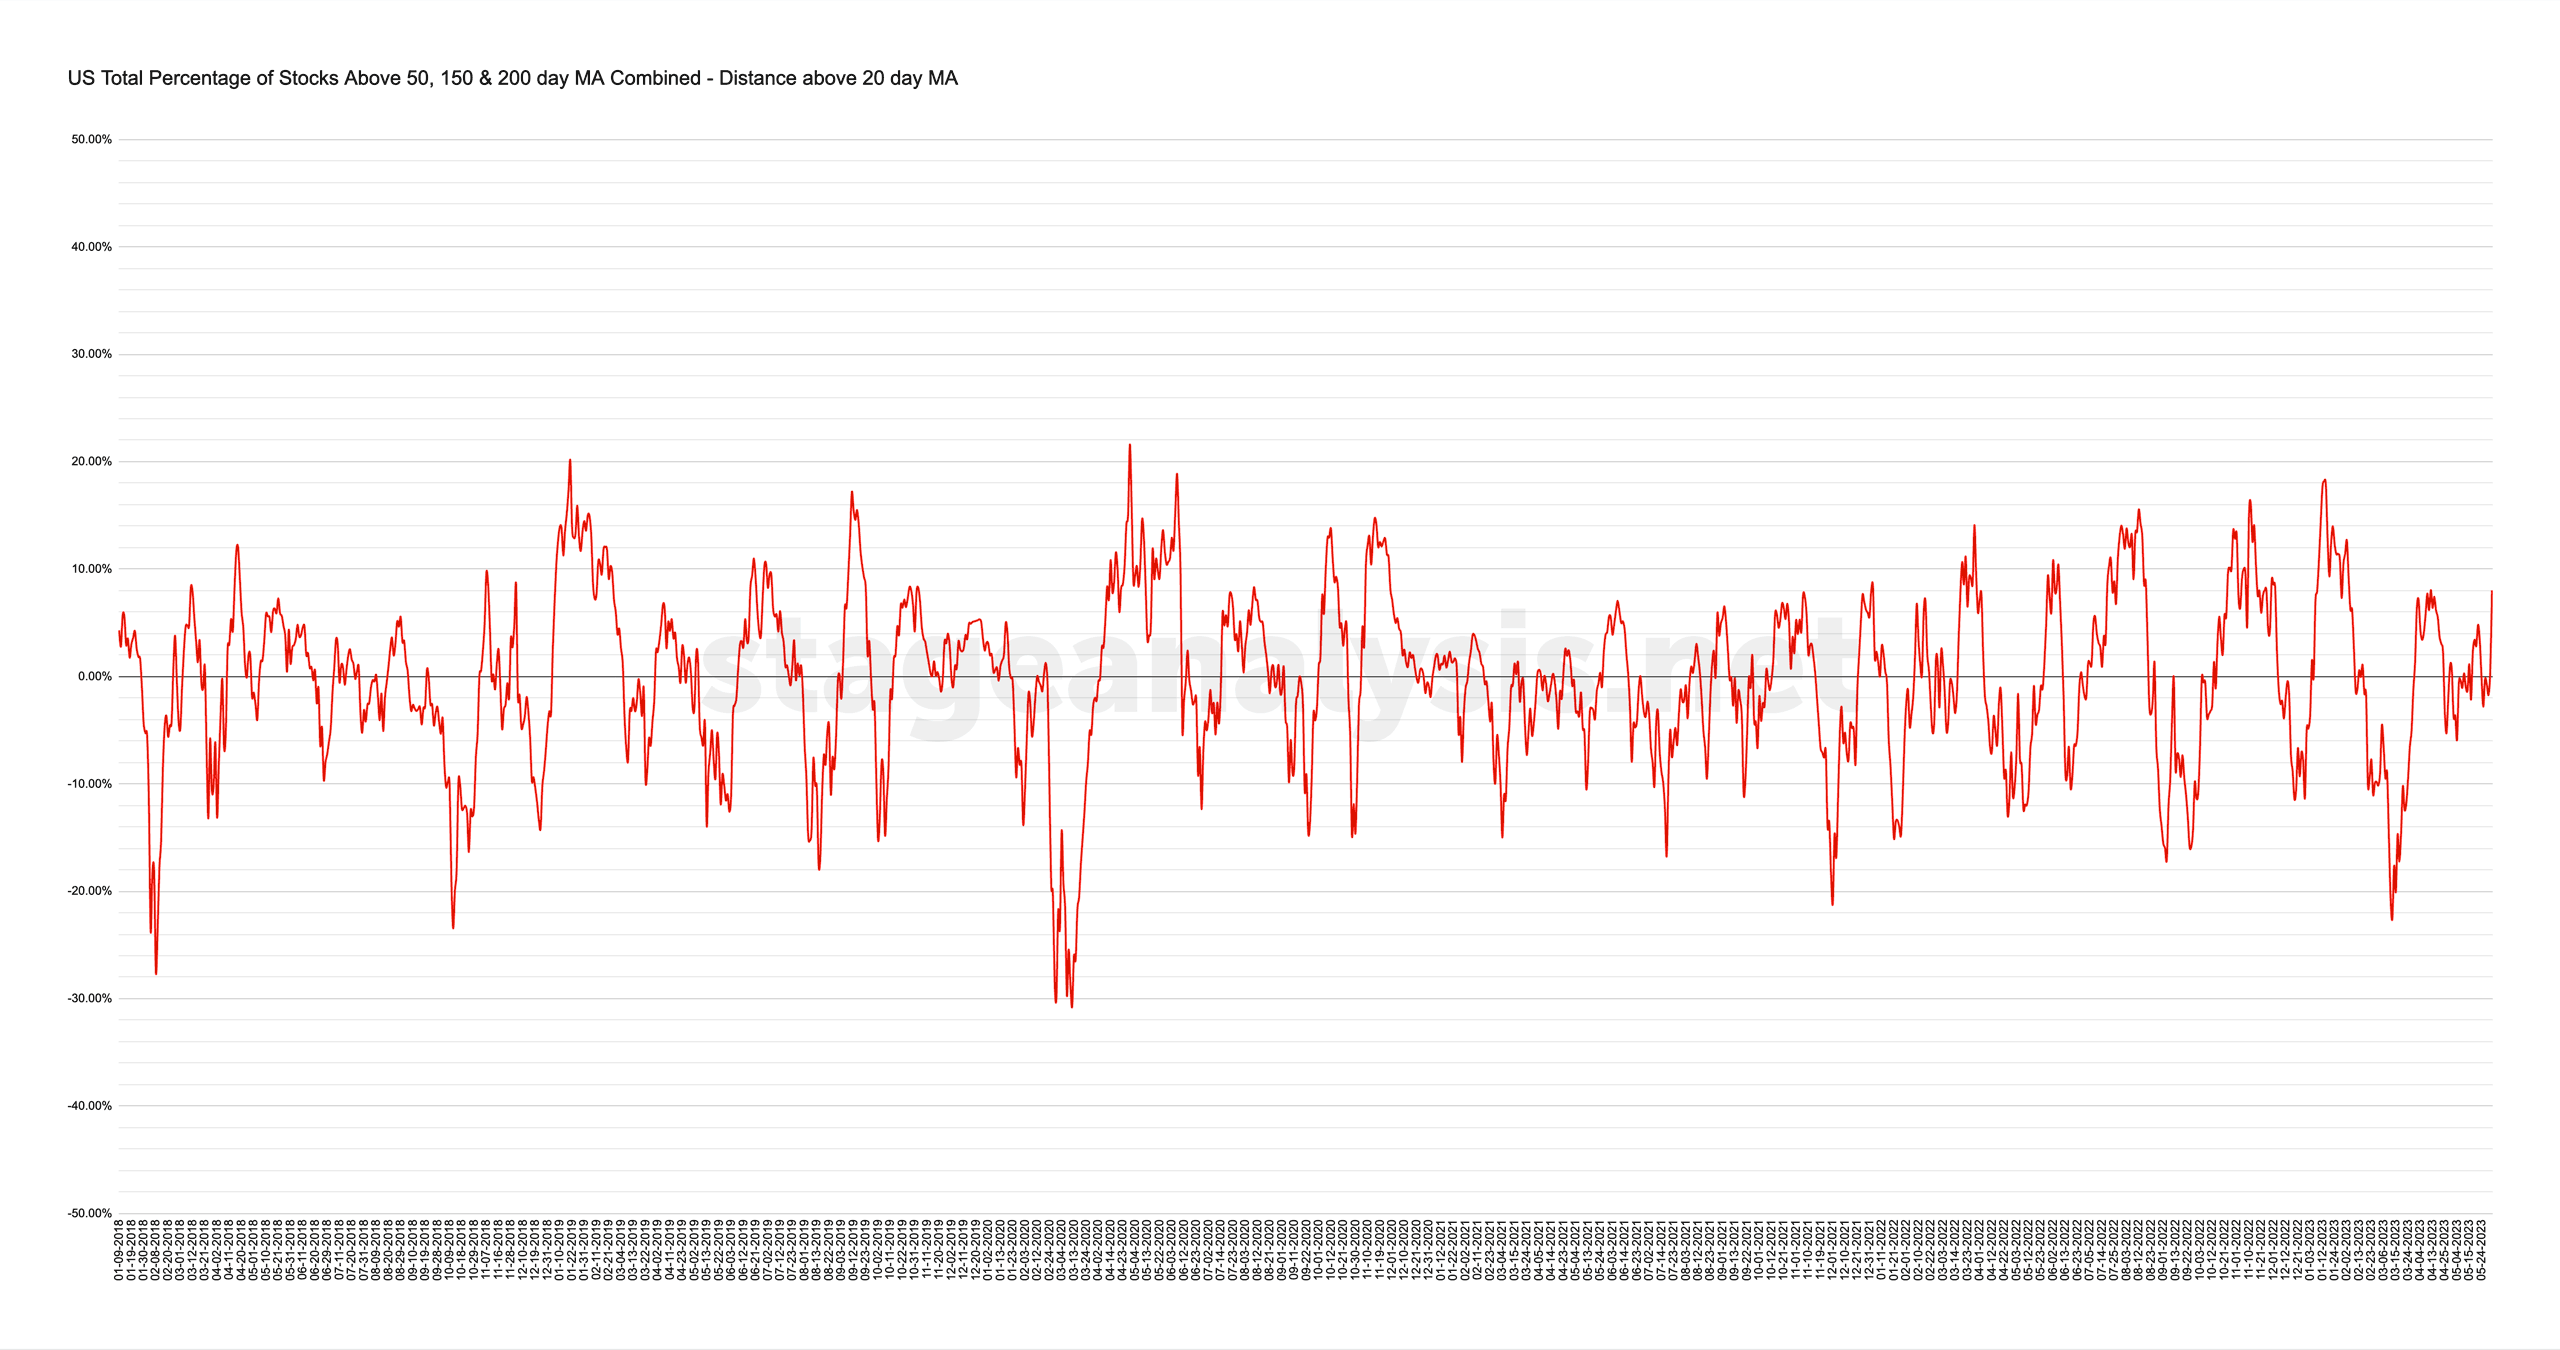
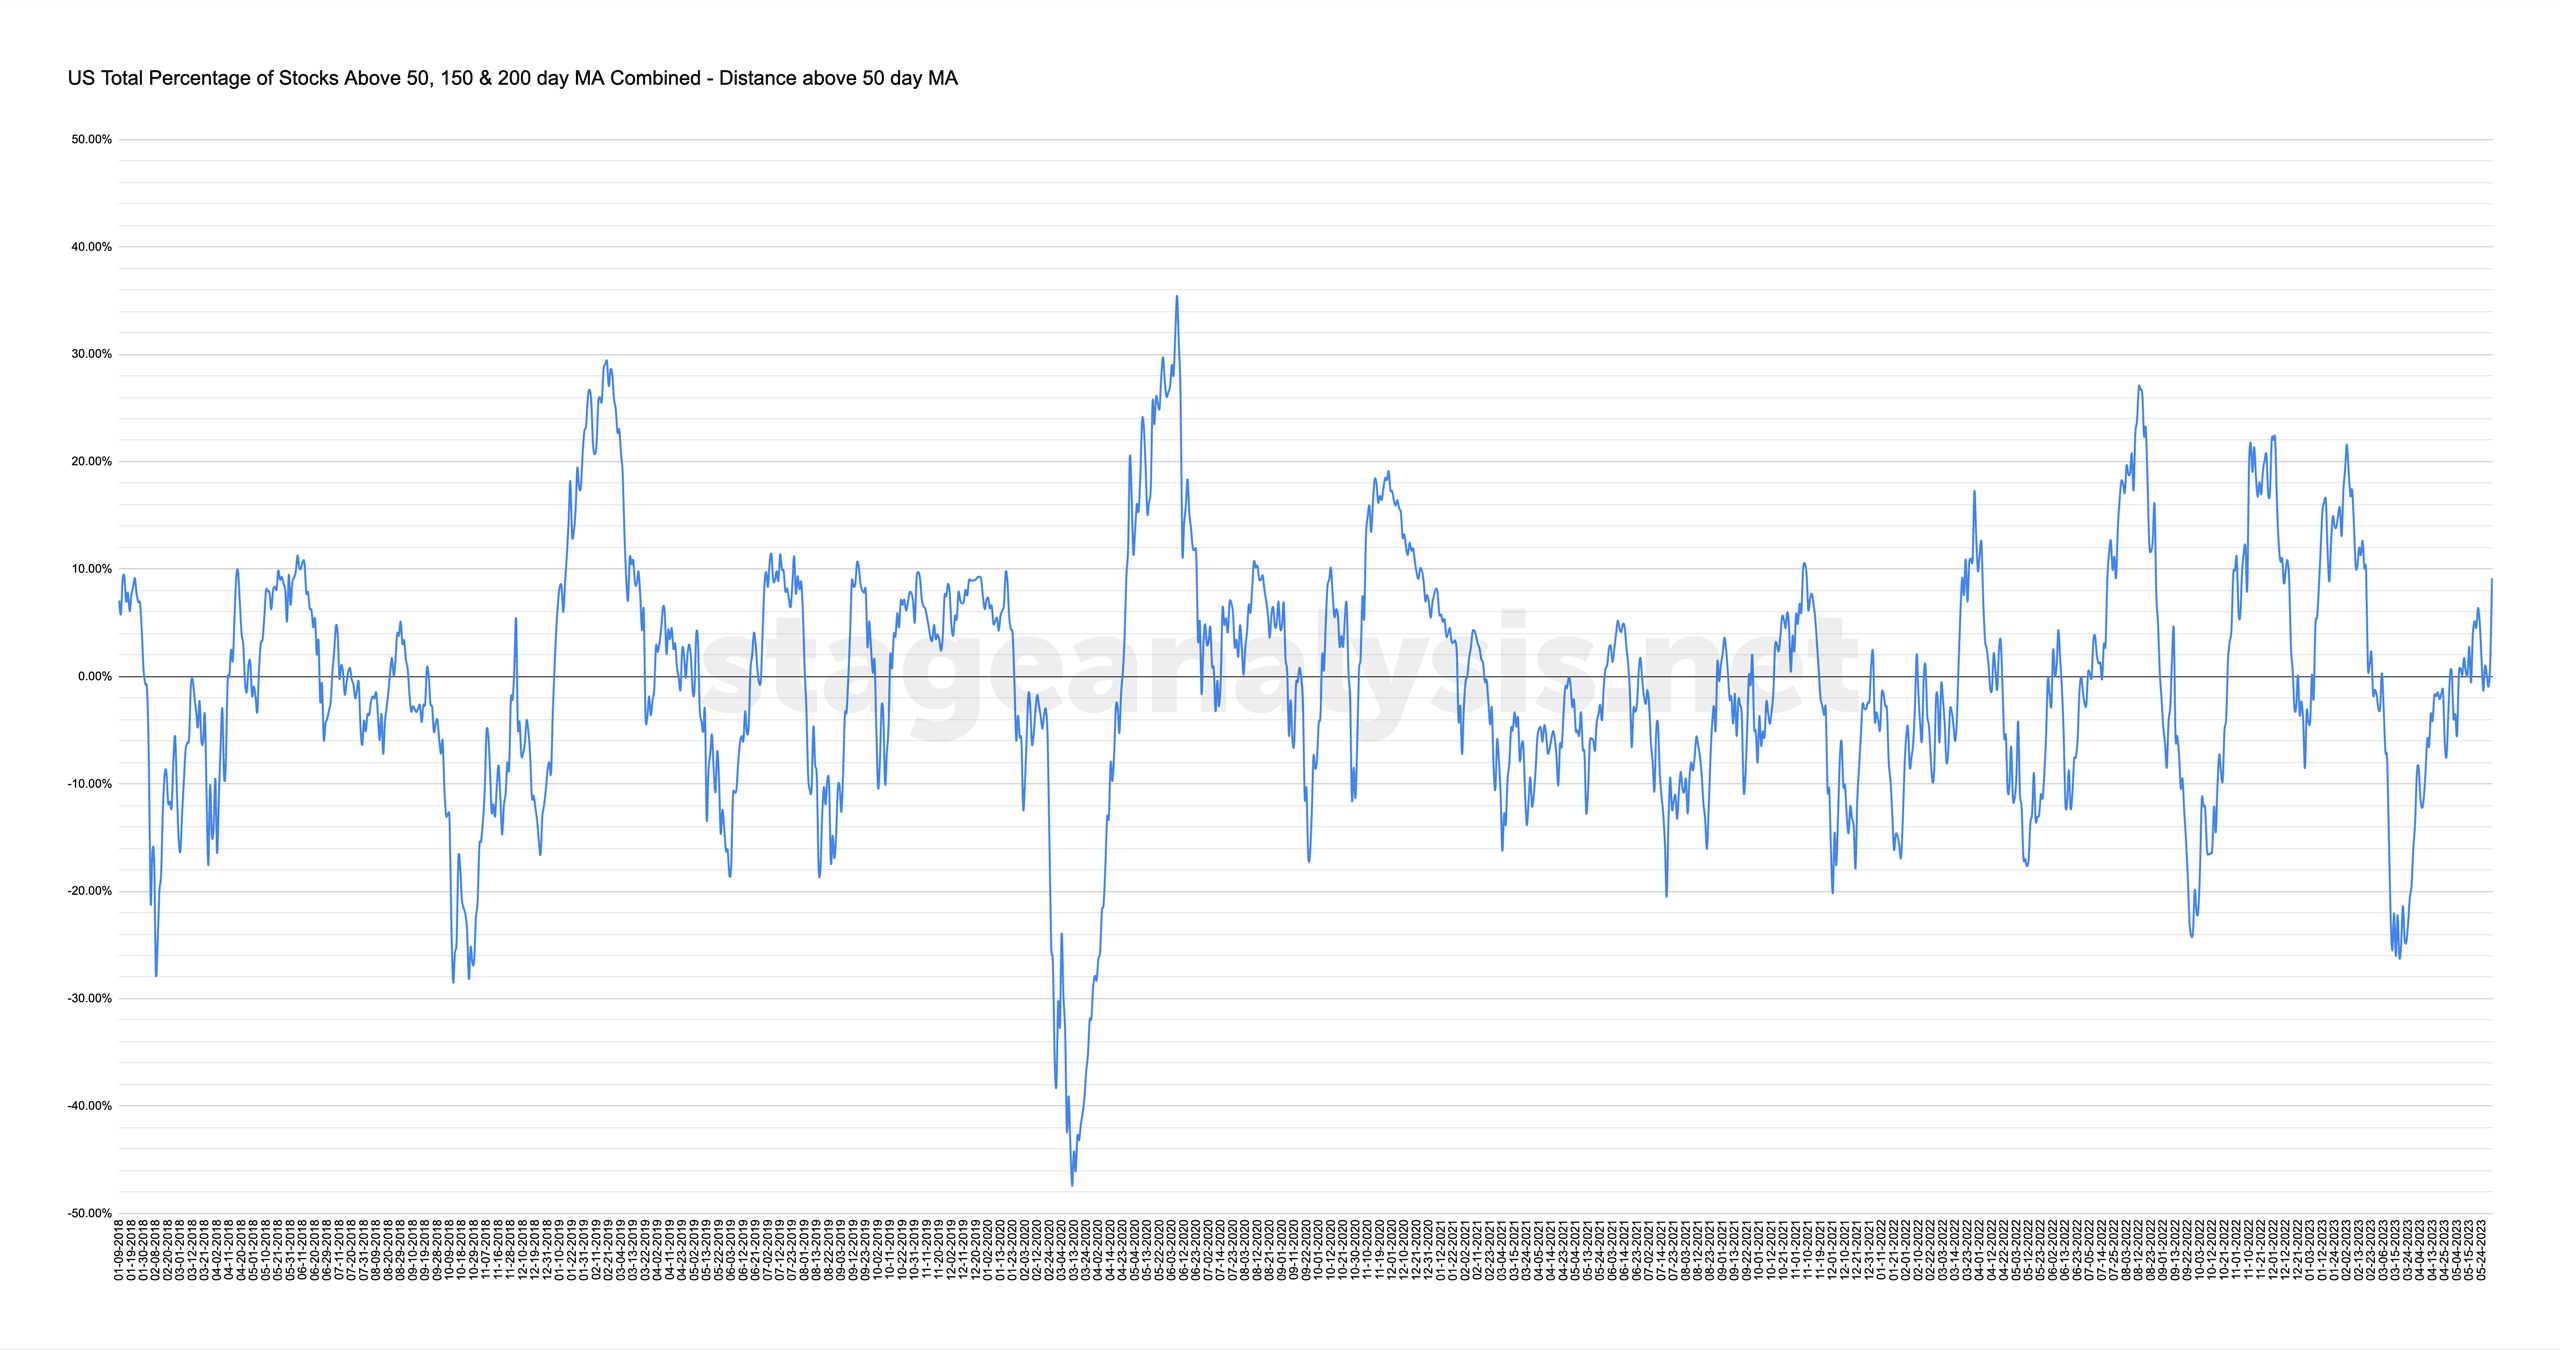
20 and 50-day Oscillator
These show the distance that the combined chart is from the 20-day MA and 50-day MA on the chart. Above zero is a positive environment and below is a difficult/negative environment.
NYSE Total % Stocks Above their 50 Day, 150 Day & 200 Day Moving Averages Combined
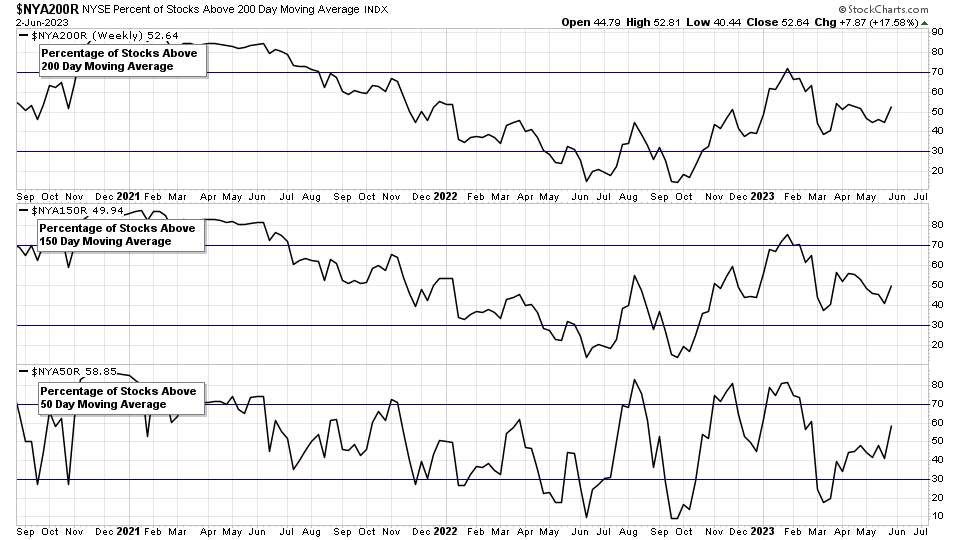
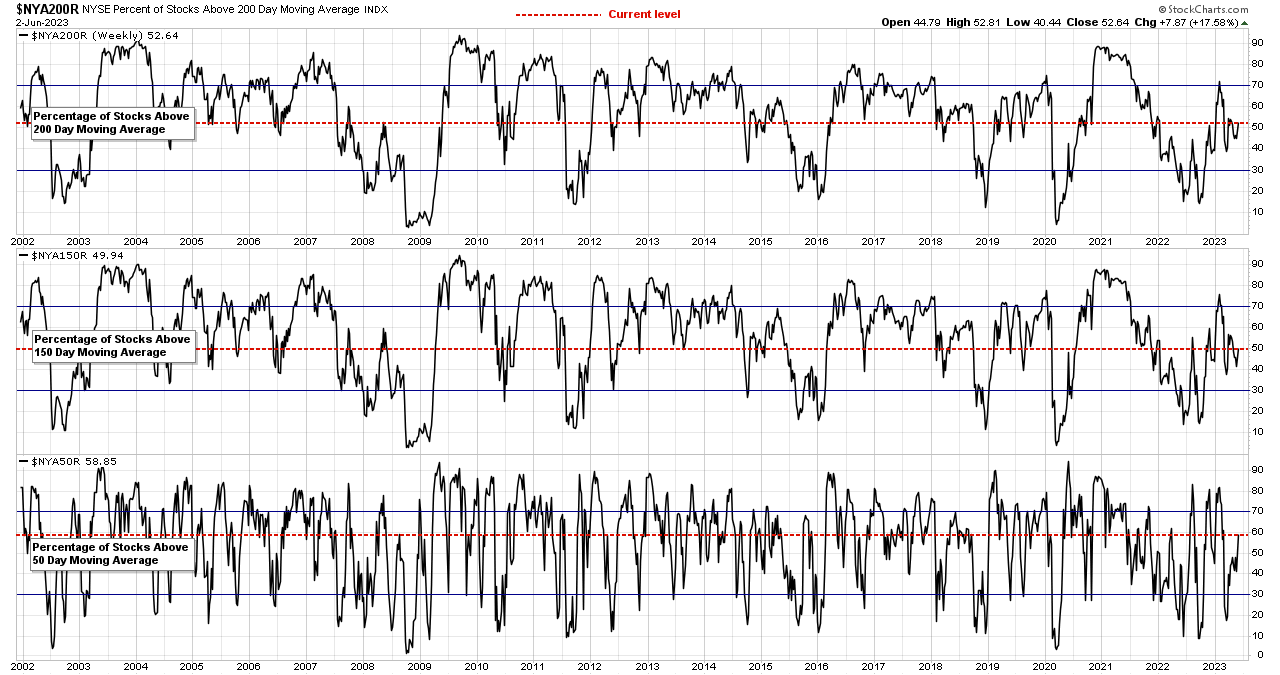
- Long Term: Stocks Above 200 Day MA: 52.64%
- Medium Term: Stocks Above 150 Day MA: 49.94%
- Short Term: Stocks Above 50 Day MA: 58.85%
53.81% (+11.46% 1wk)
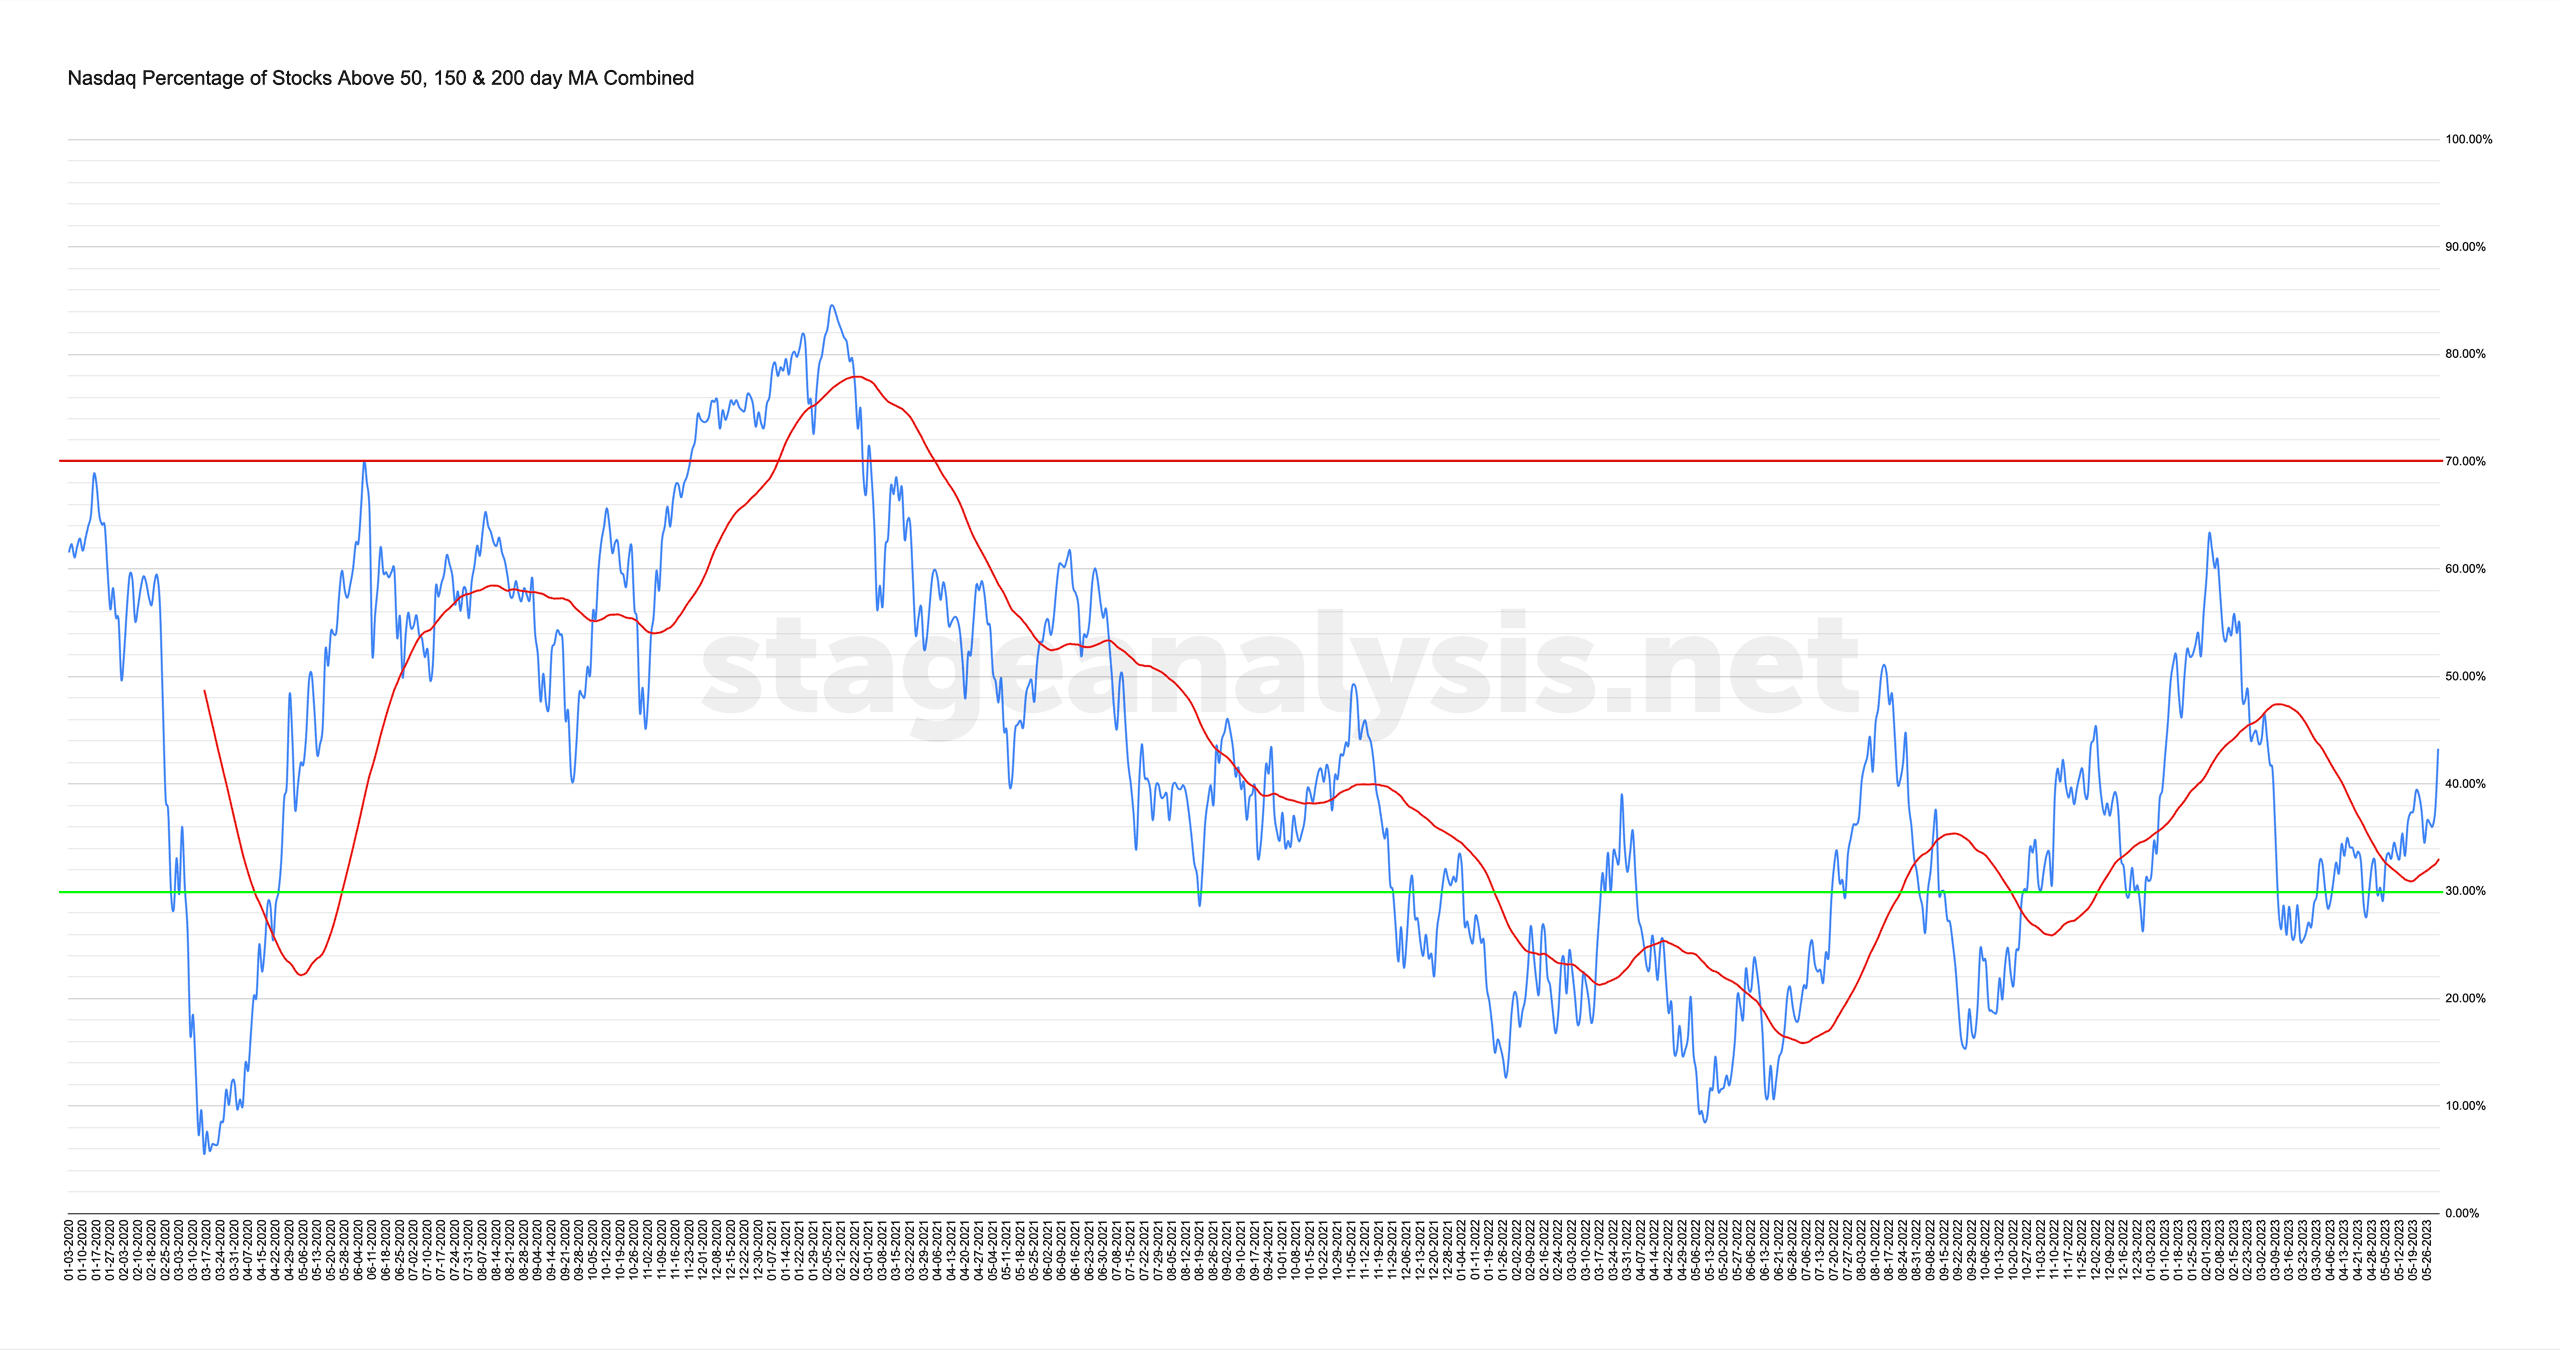
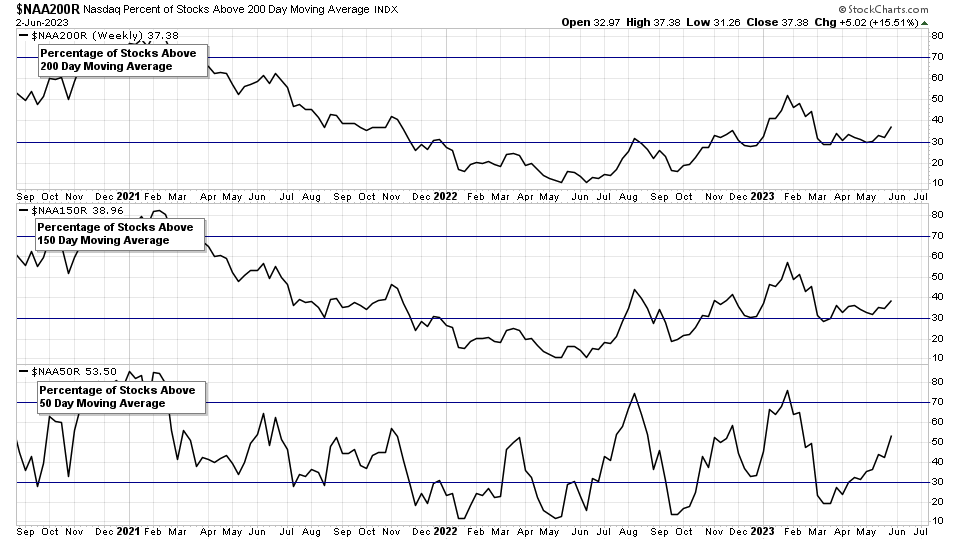
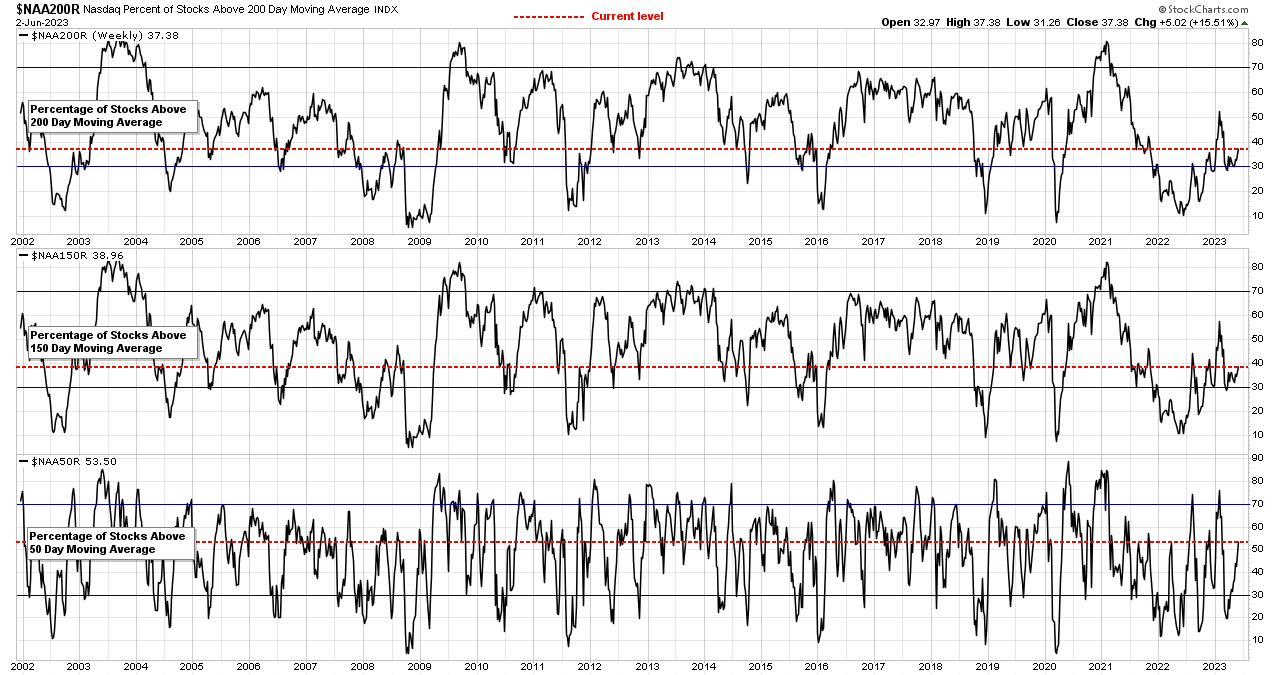
Nasdaq Total % Stocks Above their 50 Day, 150 Day & 200 Day Moving Averages Combined
- Long Term: Stocks Above 200 Day MA: 37.38%
- Medium Term: Stocks Above 150 Day MA: 38.96%
- Short Term: Stocks Above 50 Day MA: 53.50%
43.28% (+6.72% 1wk)
Become a Stage Analysis Member:
To see more like this – US Stocks watchlist posts, detailed videos each weekend, use our unique Stage Analysis tools, such as the US Stocks & ETFs Screener, Charts, Market Breadth, Group Relative Strength and more...
Join Today
Disclaimer: For educational purpose only. Not investment advice. Seek professional advice from a financial advisor before making any investing decisions.