
US Stocks Industry Groups Relative Strength Rankings
The full post is available to view by members only. For immediate access:
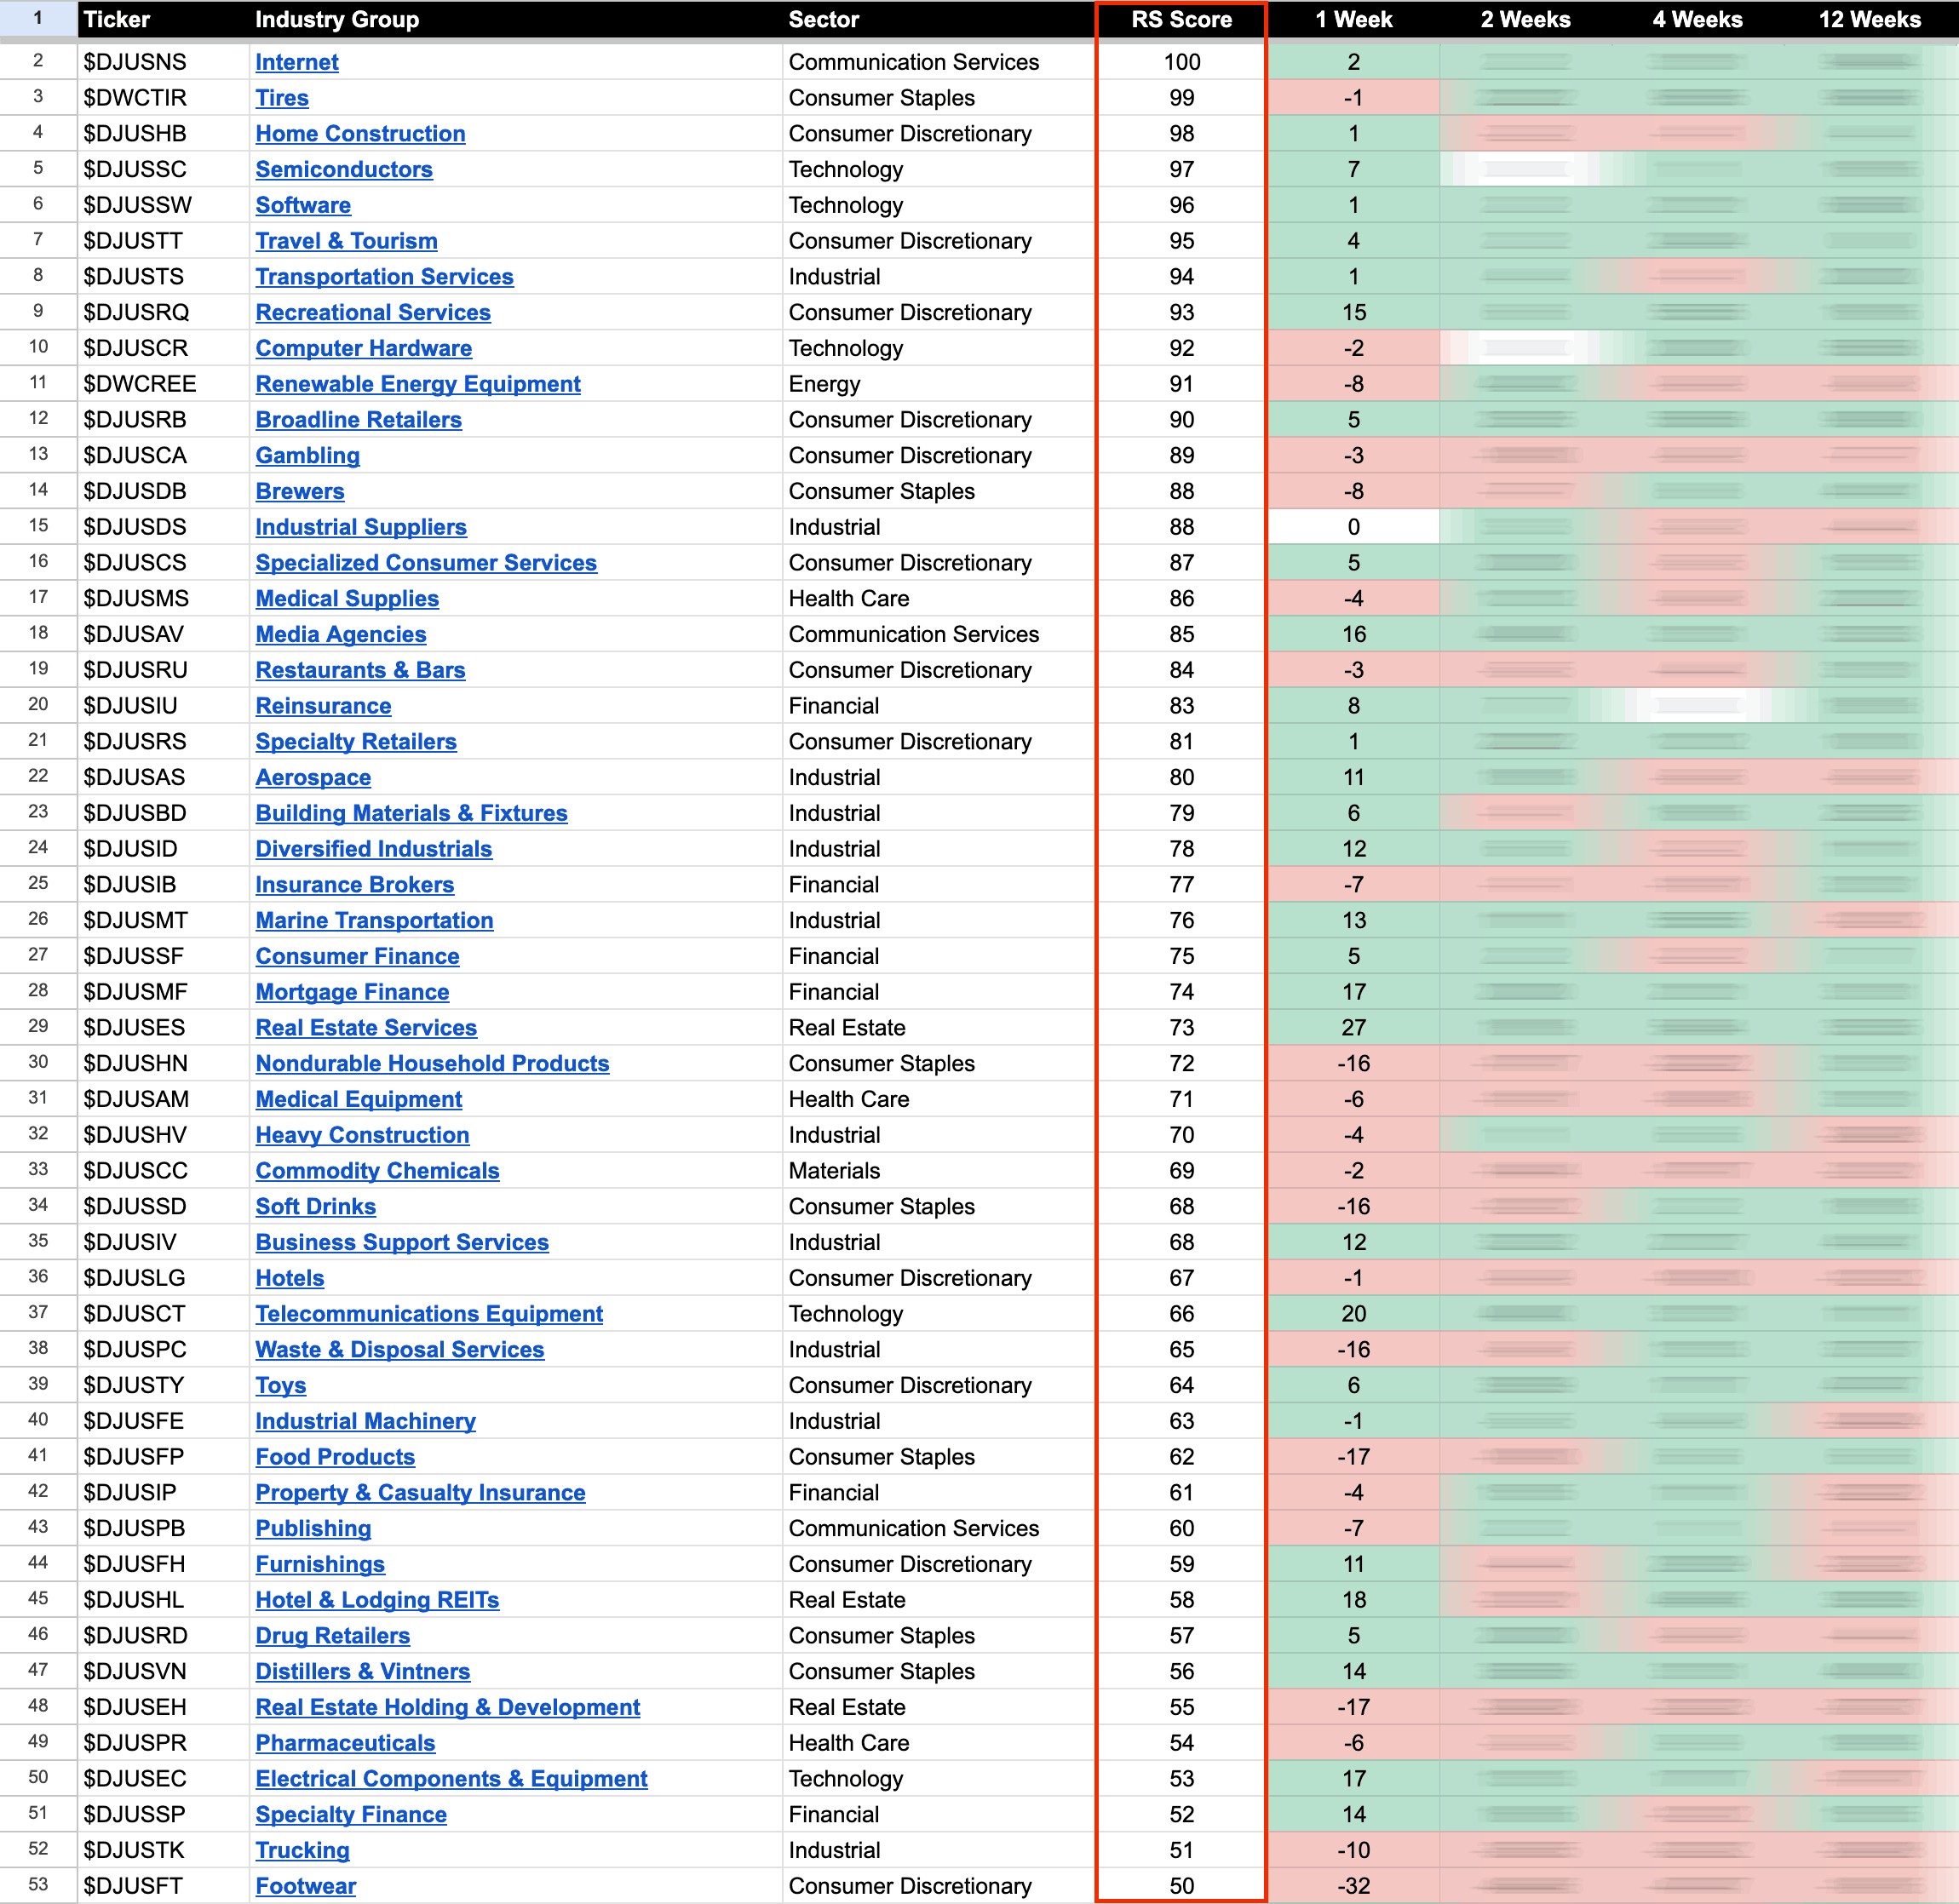
US Industry Groups by Highest RS Score
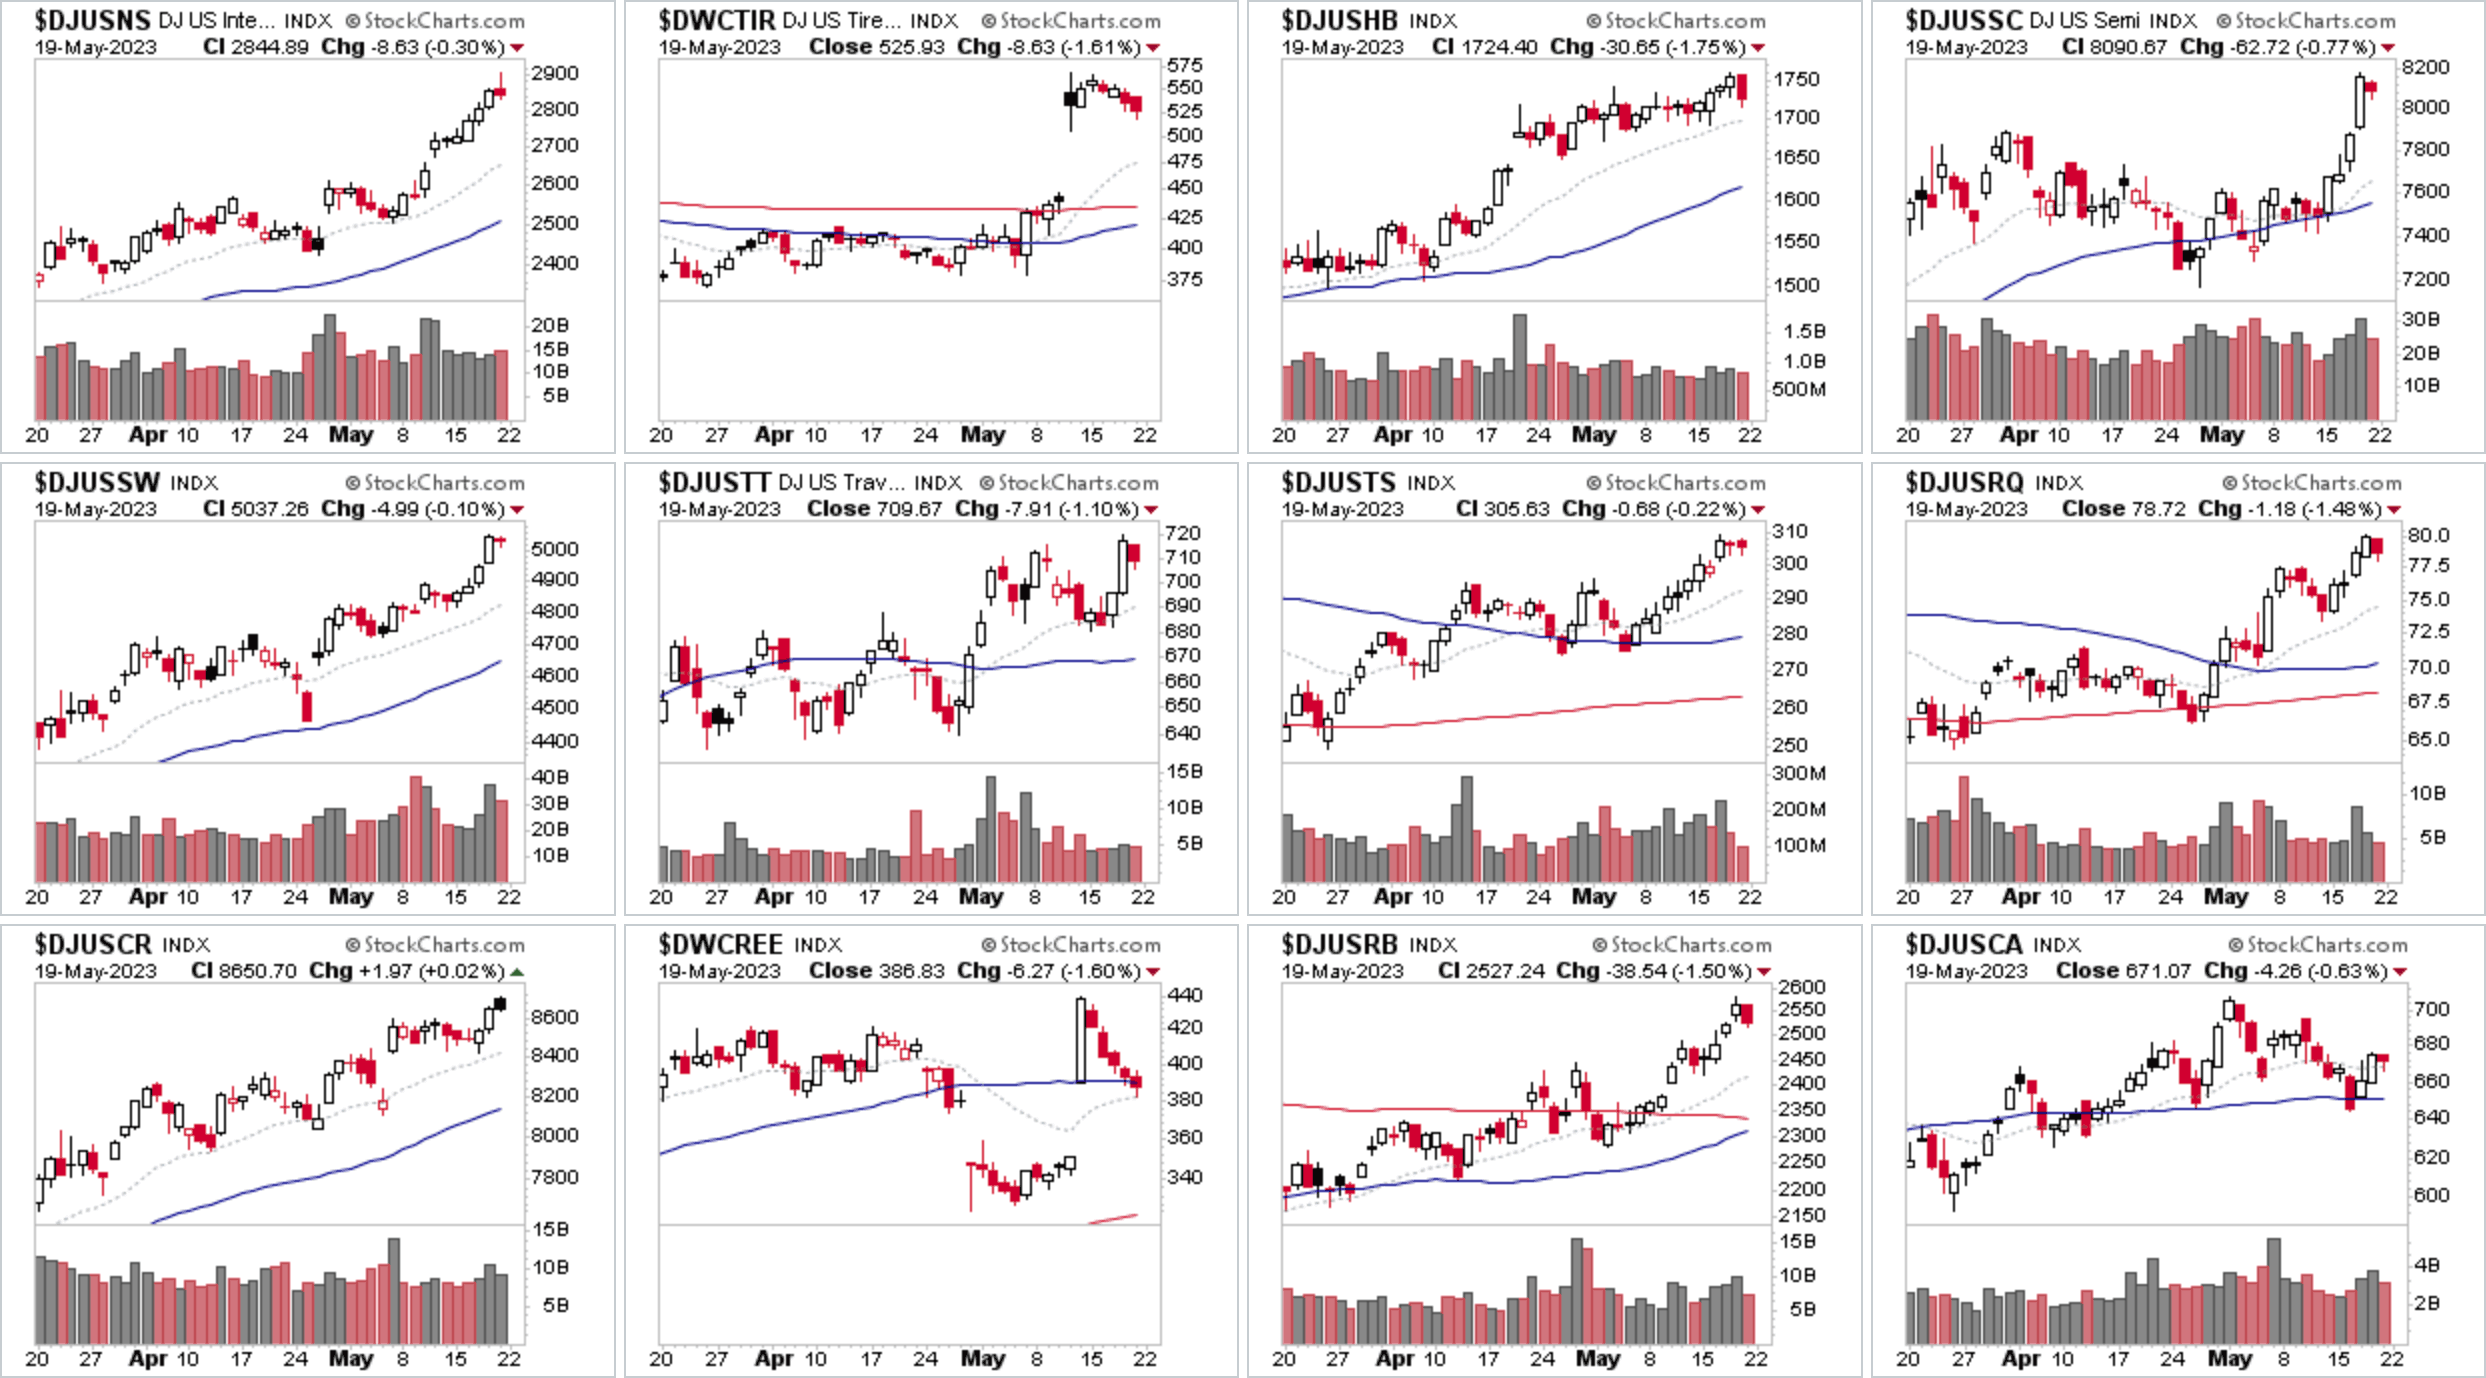
The Internet group ($DJUSNS) continued its rise up the RS rankings, and moved into the number 1 spot for the first time in 2023, and hasn't been at the top of the rankings since pre 2020. So it's now risen by 94 RS points in the last 12 weeks from near to the bottom of the rankings back in mid to late February, with multiple large caps in the group contributing to the move this week.
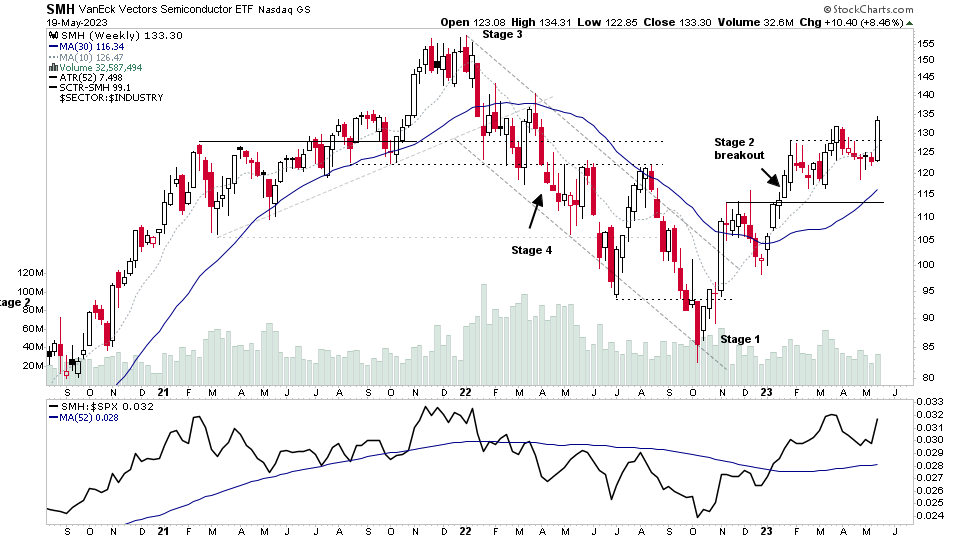
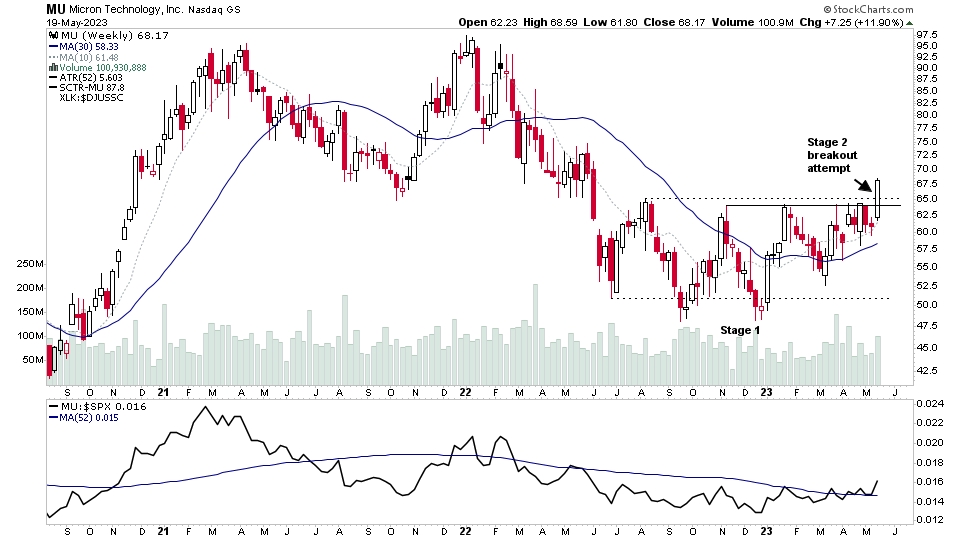
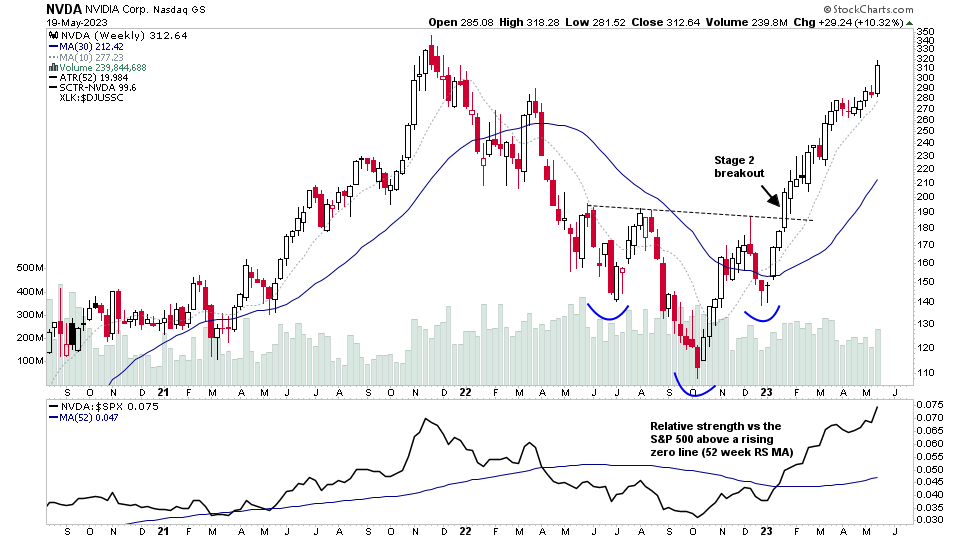
Semiconductors ($DJUSSC) was the major mover of the week though, with 91% of the stocks in the group positive for the week and an +8.09% gain, as multiple stocks in the group made Stage 2 continuation breakouts, including one of the group ETFs – SMH. But what was interesting was the fact that the laggards in the group picked up momentum as well. With multiple early Stage 2 breakouts including large cap laggard – MU – whose Stage 2 breakout I highlighted in Thursdays watchlist post. So participation in the Semiconductors group appears to be broadening with 50.54% on point and figure buy signals, and 60.21% above their 200 day moving averages, and a similar figure above their 30 week MAs. Thus, there's potential for it to move back towards the top of the RS rankings, with it now sitting in 4th place overall, and still relatively early in it's Stage 2 advancing phase, which began in late January. However, there remains a major hurdle to overcome this week with the group leader NVDA (which is also a mega cap stock) reporting earnings on the 05/24/2023 (AMC).
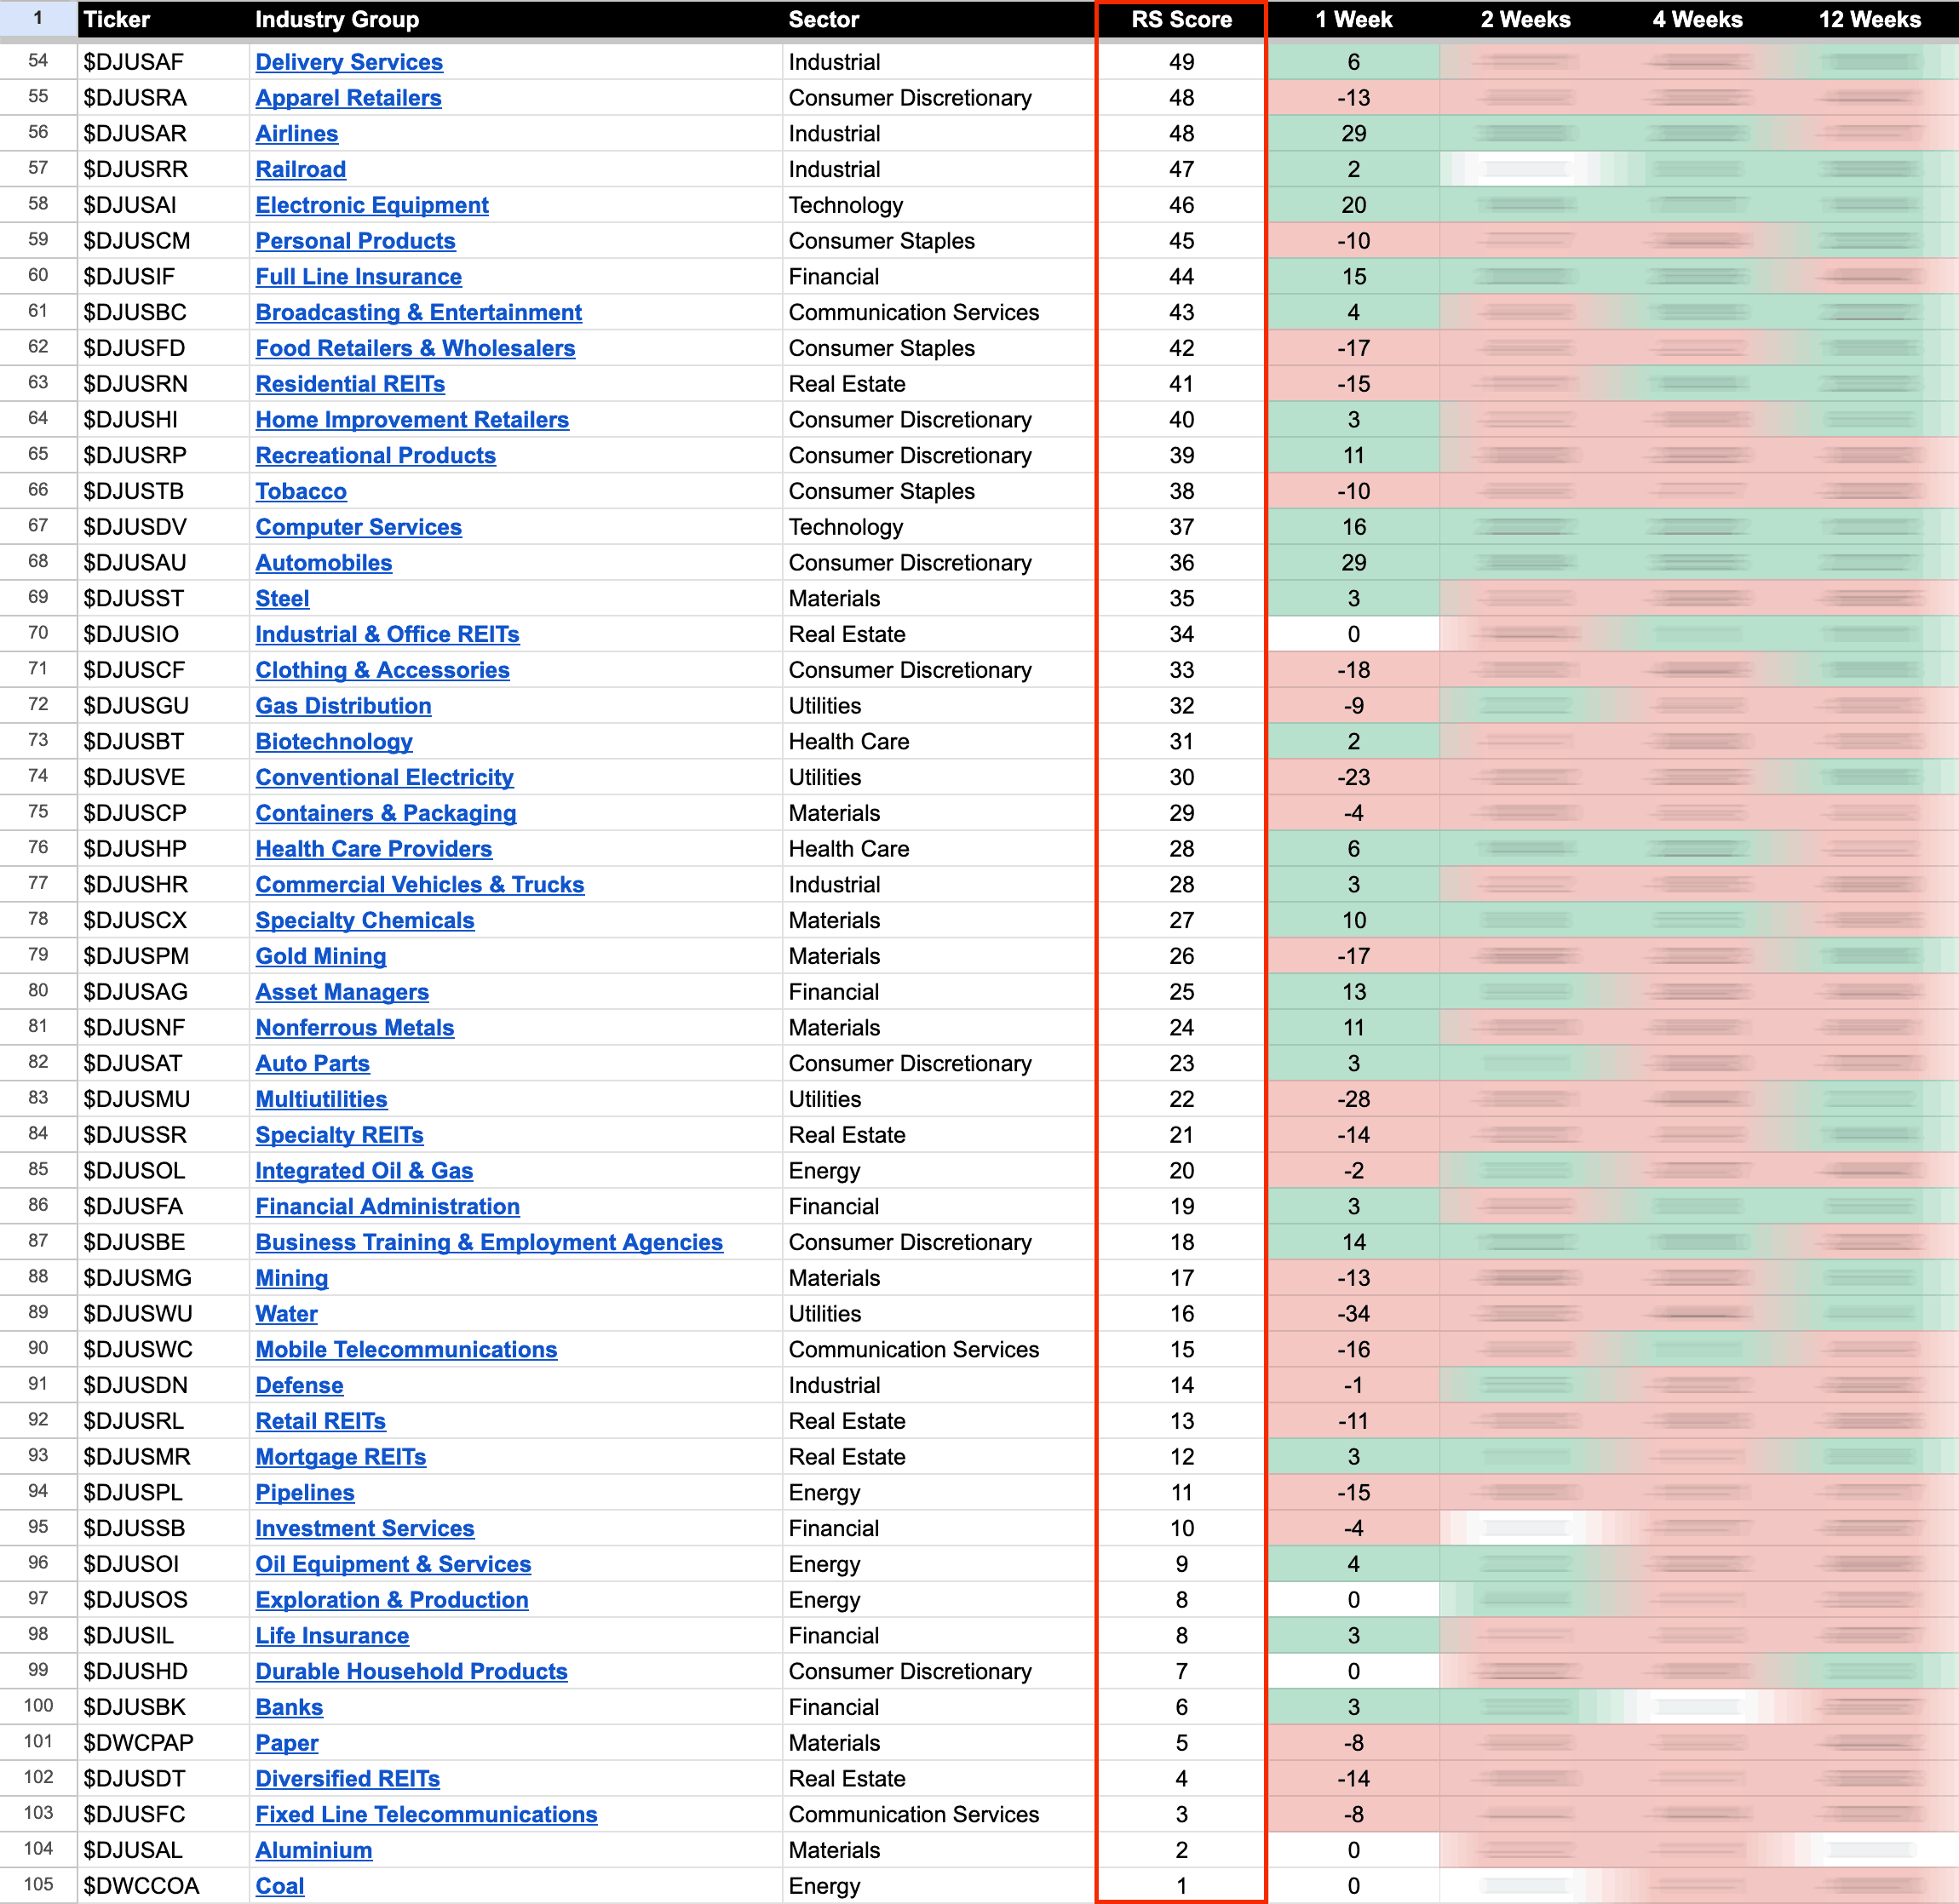
US Industry Groups by Weakest RS Score
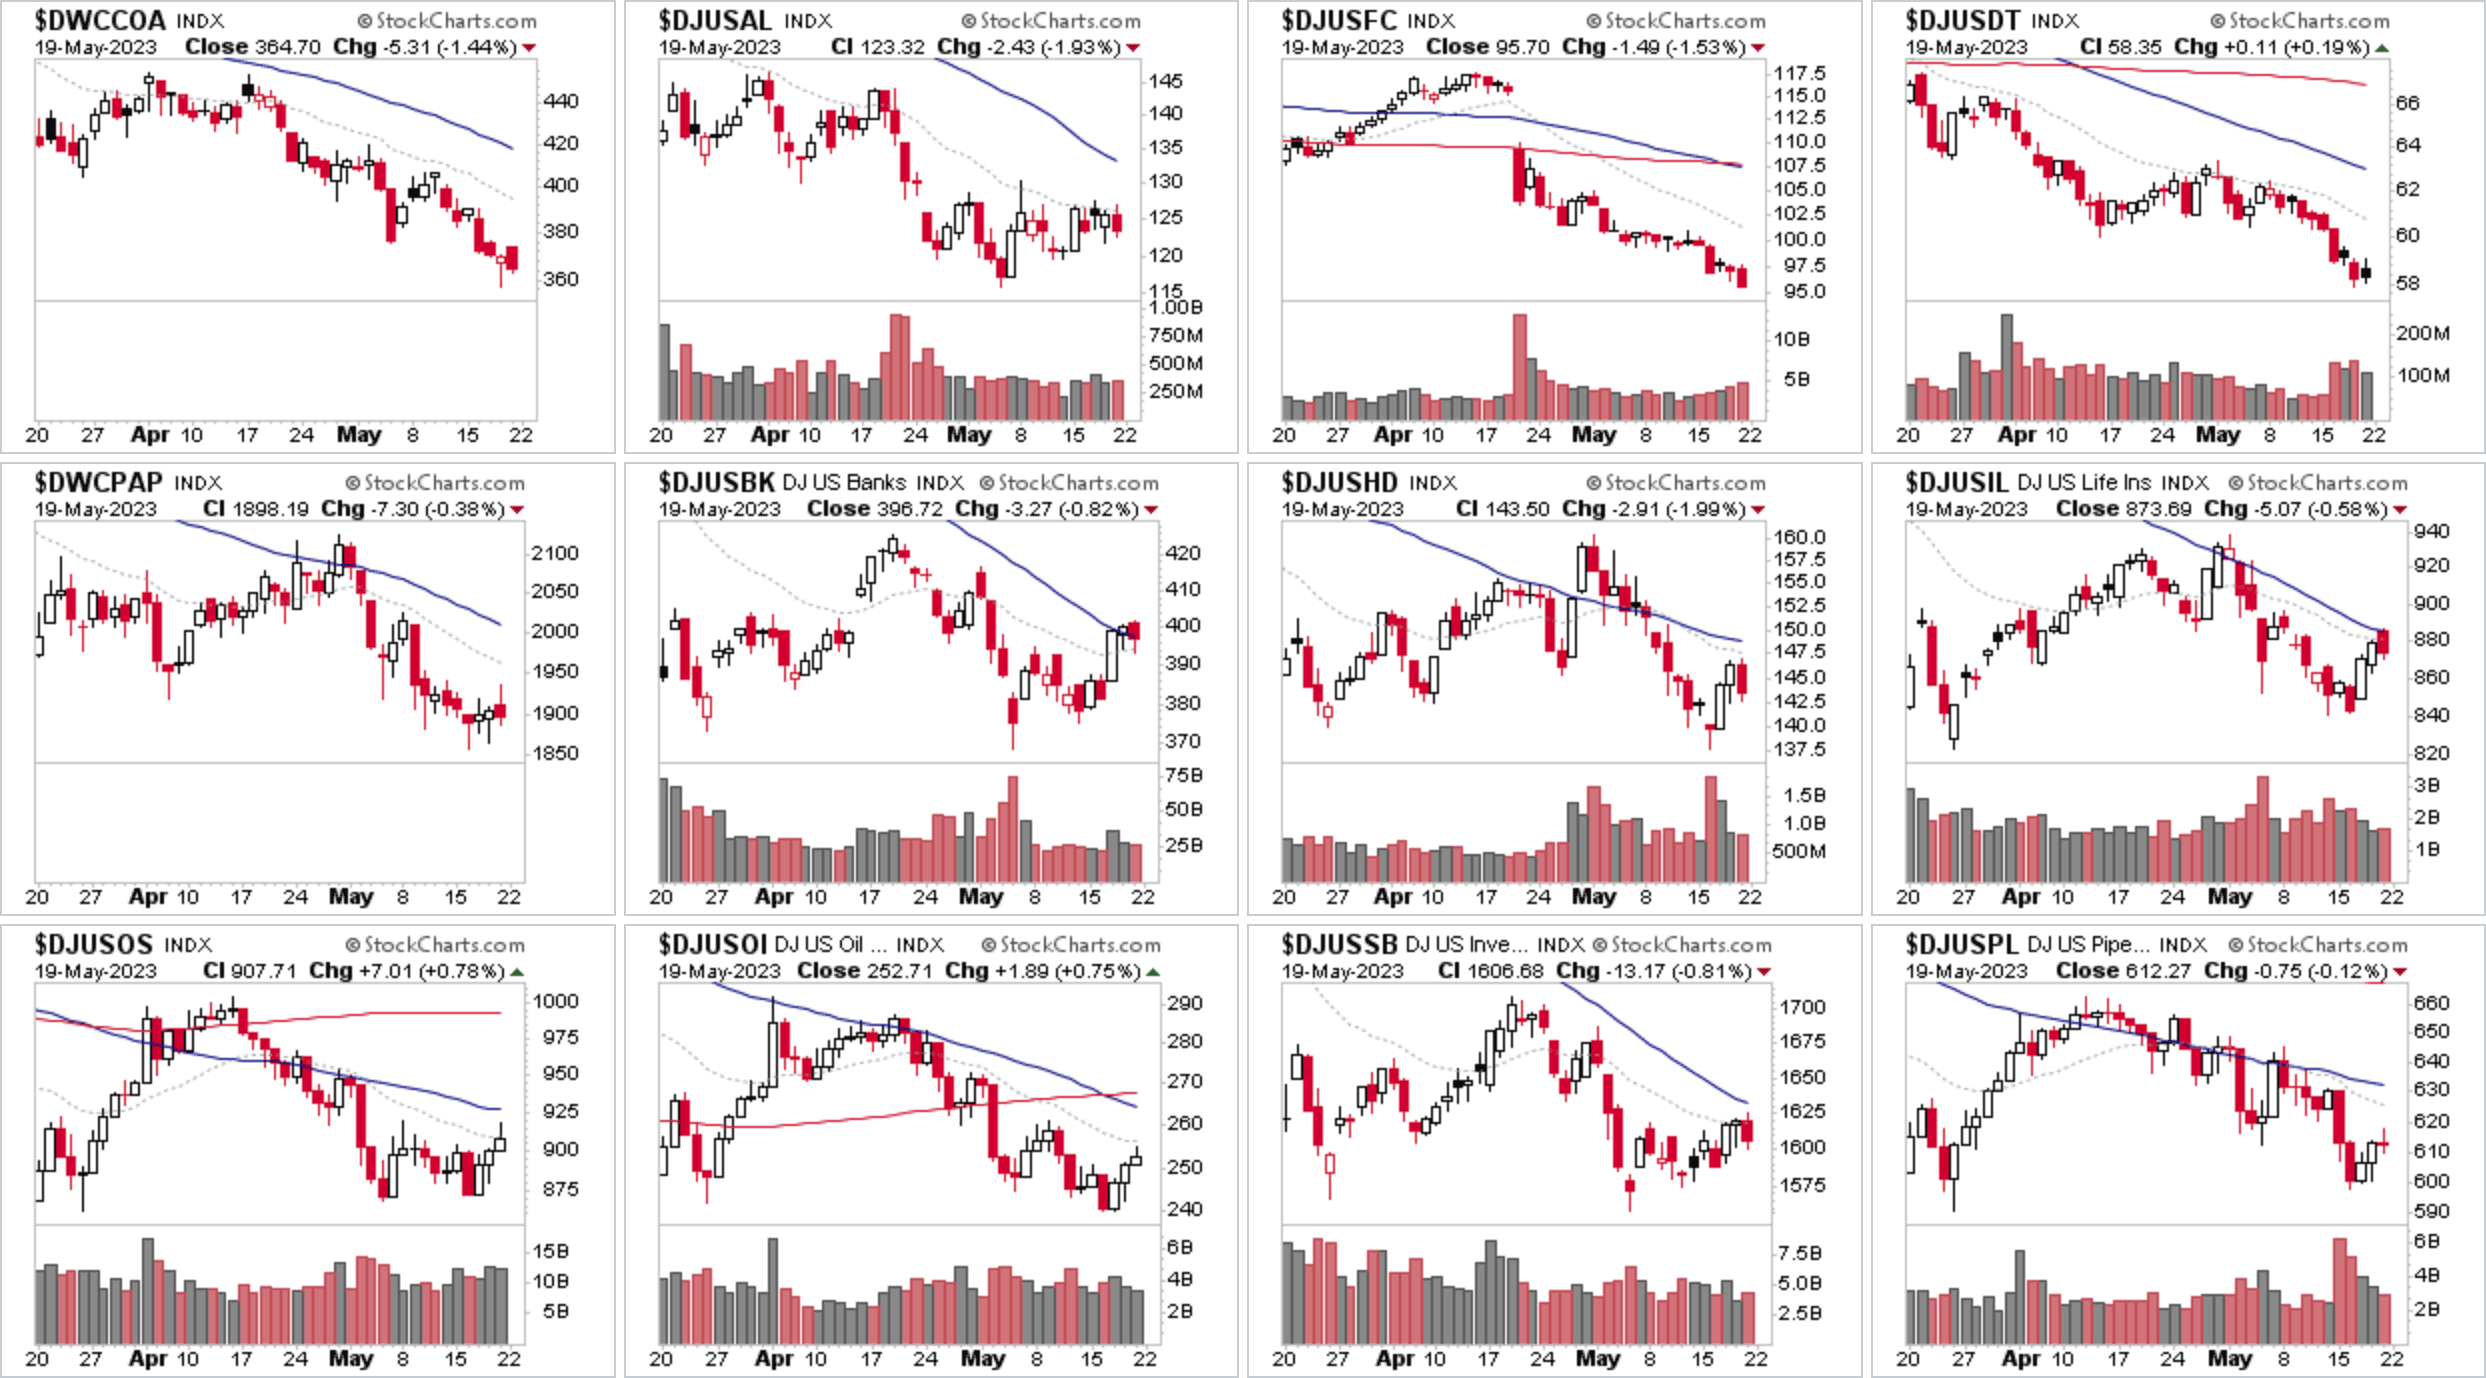
No change at the bottom of the RS rankings again this week with Coal ($DWCCOA) still making new lows in its developing Stage 4 decline, and also a number of other groups making new lows also. Hence, highlighting a very split market this week.
US Industry Groups sorted by Relative Strength
The purpose of the Relative Strength (RS) tables is to track the short, medium and long-term RS changes of the individual groups to find the new leadership earlier than the crowd.
RS Score of 100 is the strongest, and 0 is the weakest.
In the Stage Analysis method we are looking to focus on the strongest groups, as what is strong, tends to stay strong for a long time. But we also want to find the improving / up and coming groups that are starting to rise up strongly through the RS table from the lower zone, in order to find the future leading stocks before they break out from a Stage 1 base and move into a Stage 2 advancing phase.
Each week I go through the most interesting groups on the move in more detail during the Stage Analysis Members weekend video – as Industry Group analysis is a key part of Stan Weinstein's Stage Analysis method.
Become a Stage Analysis Member:
To see more like this – US Stocks watchlist posts, detailed videos each weekend, use our unique Stage Analysis tools, such as the US Stocks & ETFs Screener, Charts, Market Breadth, Group Relative Strength and more...
Join Today
Disclaimer: For educational purpose only. Not investment advice. Seek professional advice from a financial advisor before making any investing decisions.