
US Stocks Industry Groups Relative Strength Rankings
The full post is available to view by members only. For immediate access:
US Industry Groups by Highest RS Score
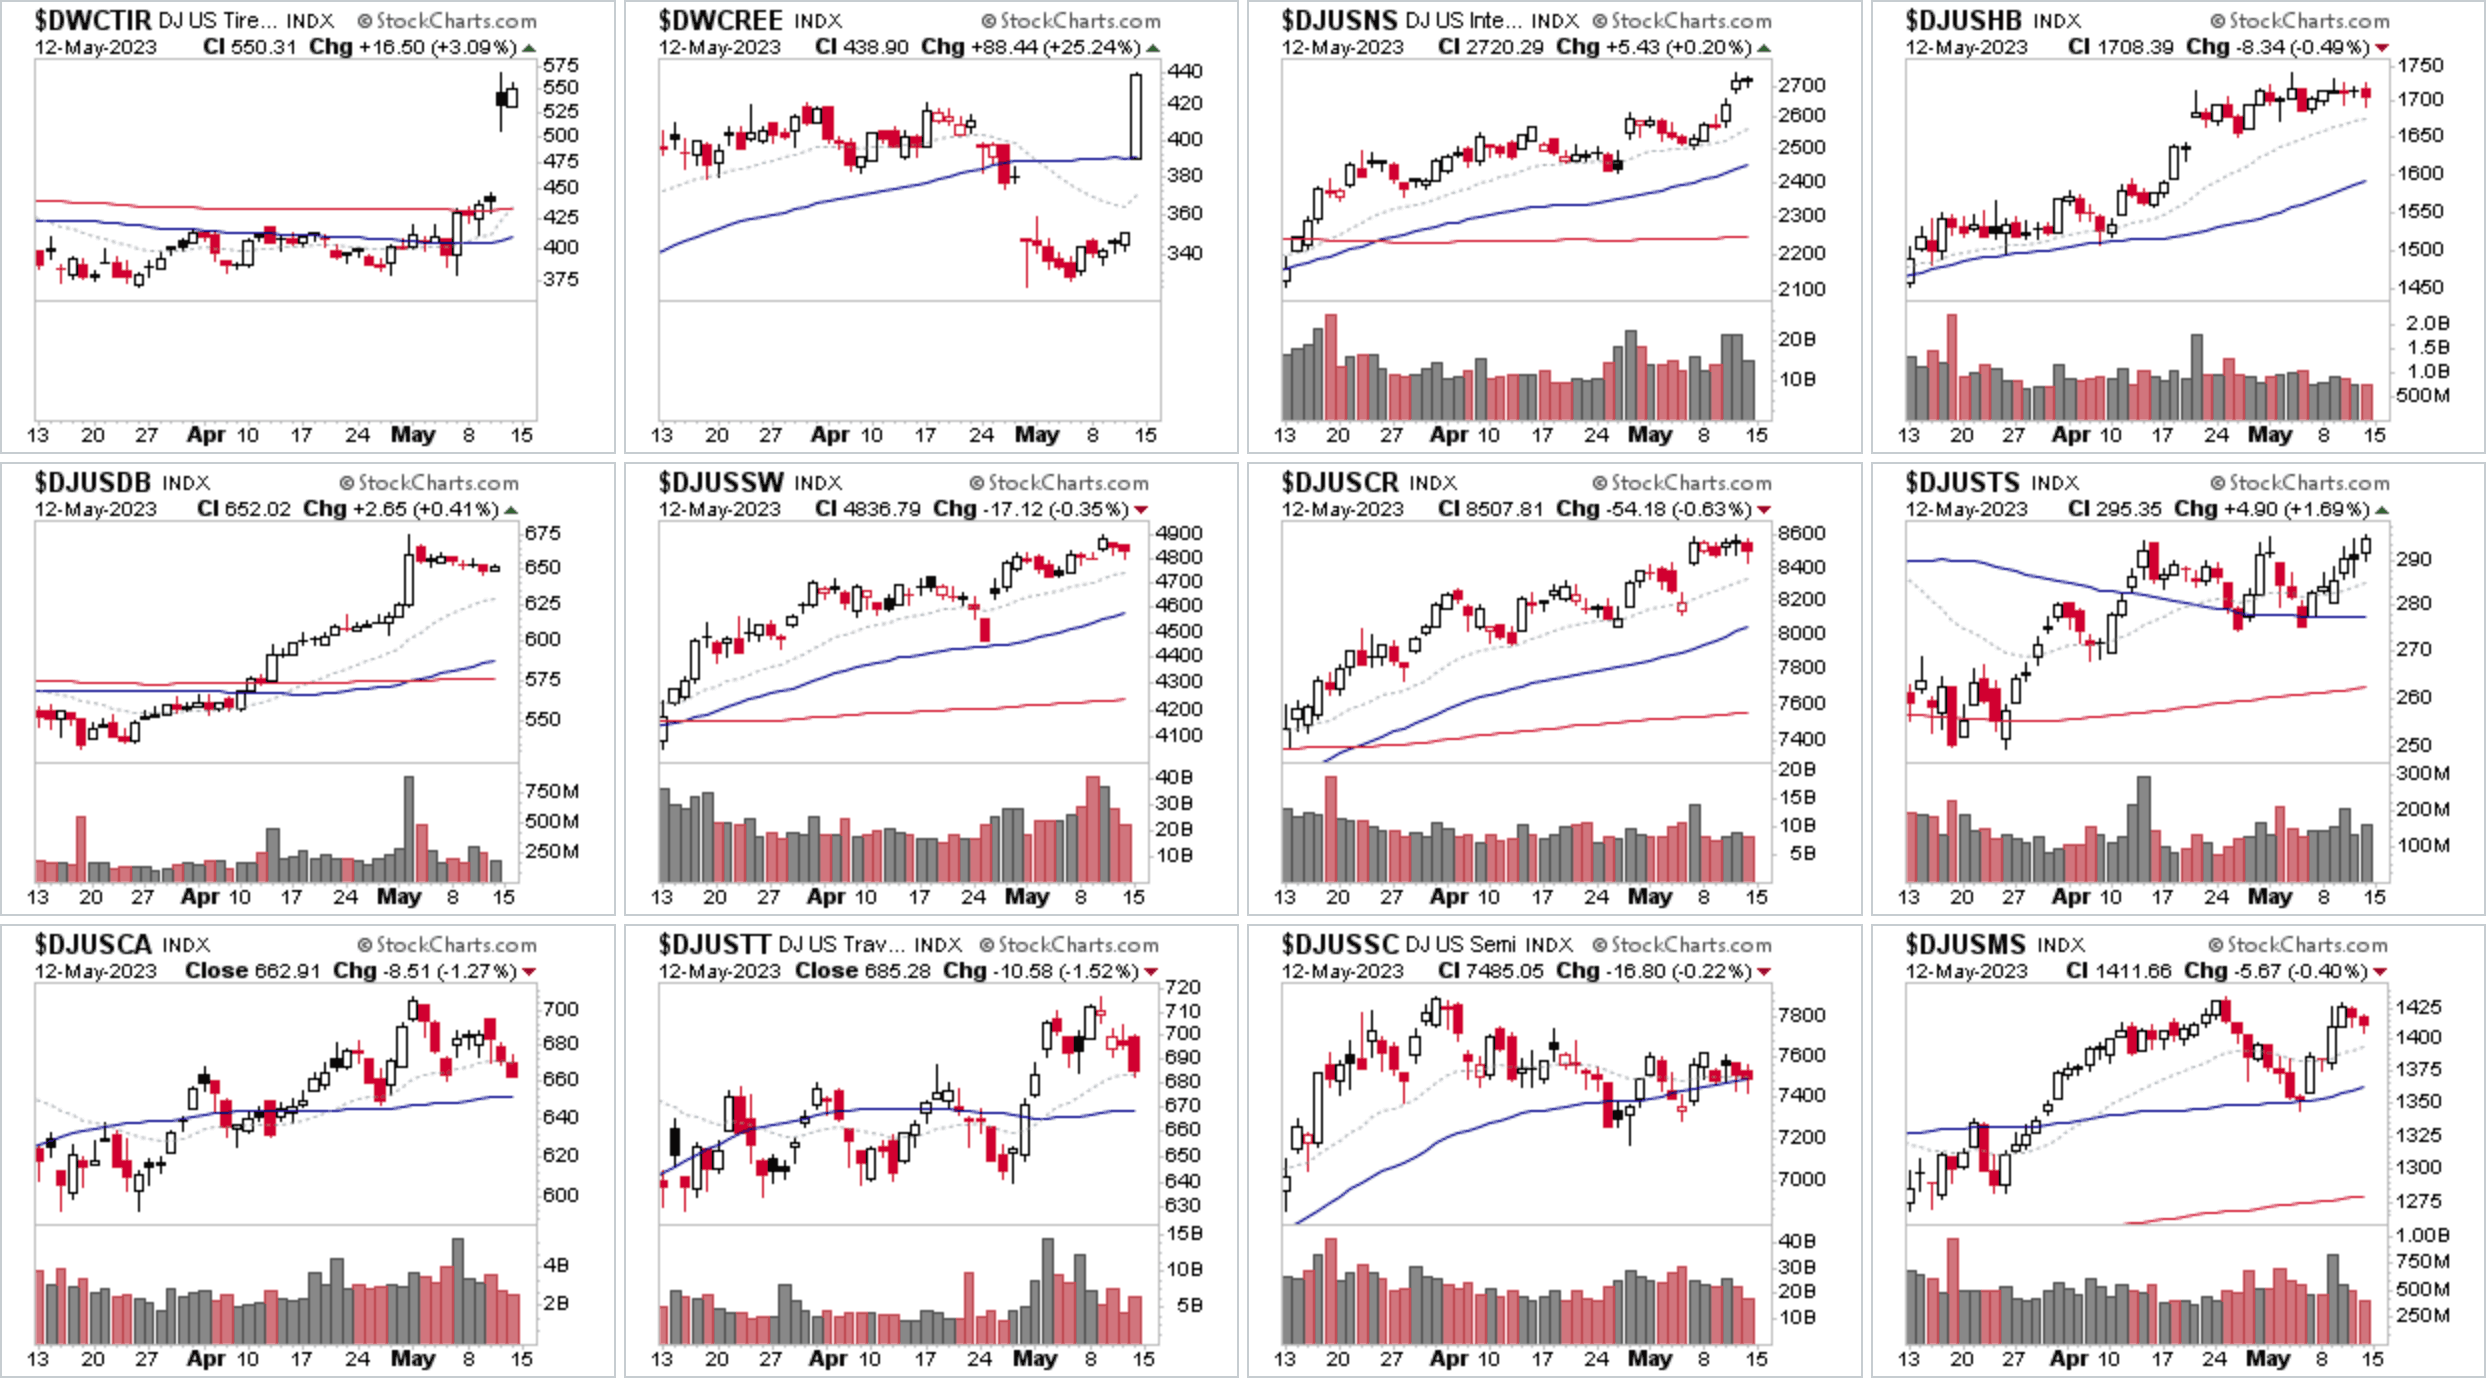
A number of changes this week at the top of the US Industry Group Relative Strength (RS) rankings with Tires ($DWCTIR) and the Renewable Energy Equipment ($DWCREE) moving into the top two spots, although Tires is a very small group of only four stocks, and so it's rapid move up the RS rankings can be solely attributed to the Stage 2 breakout in GT on earnings results. Thus I wouldn't expect it to hold onto the top spot for very long, as it's not a group wide move, and the group is so small, which makes it's RS position more volatile.
Renewable Energy Equipment ($DWCREE) on the other hand had 6 of its 37 stocks close the week up between +18% to +33%, and so it was a broader move by comparison, but it's still relatively focused in only a small percentage of the groups stocks. i.e. FSLR, MAXN, NXT, SHLS, ARRY.
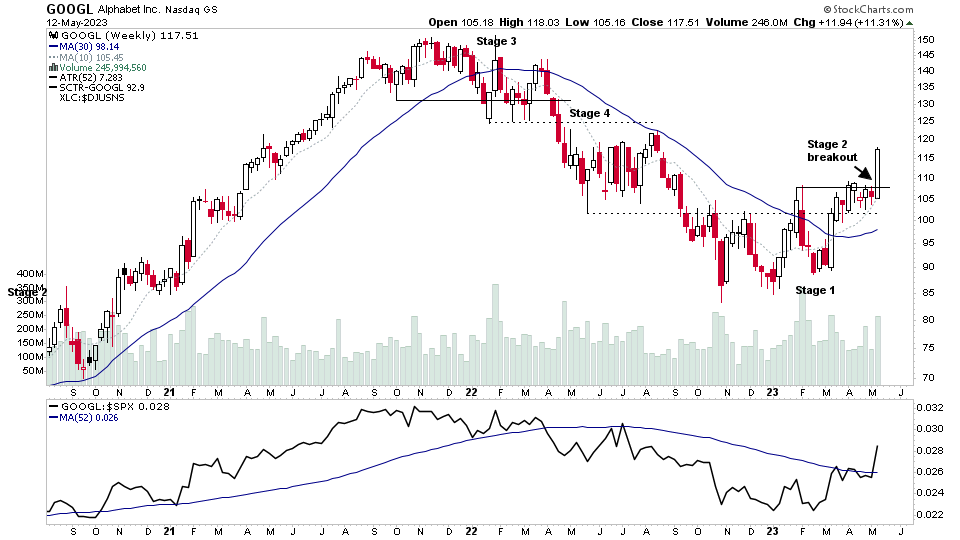
The Internet group ($DJUSNS) held onto the third place in the RS rankings this week, due in part to the Stage 2 breakout in mega cap stock GOOGL & GOOG, which was last highlighted in watchlist on the 7th May before the breakout, and has been regularly highlighted in the watchlist during 2023 as the Stage 1 base structure developed. As one of the key purposes of the watchlist is highlight stocks that showing certain characteristics that we look for in the Stage Analysis method before the methods entry points, so that we can spot developing group themes in their infancy via the individual stocks developing in base structures, and then track them if they progress, so that you can be ready to act if a stock reaches Stan Weinstein's Stage Analysis investor method entry point at the Stage 2 breakout, like which we've seen Google's stocks move through this week.
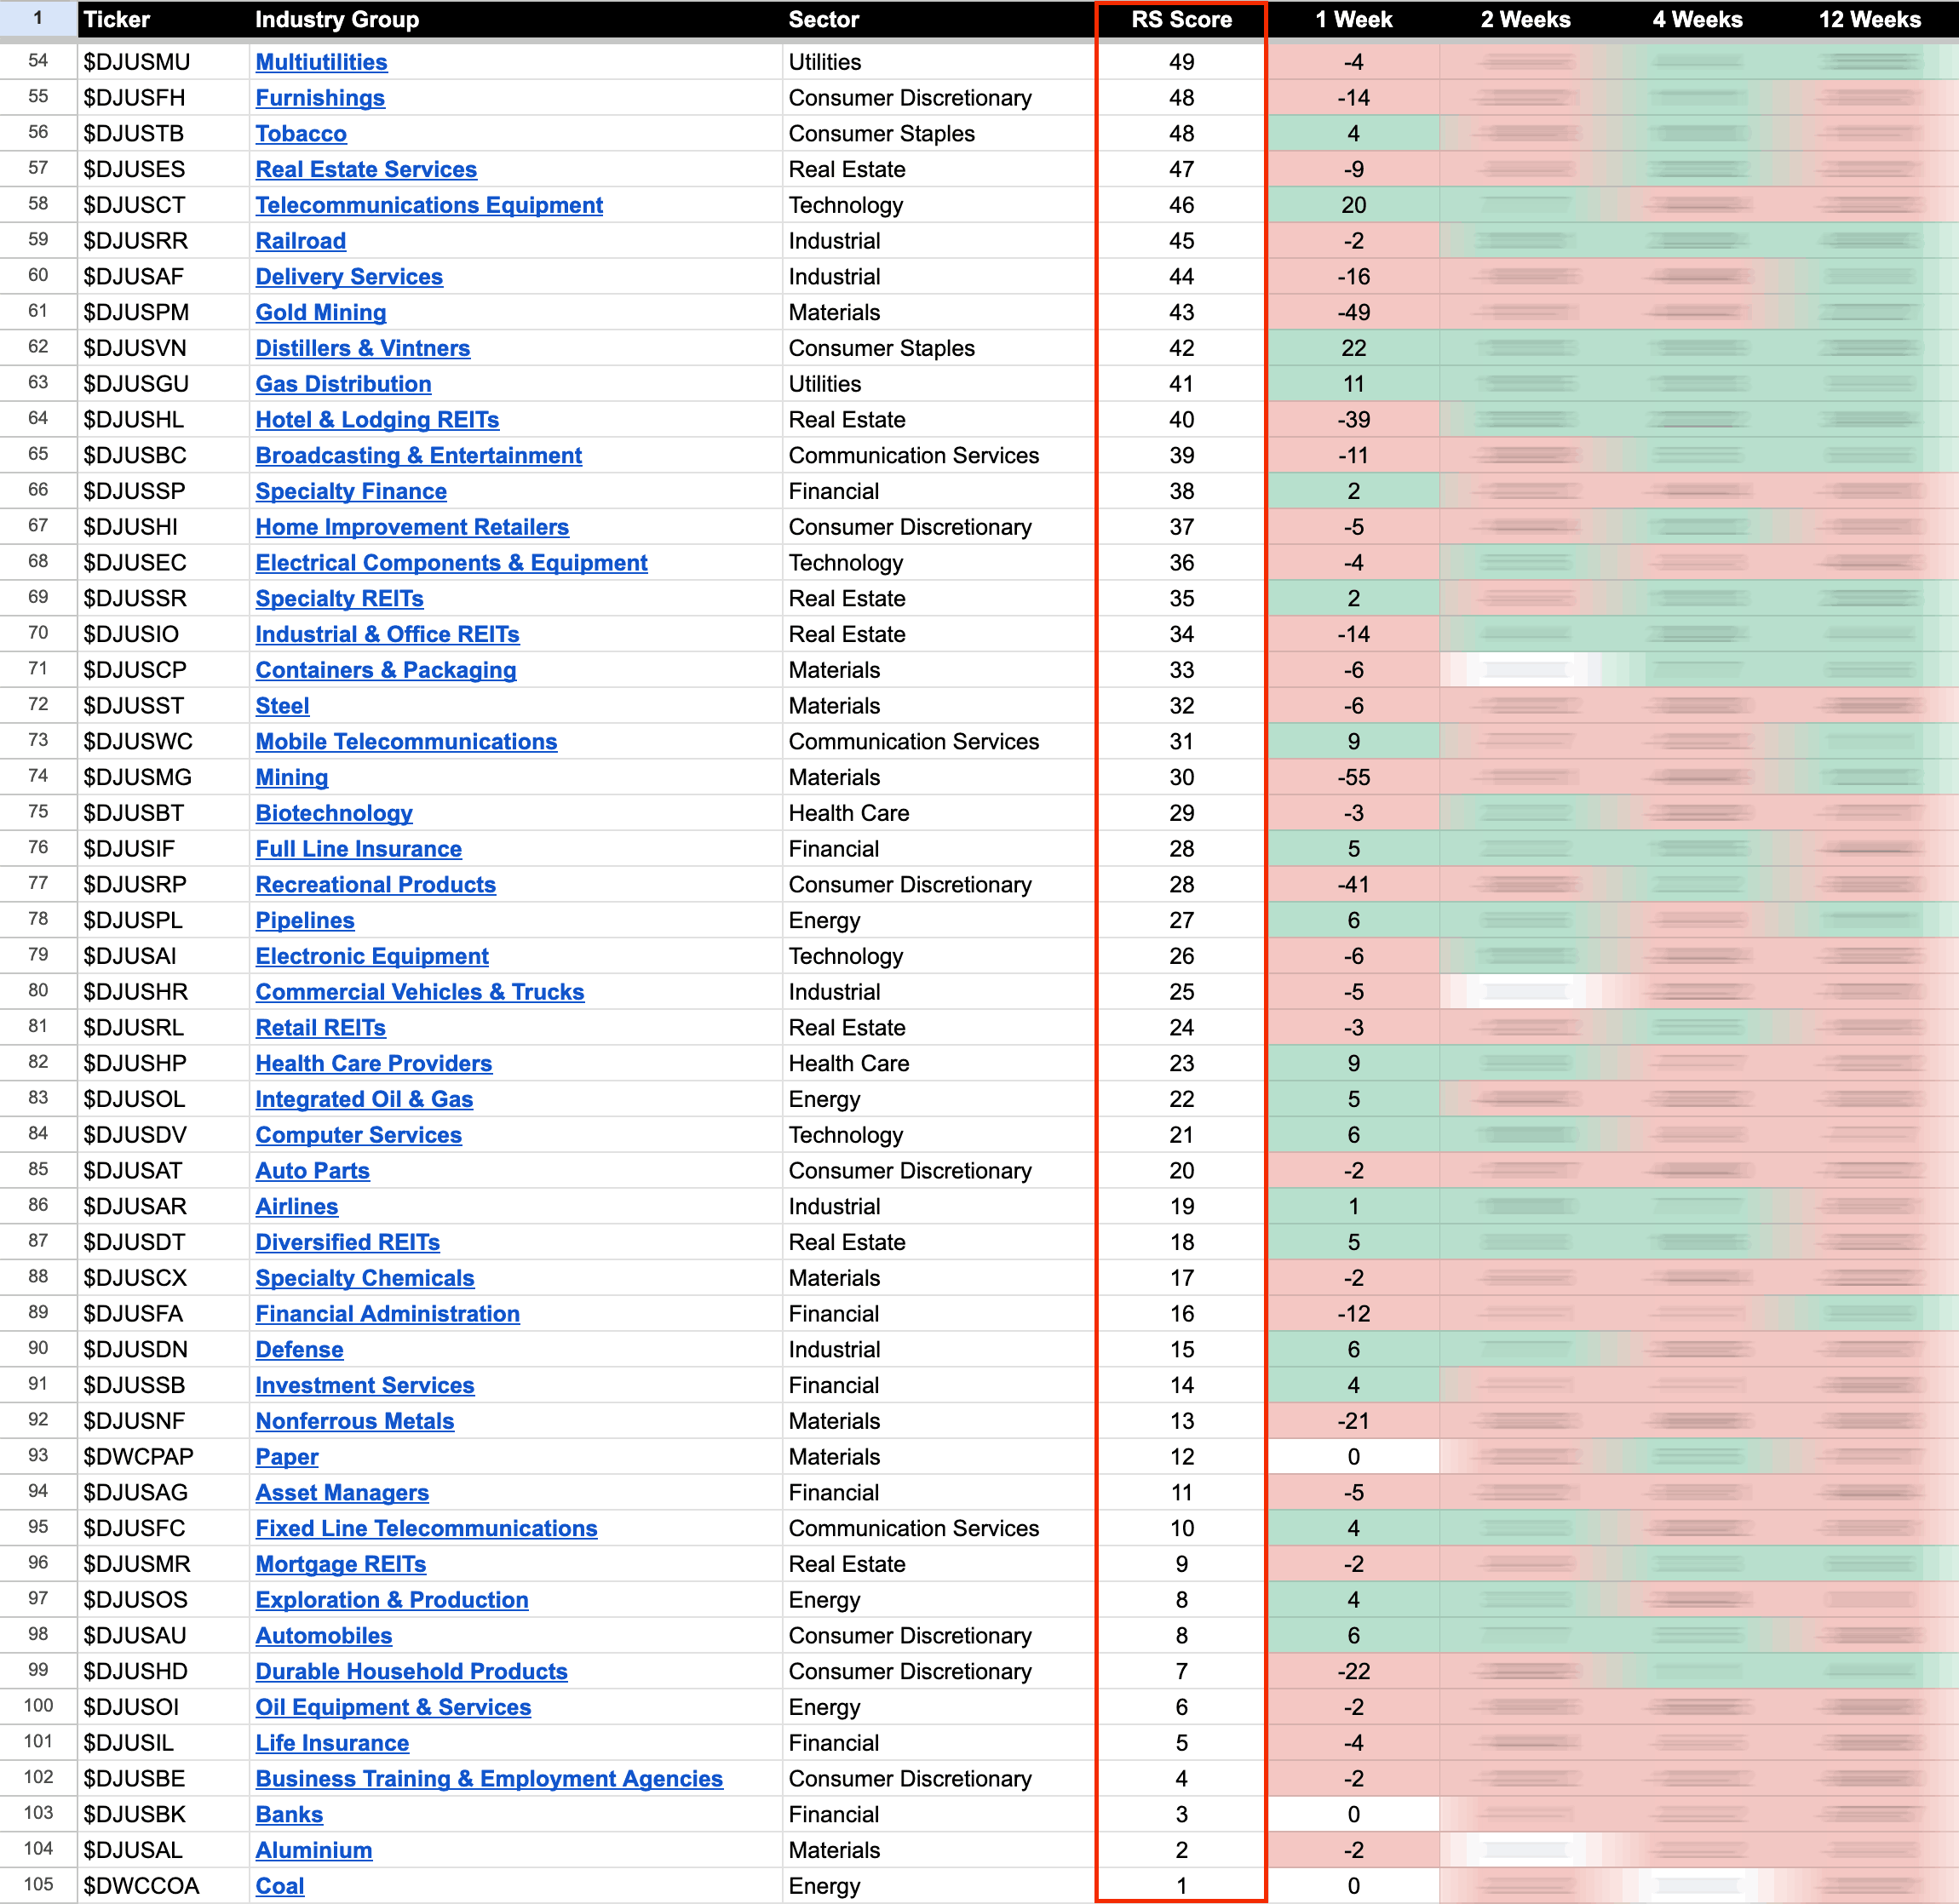
US Industry Groups by Weakest RS Score
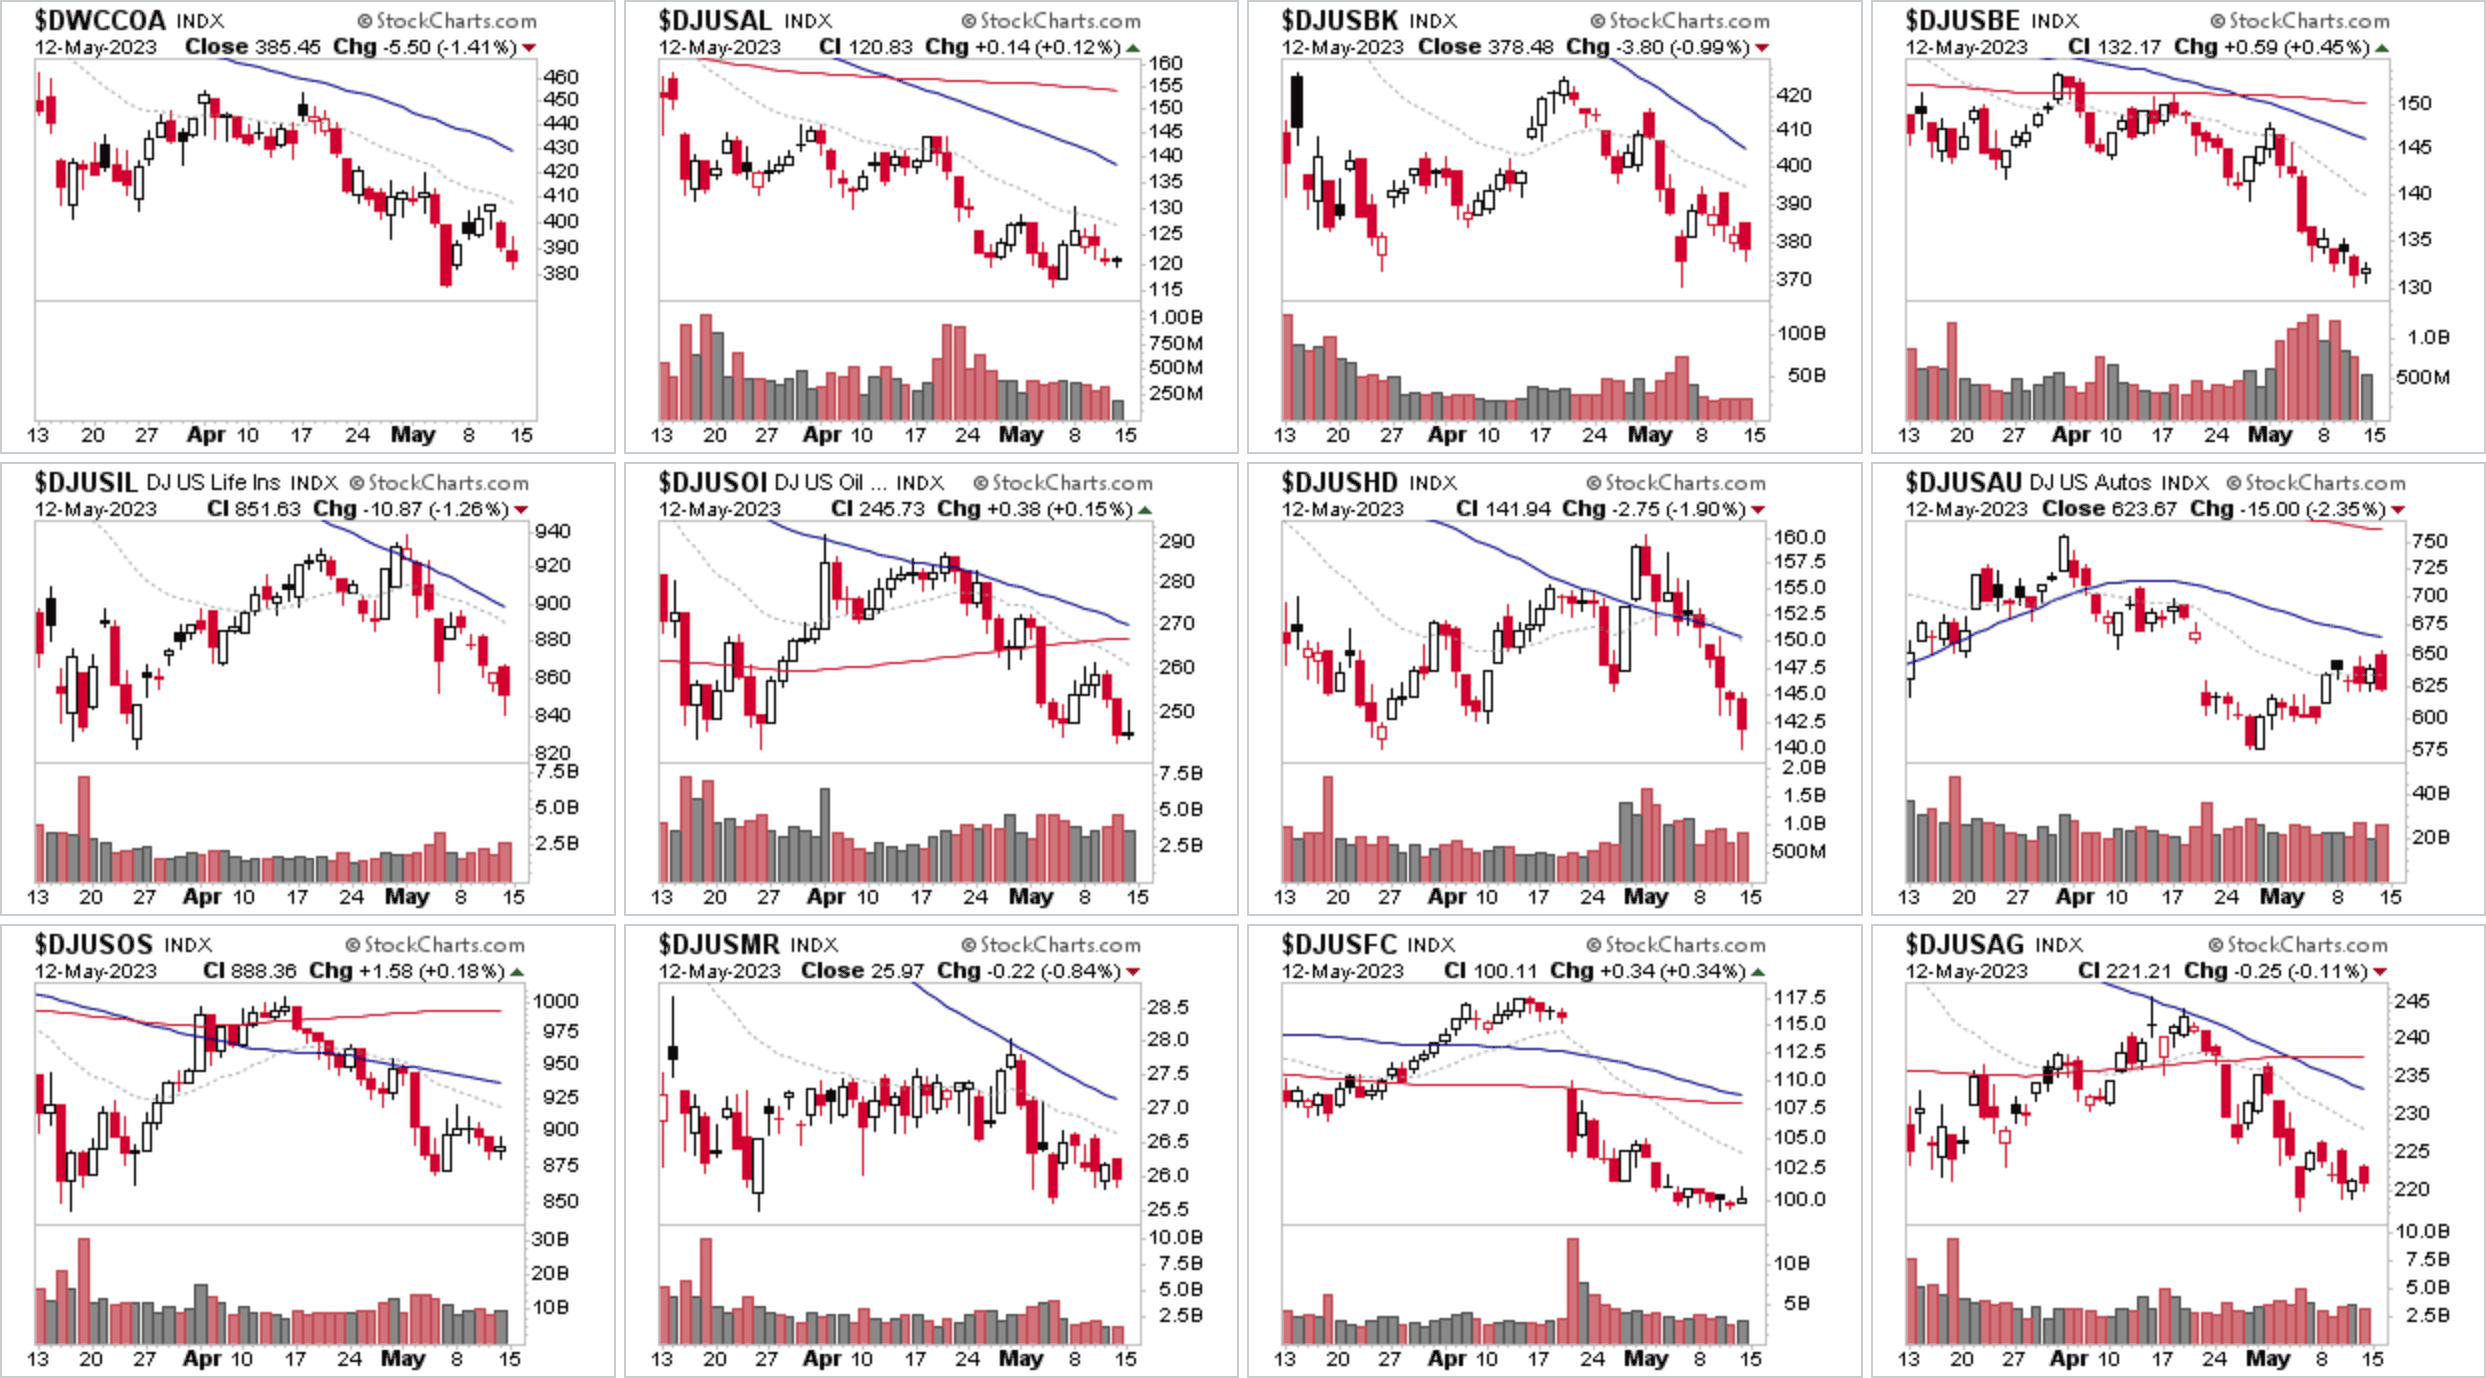
No change at the bottom of the RS rankings this week with Coal ($DWCCOA) holding onto the bottom spot with a further lower weekly close, as it continues lower in its current Stage 4 declining phase.
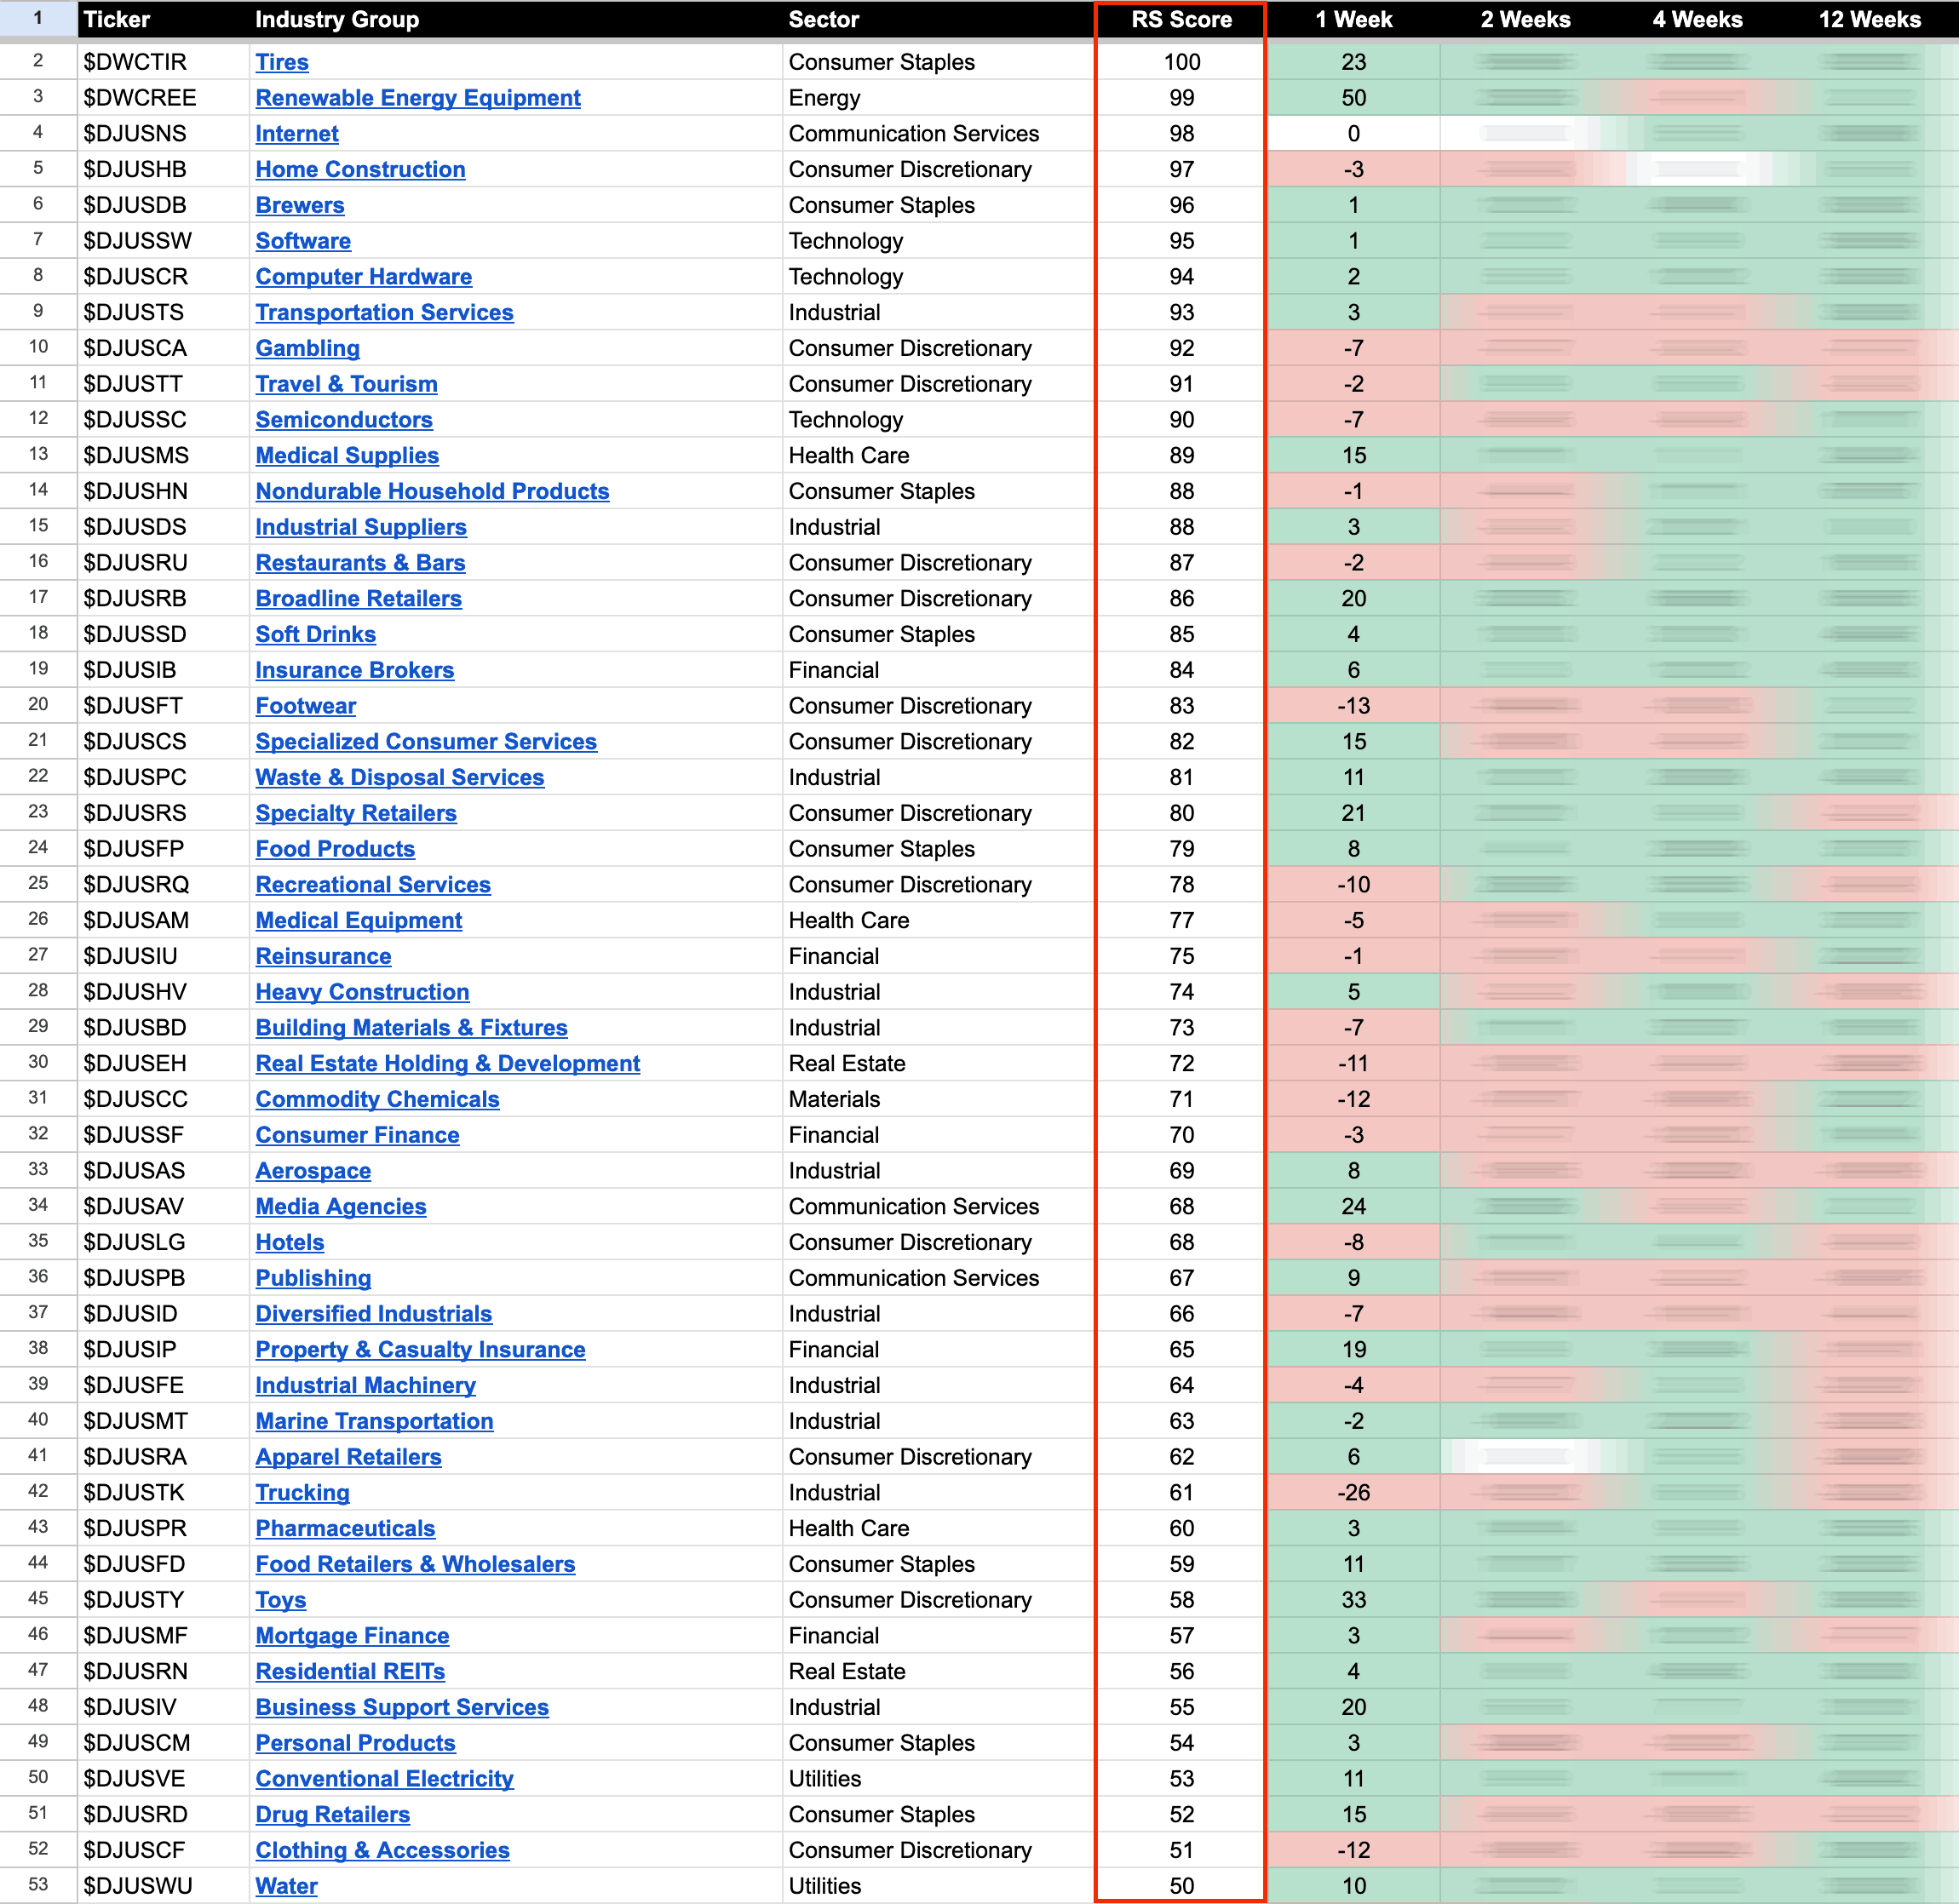
US Industry Groups sorted by Relative Strength
The purpose of the Relative Strength (RS) tables is to track the short, medium and long-term RS changes of the individual groups to find the new leadership earlier than the crowd.
RS Score of 100 is the strongest, and 0 is the weakest.
In the Stage Analysis method we are looking to focus on the strongest groups, as what is strong, tends to stay strong for a long time. But we also want to find the improving / up and coming groups that are starting to rise up strongly through the RS table from the lower zone, in order to find the future leading stocks before they break out from a Stage 1 base and move into a Stage 2 advancing phase.
Each week I go through the most interesting groups on the move in more detail during the Stage Analysis Members weekend video – as Industry Group analysis is a key part of Stan Weinstein's Stage Analysis method.
Become a Stage Analysis Member:
To see more like this – US Stocks watchlist posts, detailed videos each weekend, use our unique Stage Analysis tools, such as the US Stocks & ETFs Screener, Charts, Market Breadth, Group Relative Strength and more...
Join Today
Disclaimer: For educational purpose only. Not investment advice. Seek professional advice from a financial advisor before making any investing decisions.