
Market Breadth: Percentage of Stocks Above their 50 Day, 150 Day & 200 Day Moving Averages Combined
The full post is available to view by members only. For immediate access:
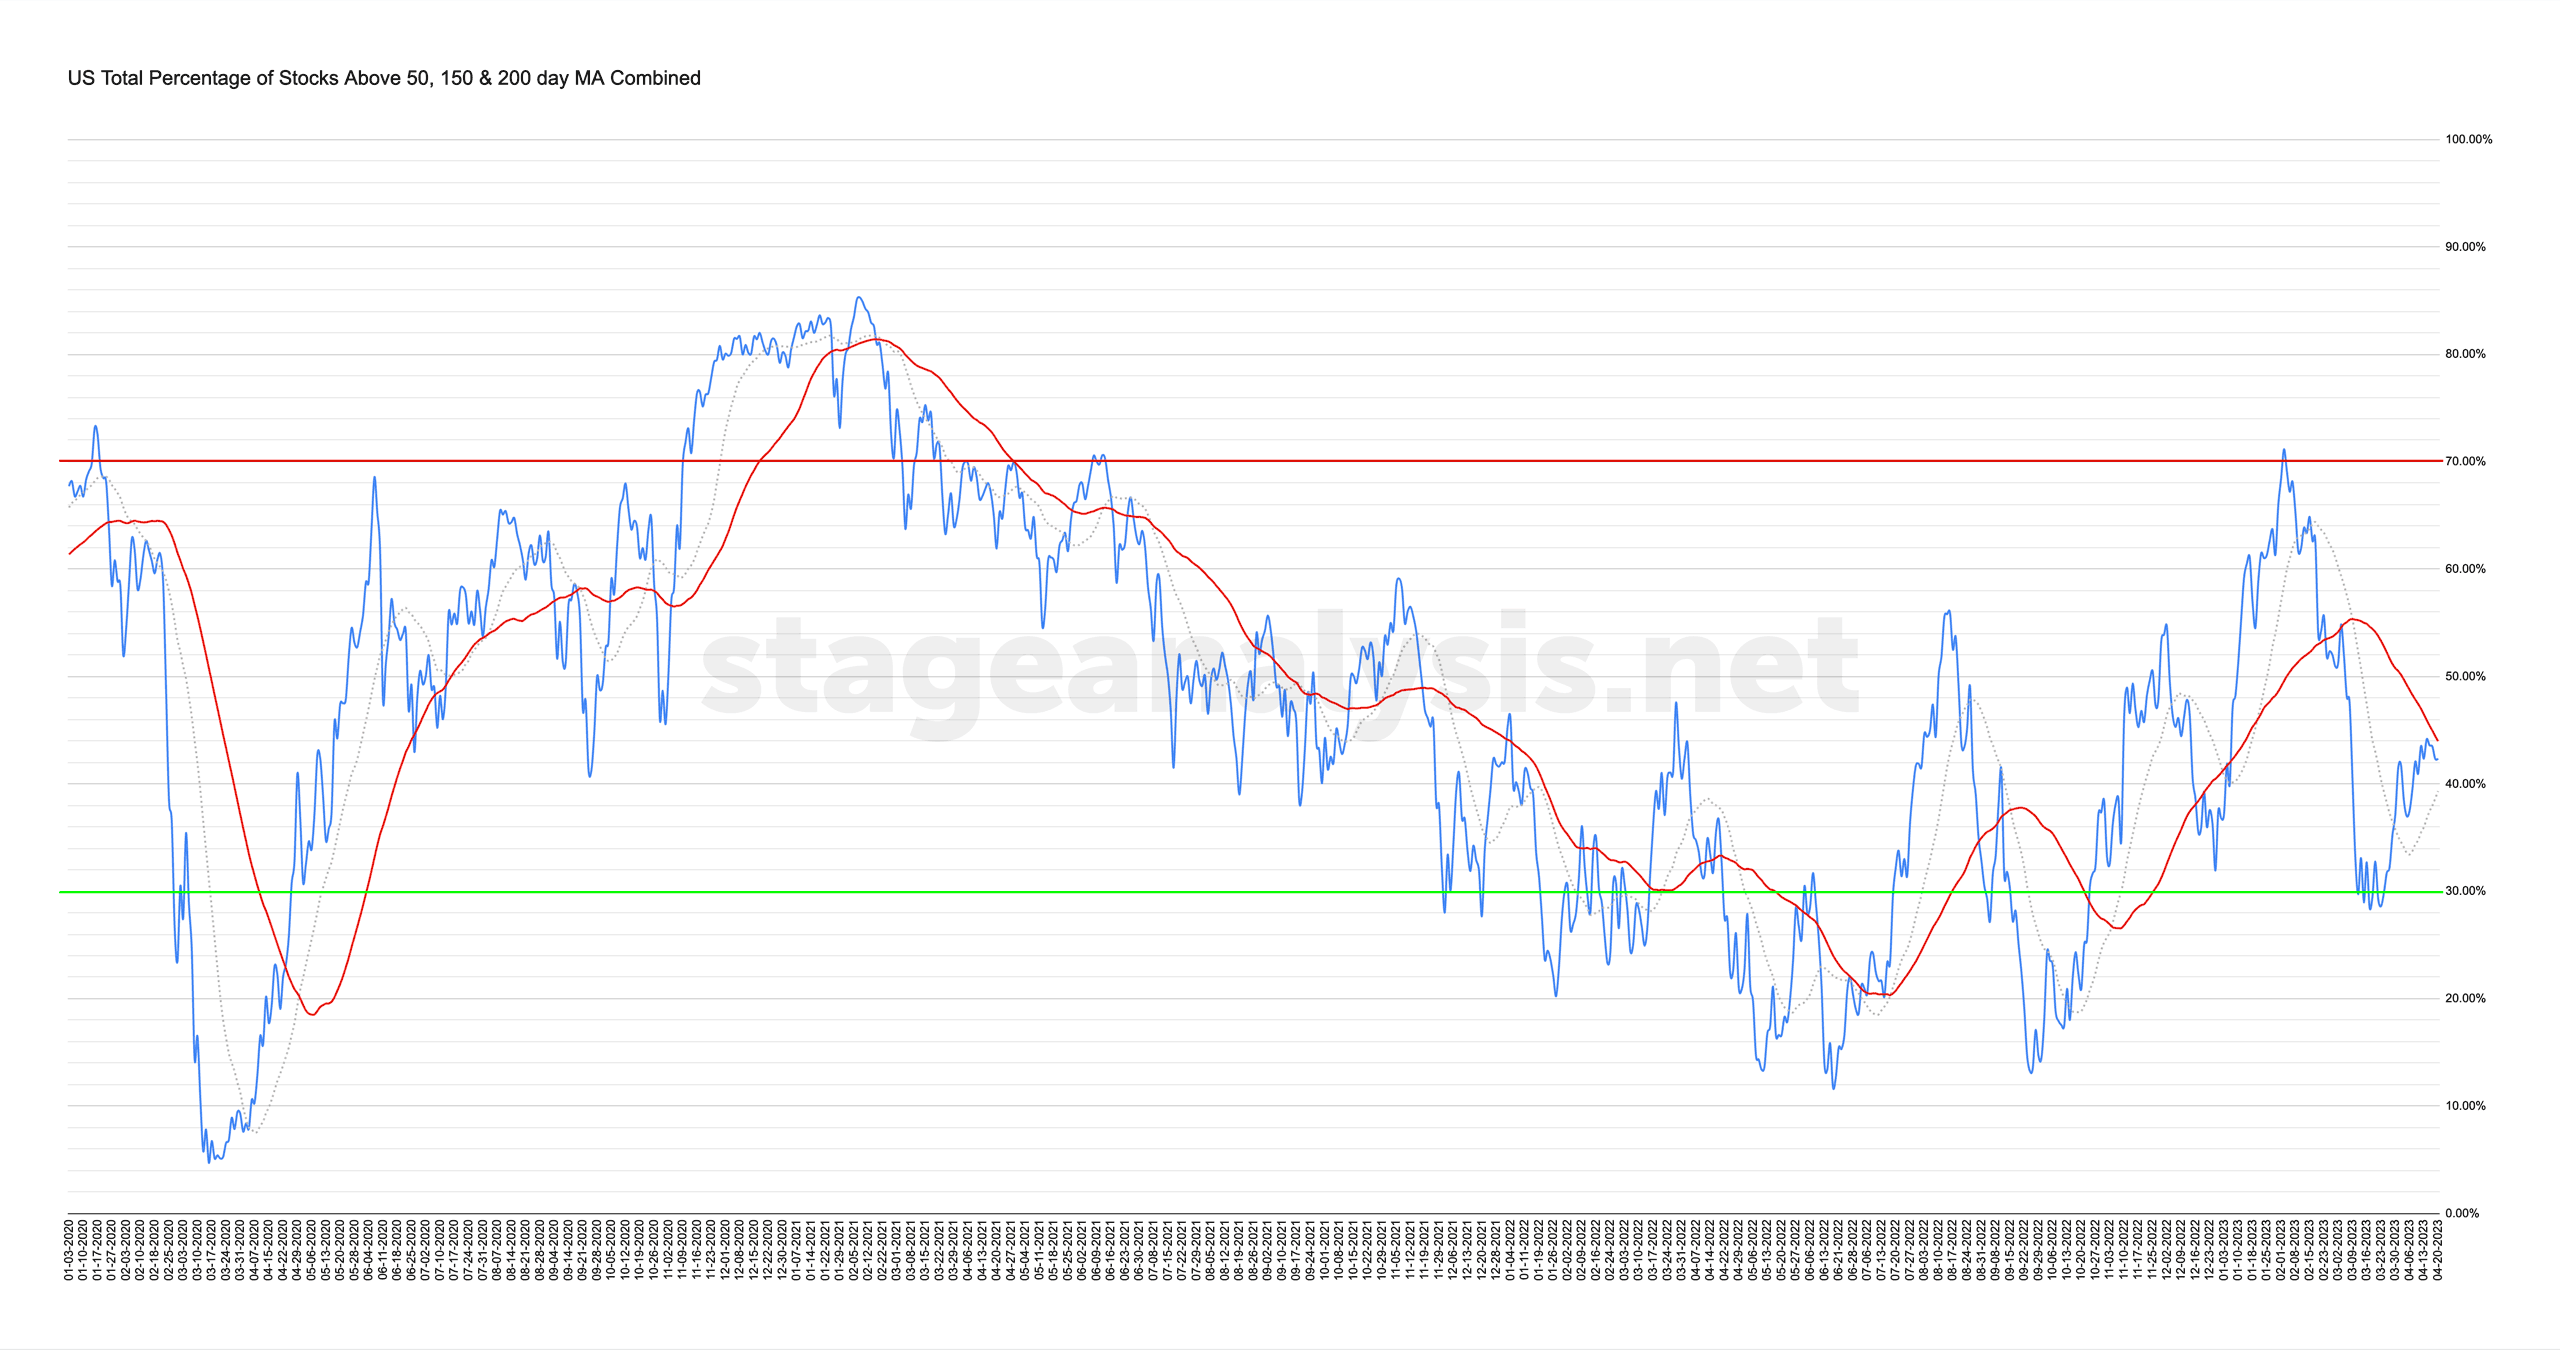
42.36% (0.00% 1wk)
Status: Neutral Environment – Stage 1 zone
The US Total Percentage of Stocks above their 50 Day, 150 Day & 200 Day Moving Averages (shown above) ended unchanged this week, with only a minor gain in the Nasdaq data and minor decline in the NYSE data.
Therefore, the overall combined average remains at 42.36% in the US market (NYSE and Nasdaq markets combined) above their short, medium and long term moving averages, which is in lower-middle zone.
The overall average has continued to hold above its short-term 20 day MA for sixteen days, but the distance above the 20 day MA has tightened up this week to +3.04%. However, it still remains below its own 50 day MA signal line. However, the gap has once again tightened, and is now -1.62%.
So with the combined average in between its 20 day MA and 50 day MA, the status remains the same this week on a Neutral Environment status, and remains at the lower end of the Stage 1 zone (Between the 40% and 60% range).
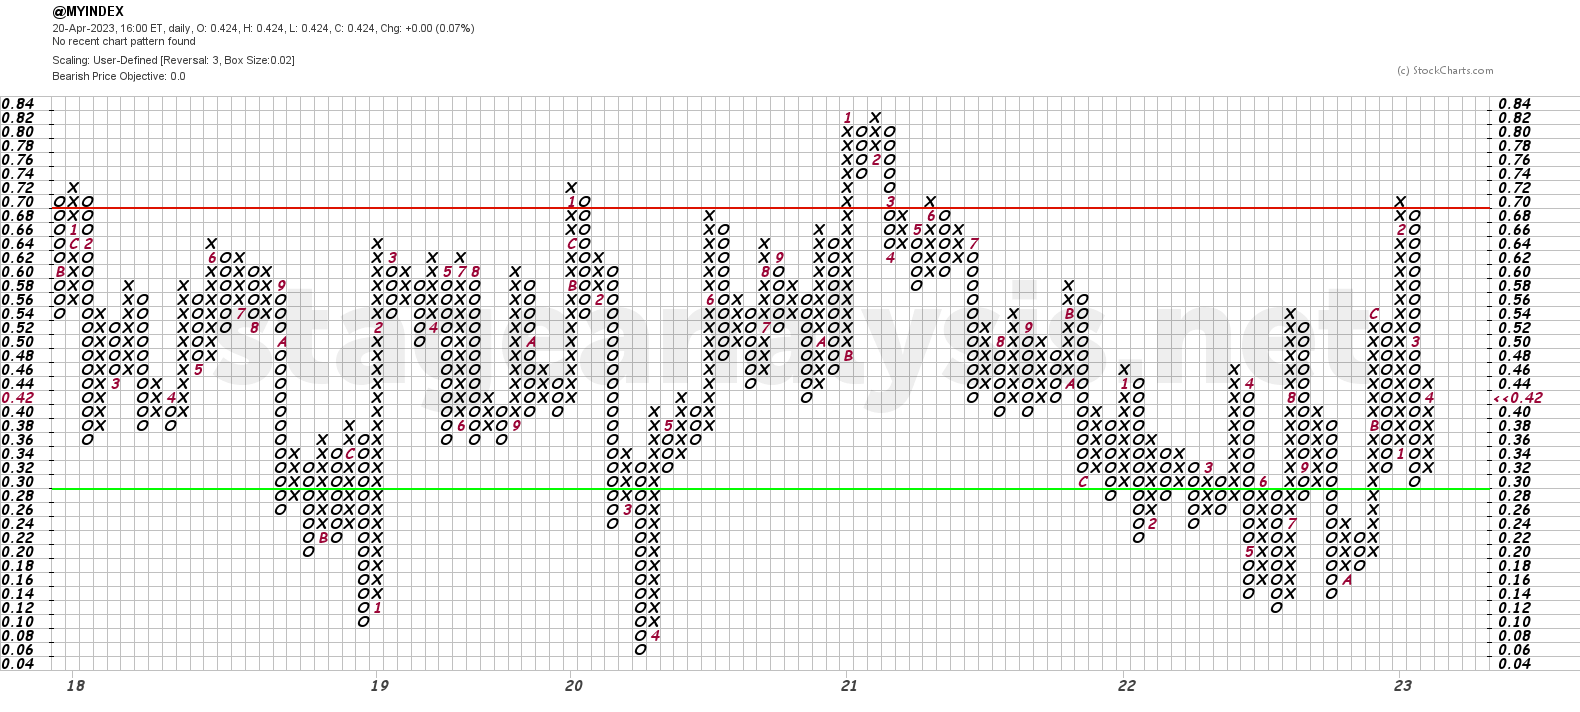
The Point and Figure (P&F) chart (shown above) added another one X to its current column this week, which keeps it on Offense (as it's in a column of Xs), and the P&F status remains on Bear Correction status
So the Offensive team remains on the field, but with the unchanged field position, cautious testing of the long side. i.e. progressive exposure continues to seem prudent.
Become a Stage Analysis Member:
To see more like this – US Stocks watchlist posts, detailed videos each weekend, use our unique Stage Analysis tools, such as the US Stocks & ETFs Screener, Charts, Market Breadth, Group Relative Strength and more...
Join Today
Disclaimer: For educational purpose only. Not investment advice. Seek professional advice from a financial advisor before making any investing decisions.