
Market Breadth: Average True Range – S&P 1500 Stocks
The full post is available to view by members only. For immediate access:
A different type of post tonight with the market weakening in the near-term, and multiple recent Stage 2 breakout attempts failing and falling back into their Stage 1 bases. So I though it would be interesting to explain a custom market breadth indicator that I've been working on.
The 3x Average True Range (ATR) bands via the Keltner Channels indicator is a concept that I've been using for many years, since I first learned it from studying Alexander Elder's methods, as it can give a very useful guide for short-term trends, when stocks are extended from their normal range, it can even help with position sizing and stop loss positioning. So it can be very useful in multiple ways.
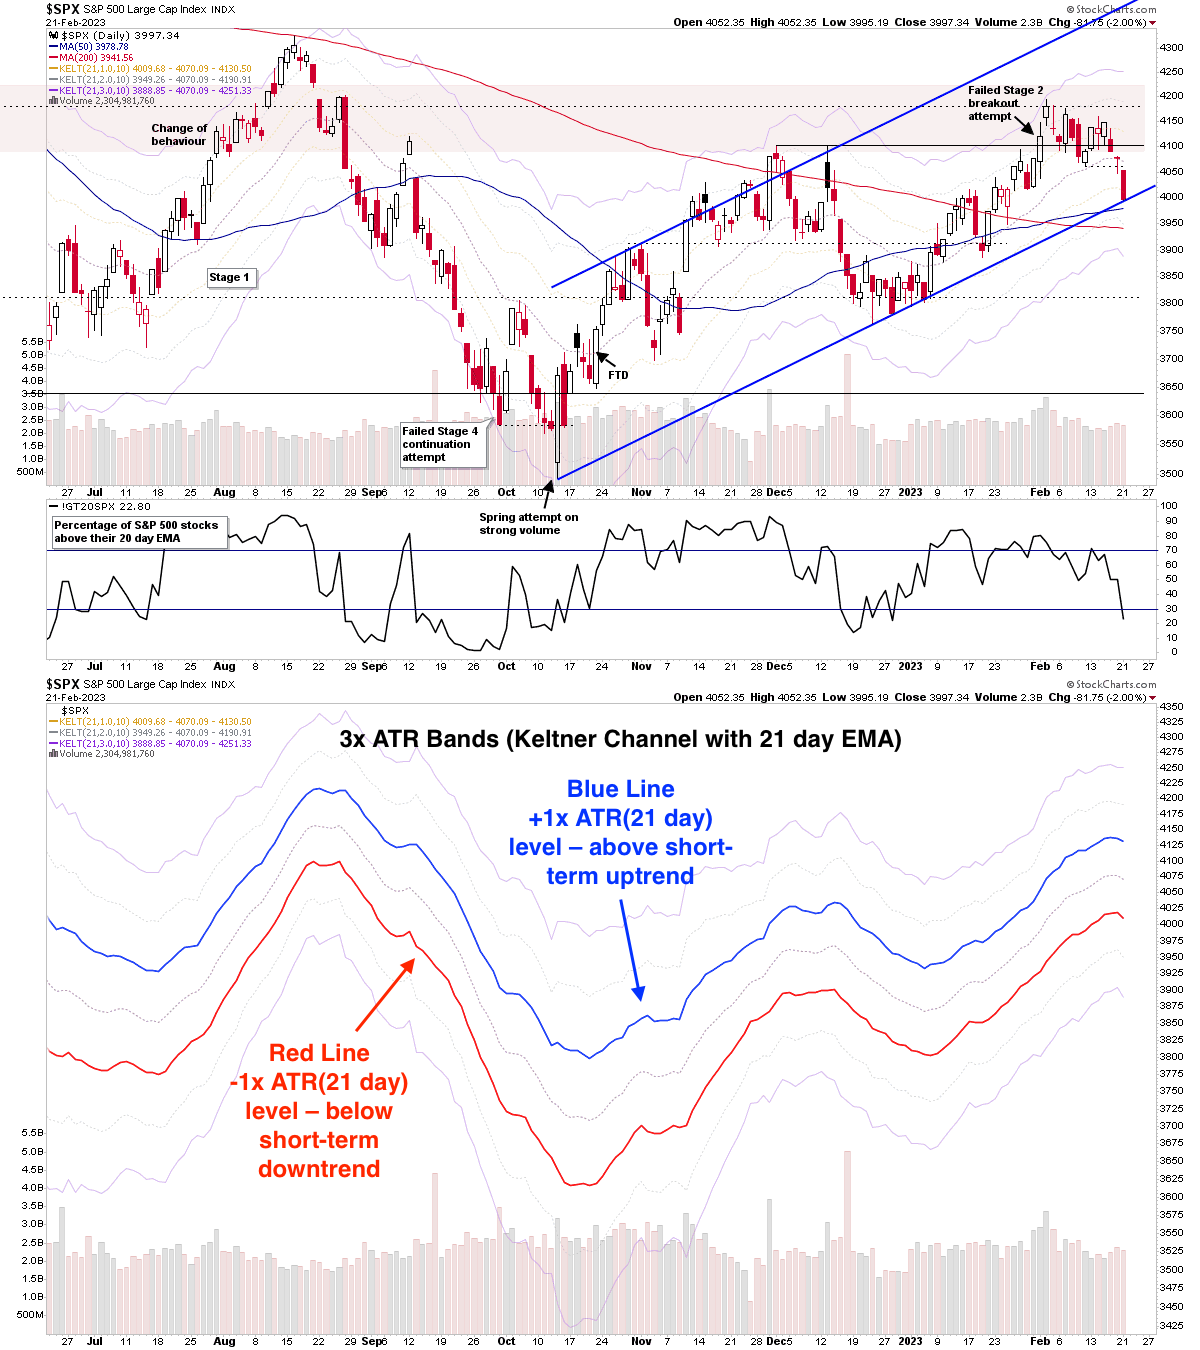
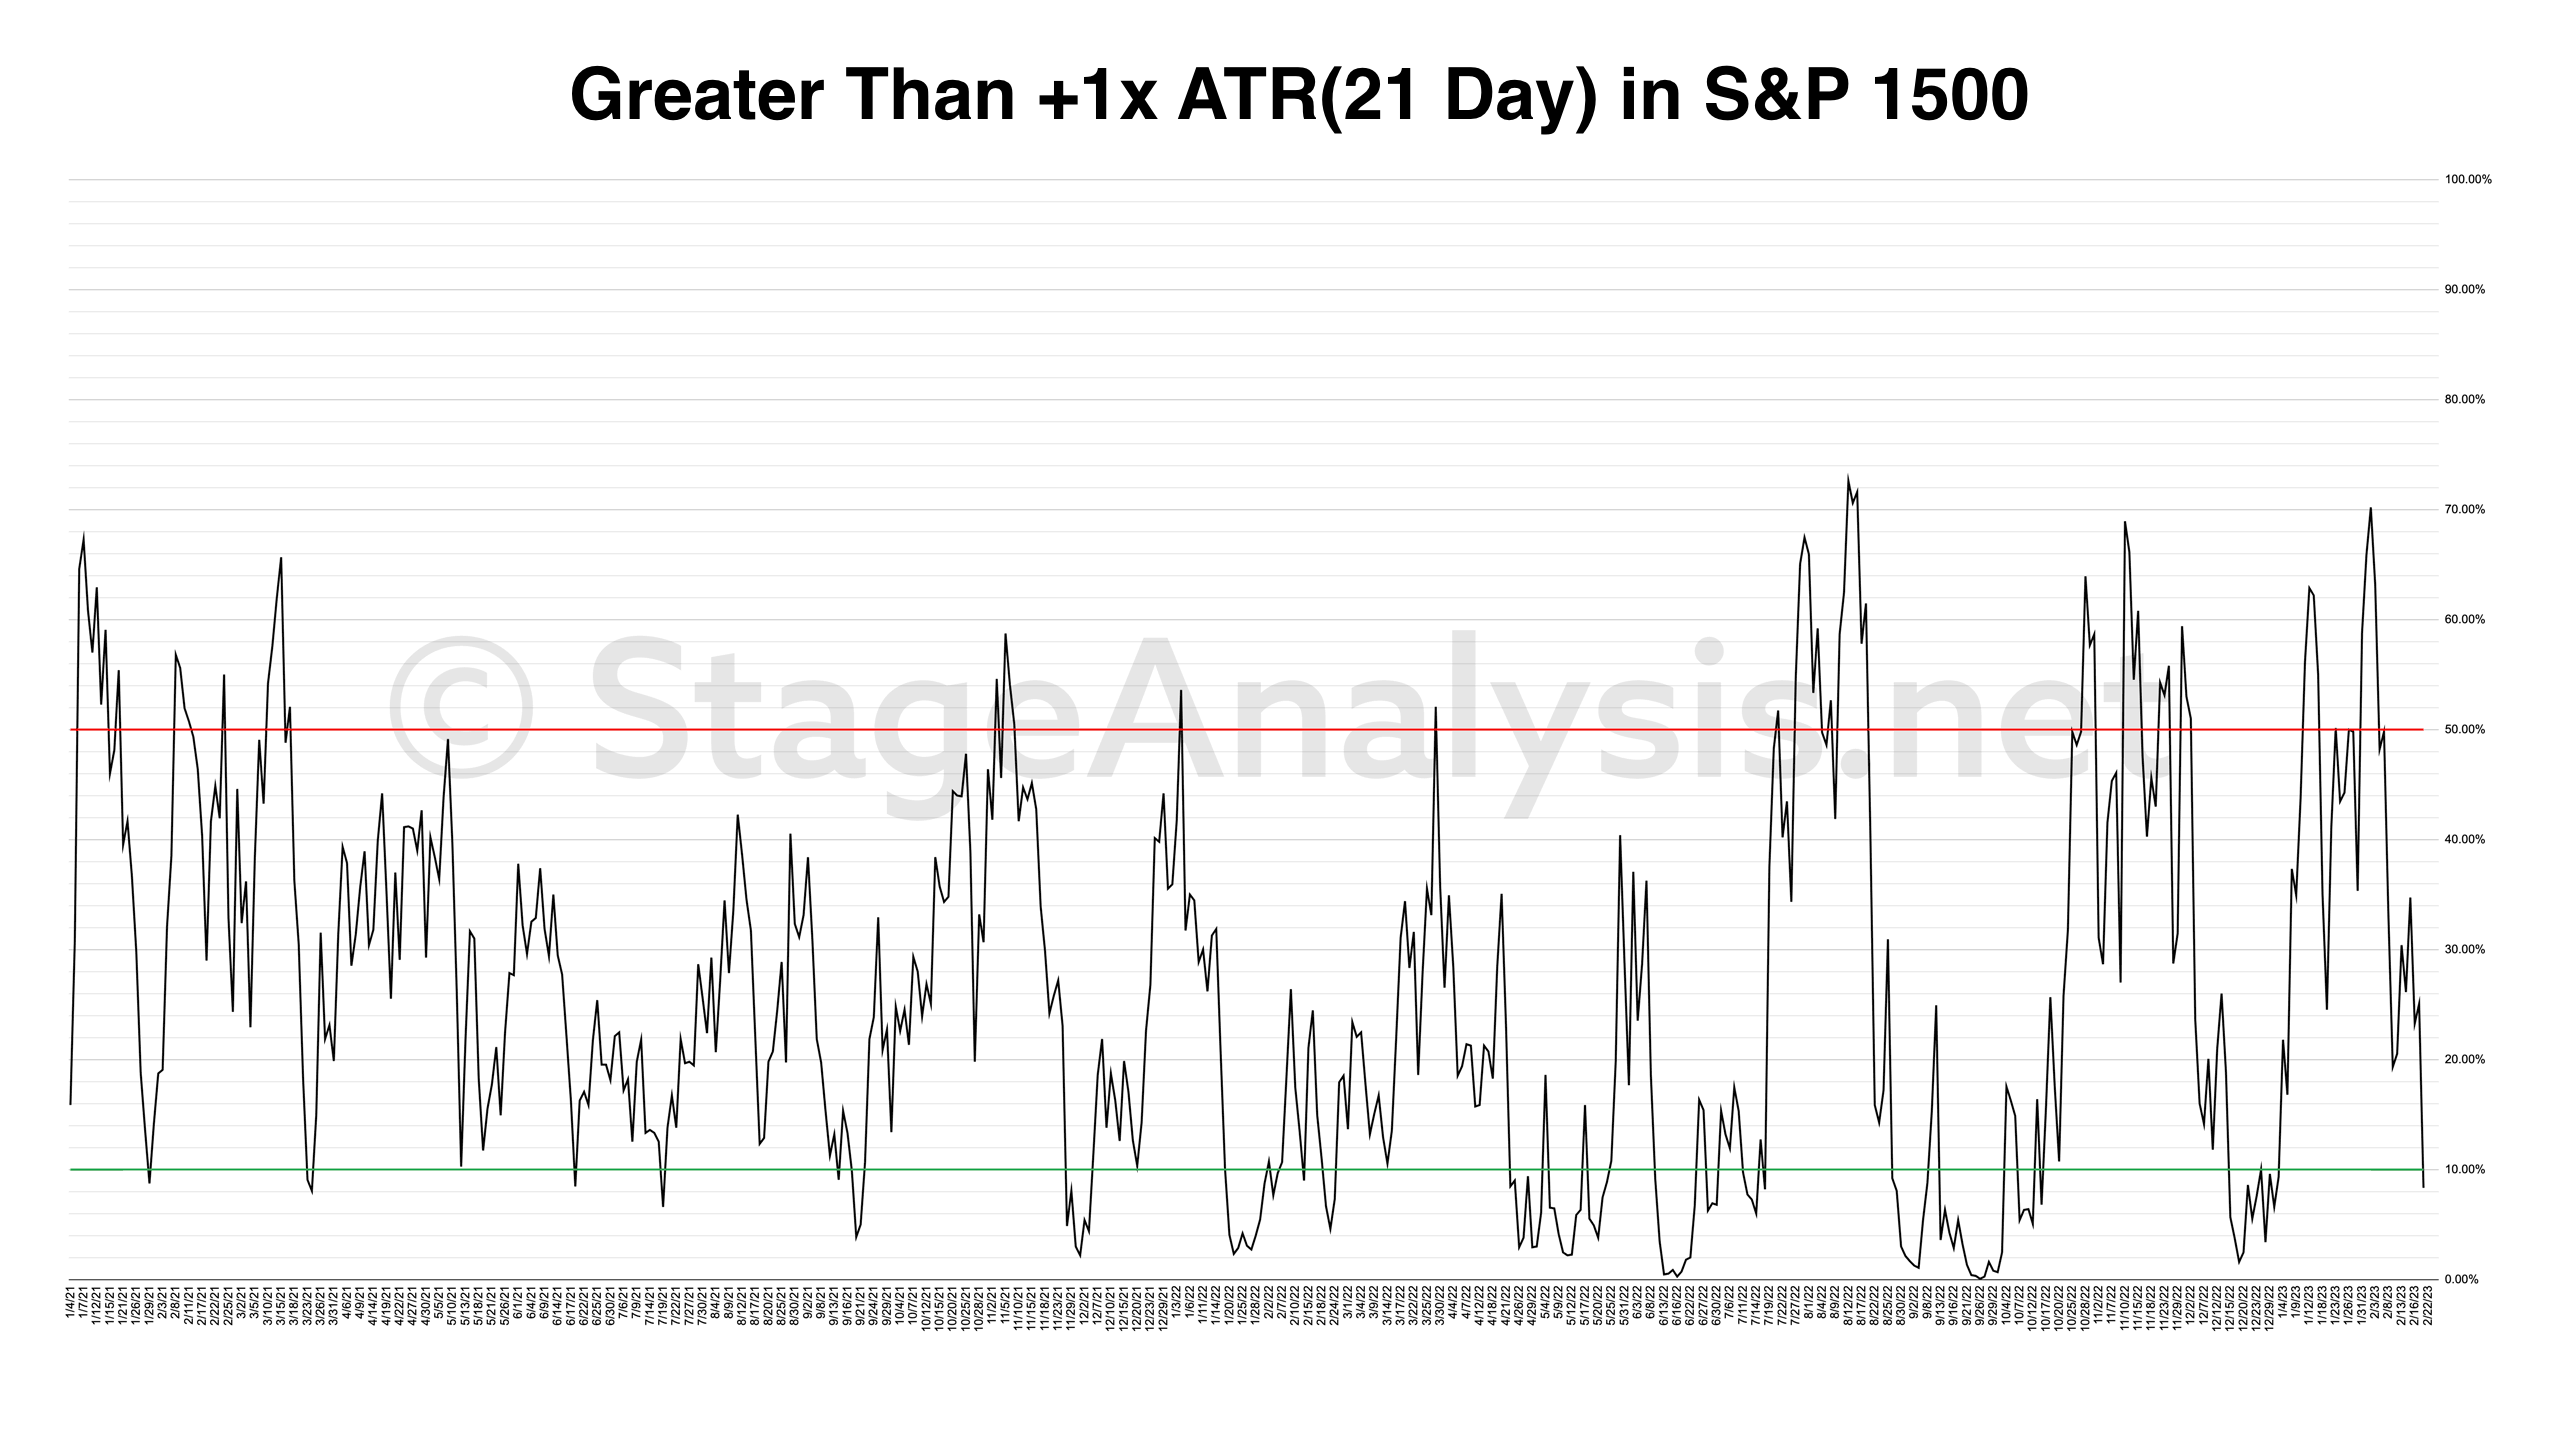
But a more recent adaption of it that I've developed, is using it as a custom market breadth indicator by measuring the amount of stocks above their +1x ATR(21 day) level, and comparing that to the amount of stocks below their -1x ATR(21 day) level. As when stocks are trading above their +1x 21 day Average True Range level, it indicates that they are in a potential short-term uptrend, and vice versa when stocks are trading below their -1x 21 day Average True Range level, it indicates that they are in a potential short-term downtrend.
So by measuring these in a consistent, but broad enough group like the S&P 1500 (which covers the S&P 500 Large Caps, S&P 400 Mid Caps and the S&P 600 Small Caps), we can get a good idea of the overall market health and whether it is extended at an extreme level or more neutral.
I've included the S&P 500 chart above with the 3x ATR(21 day) Keltner Channels overlaid, and a separate version of the ATR bands below it, highlighting the + level (blue) and - level (red) to hopefully help you understand what the follow charts represent.
The full post and charts is available for members only
Become a Stage Analysis Member:
To see more like this – US Stocks watchlist posts, detailed videos each weekend, use our unique Stage Analysis tools, such as the US Stocks & ETFs Screener, Charts, Market Breadth, Group Relative Strength and more...
Join Today
Disclaimer: For educational purpose only. Not investment advice. Seek professional advice from a financial advisor before making any investing decisions.