
Market Breadth: Percentage of Stocks Above their 50 Day, 150 Day & 200 Day Moving Averages Combined
The full post is available to view by members only. For immediate access:
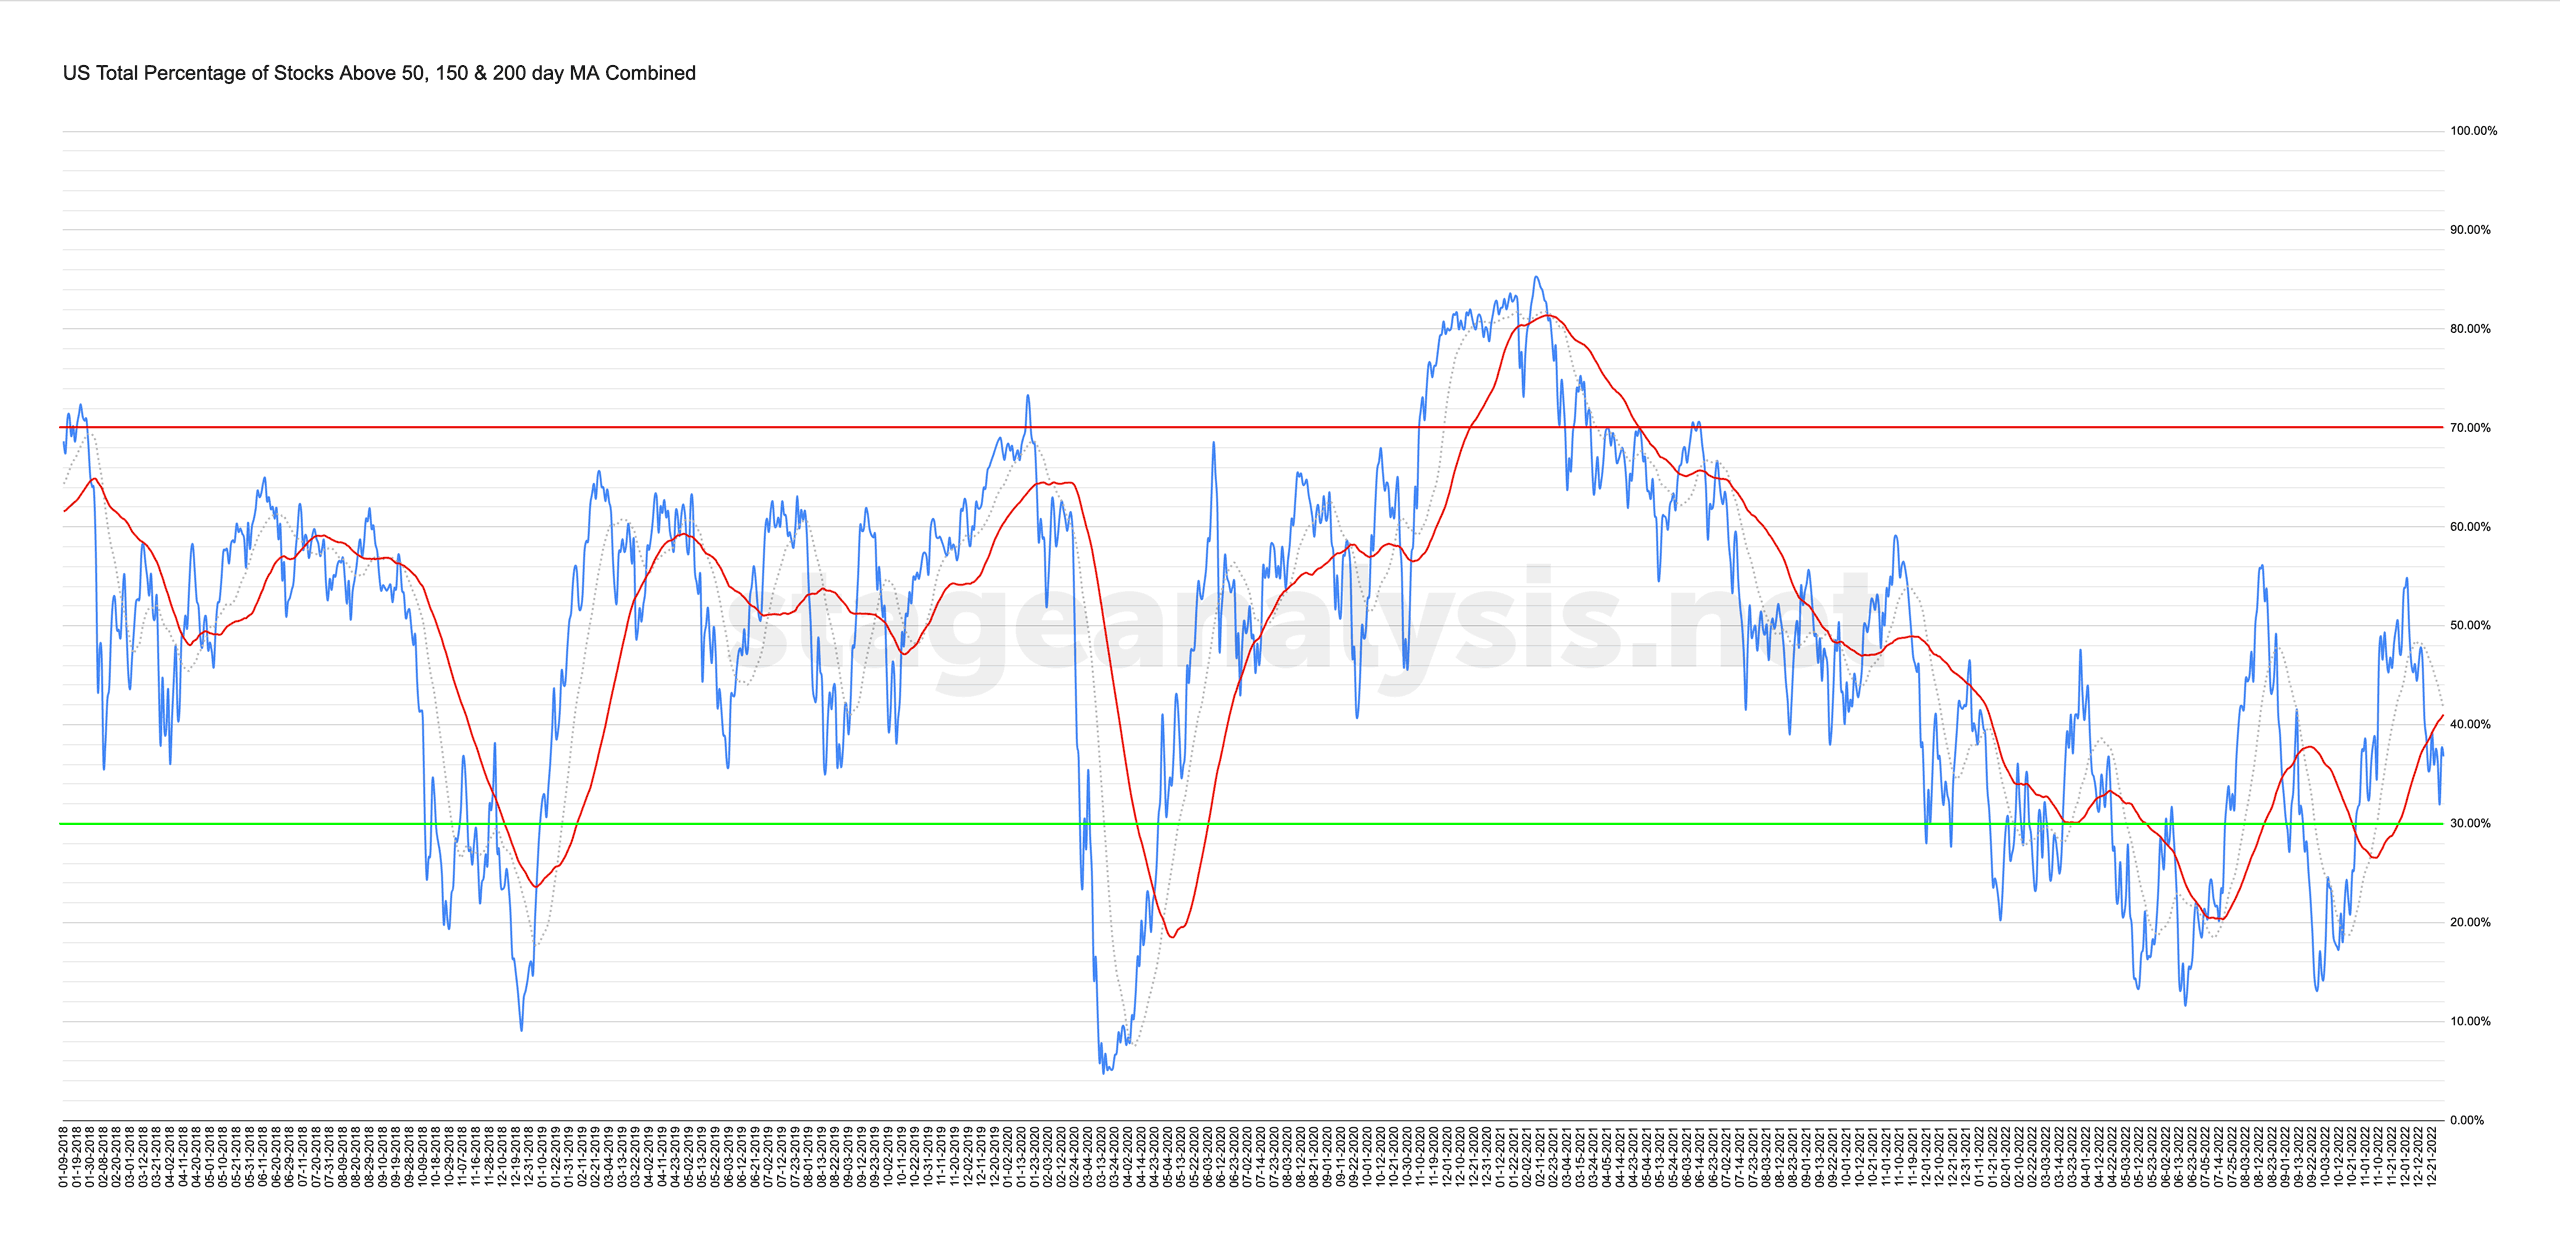
36.79% (-0.78% 1wk)
Status: Difficult Environment (borderline between Stage 1 and Stage 4 zone)
The US Total Percentage of Stocks above their 50 Day, 150 Day & 200 Day Moving Averages (shown above) ended the week slightly lower again by -0.78%, but did drop further midweek, but recovered most of the decline.
So at 36.79% it continues to be below its own 50 day MA for another week and so it continues to be on Difficult Environment status in borderline territory between the Stage 1 and Stage 4 zones.
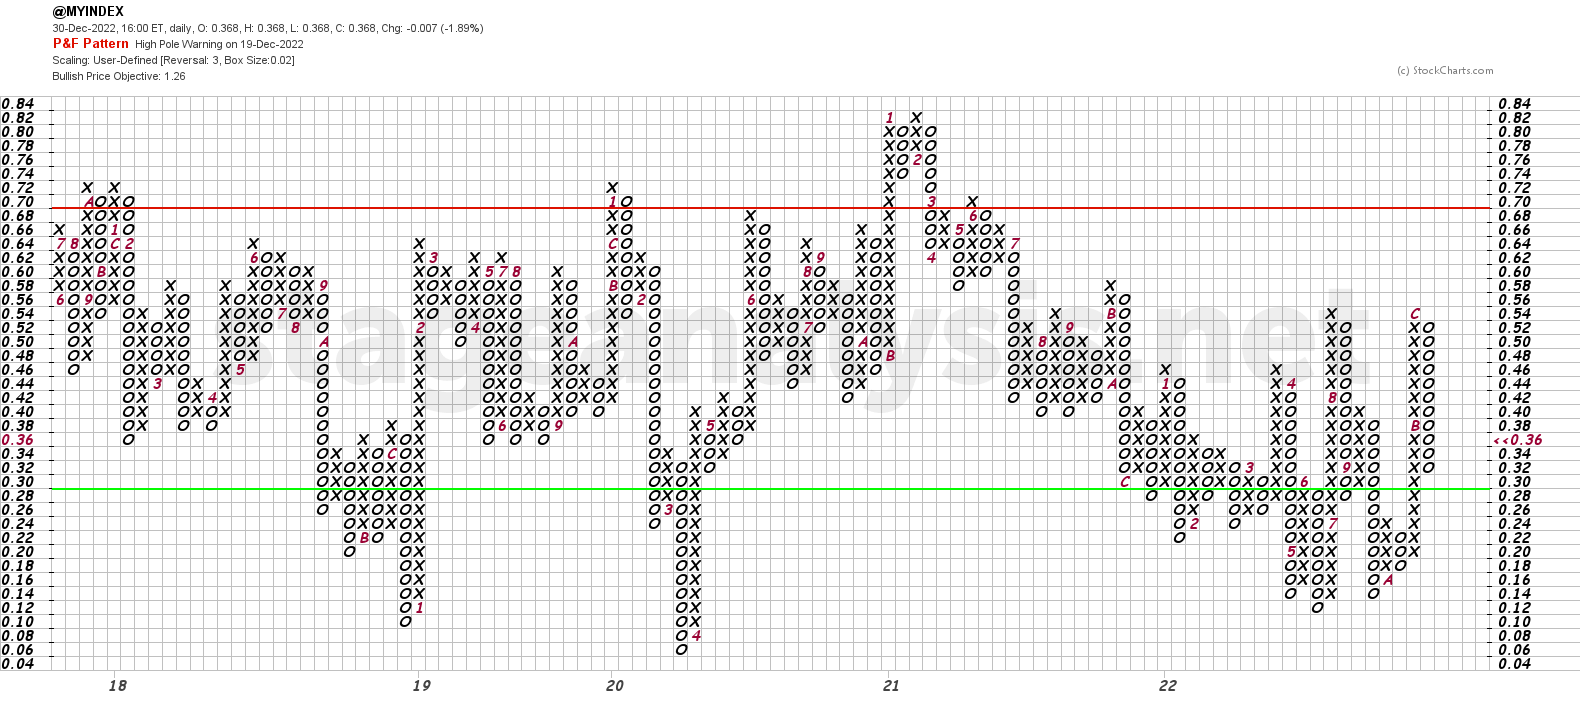
The Point and Figure chart (shown above) declined a further 2 Os in its current column of Os and remains below the midpoint of the prior column of Xs, and so the High Pole Warning remains and the P&F status continues to be on Bull Correction status, which keeps the P&F strategy on Defense.
In order to reverse to a column of Xs, and change the strategy to Offense, the price would need to close above the 38% level.
Become a Stage Analysis Member:
To see more like this – US Stocks watchlist posts, detailed videos each weekend, use our unique Stage Analysis tools, such as the US Stocks & ETFs Screener, Charts, Market Breadth, Group Relative Strength and more...
Join Today
Disclaimer: For educational purpose only. Not investment advice. Seek professional advice from a financial advisor before making any investing decisions.