
Market Breadth: Percentage of Stocks Above their 50 Day, 150 Day & 200 Day Moving Averages Combined
The full post is available to view by members only. For immediate access:
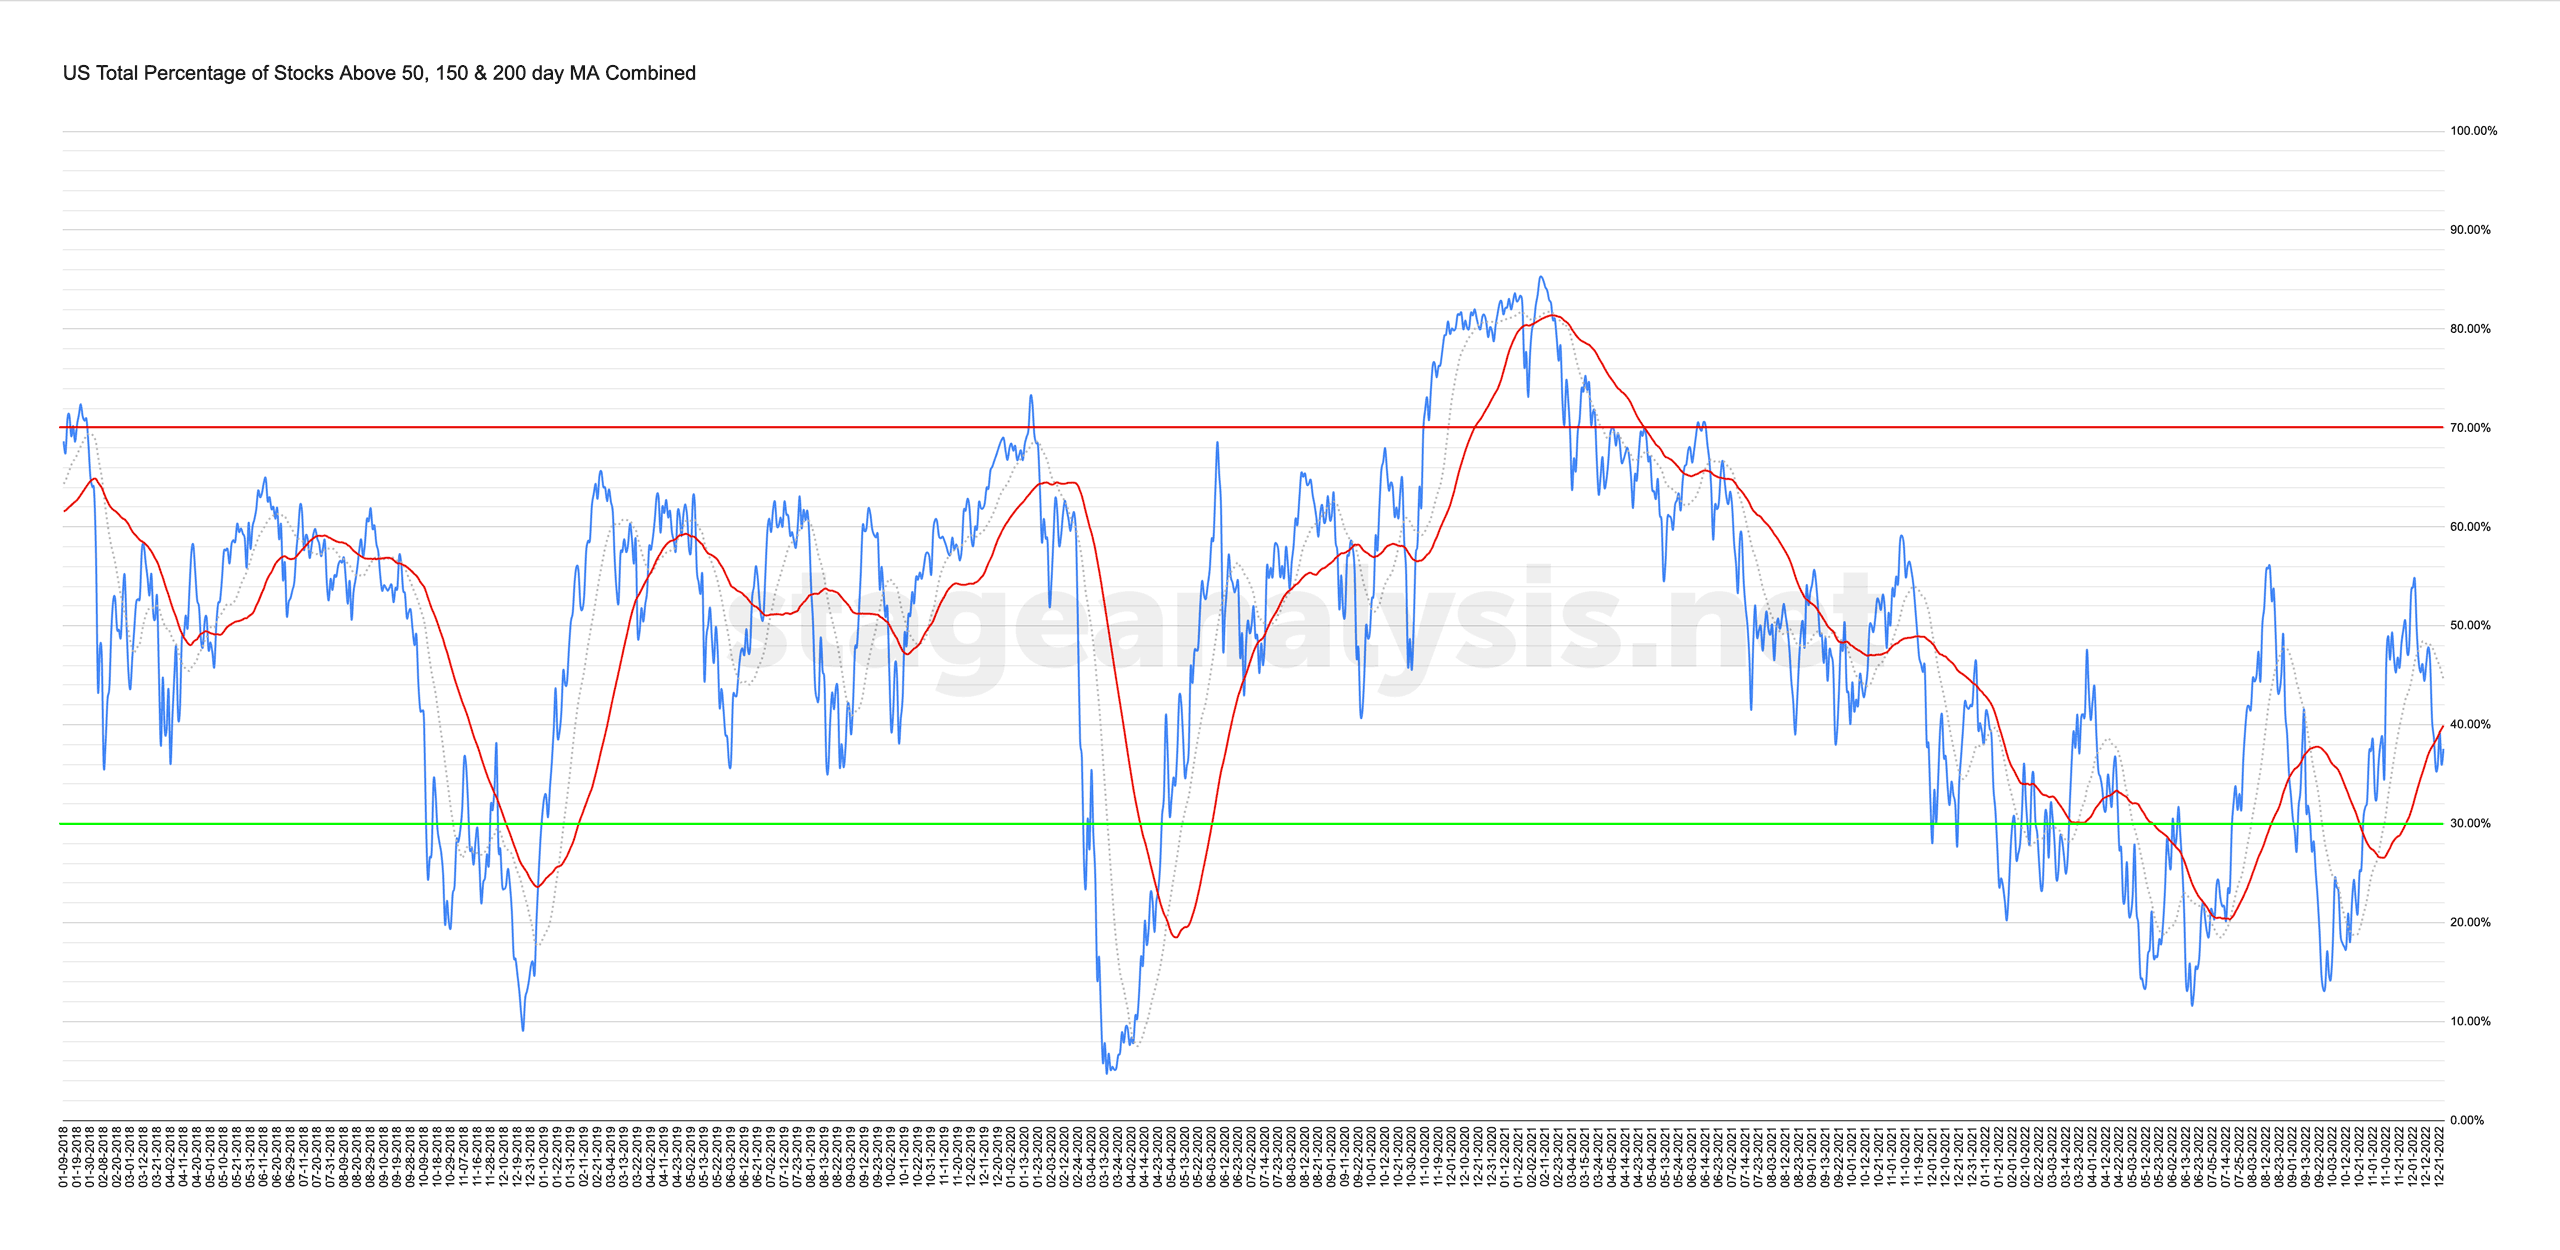
37.58% (-1.04% 1wk)
Status: Difficult Environment (borderline between Stage 1 and Stage 4 zone)
The US Total Percentage of Stocks above their 50 Day, 150 Day & 200 Day Moving Averages (shown above) ended the week slightly lower by -1.04%, after dropping below its own 50 day MA on Monday that we use as the signal line for the statuses. It pulled back above it briefly on Wednesday, but fell back below on Thursday once more. Closing the week under the 50 day MA for the first time since the 24th October.
So at 37.58% it remains in borderline territory between the Stage 1 and Stage 4 zones, but with the weekly close back below the 50 day MA signal line. The environment status changes from Neutral to Difficult Environment status.
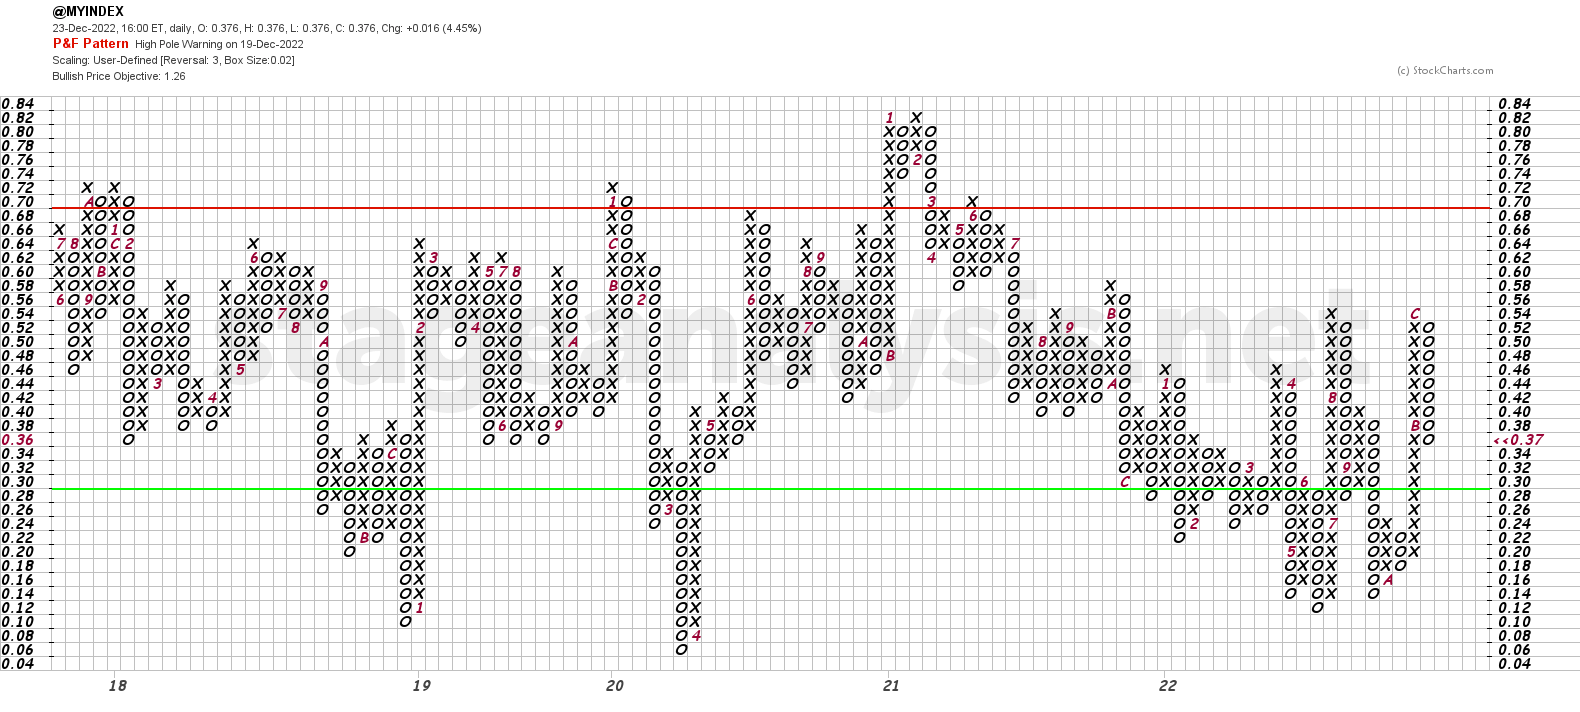
The Point and Figure chart (shown above) added a further 2 Os to its current column, and has now pulled back more than half of the prior column. So the P&F strategy remains on Defense (as it is in a column of Os) and the P&F status continues to be on Bull Correction status, but in a weaker position as it gave a High Pole Warning on the 19th December.
Become a Stage Analysis Member:
To see more like this – US Stocks watchlist posts, detailed videos each weekend, use our unique Stage Analysis tools, such as the US Stocks & ETFs Screener, Charts, Market Breadth, Group Relative Strength and more...
Join Today
Disclaimer: For educational purpose only. Not investment advice. Seek professional advice from a financial advisor before making any investing decisions.