
Market Breadth: Percentage of Stocks Above their 50 Day, 150 Day & 200 Day Moving Averages Combined
The full post is available to view by members only. For immediate access:
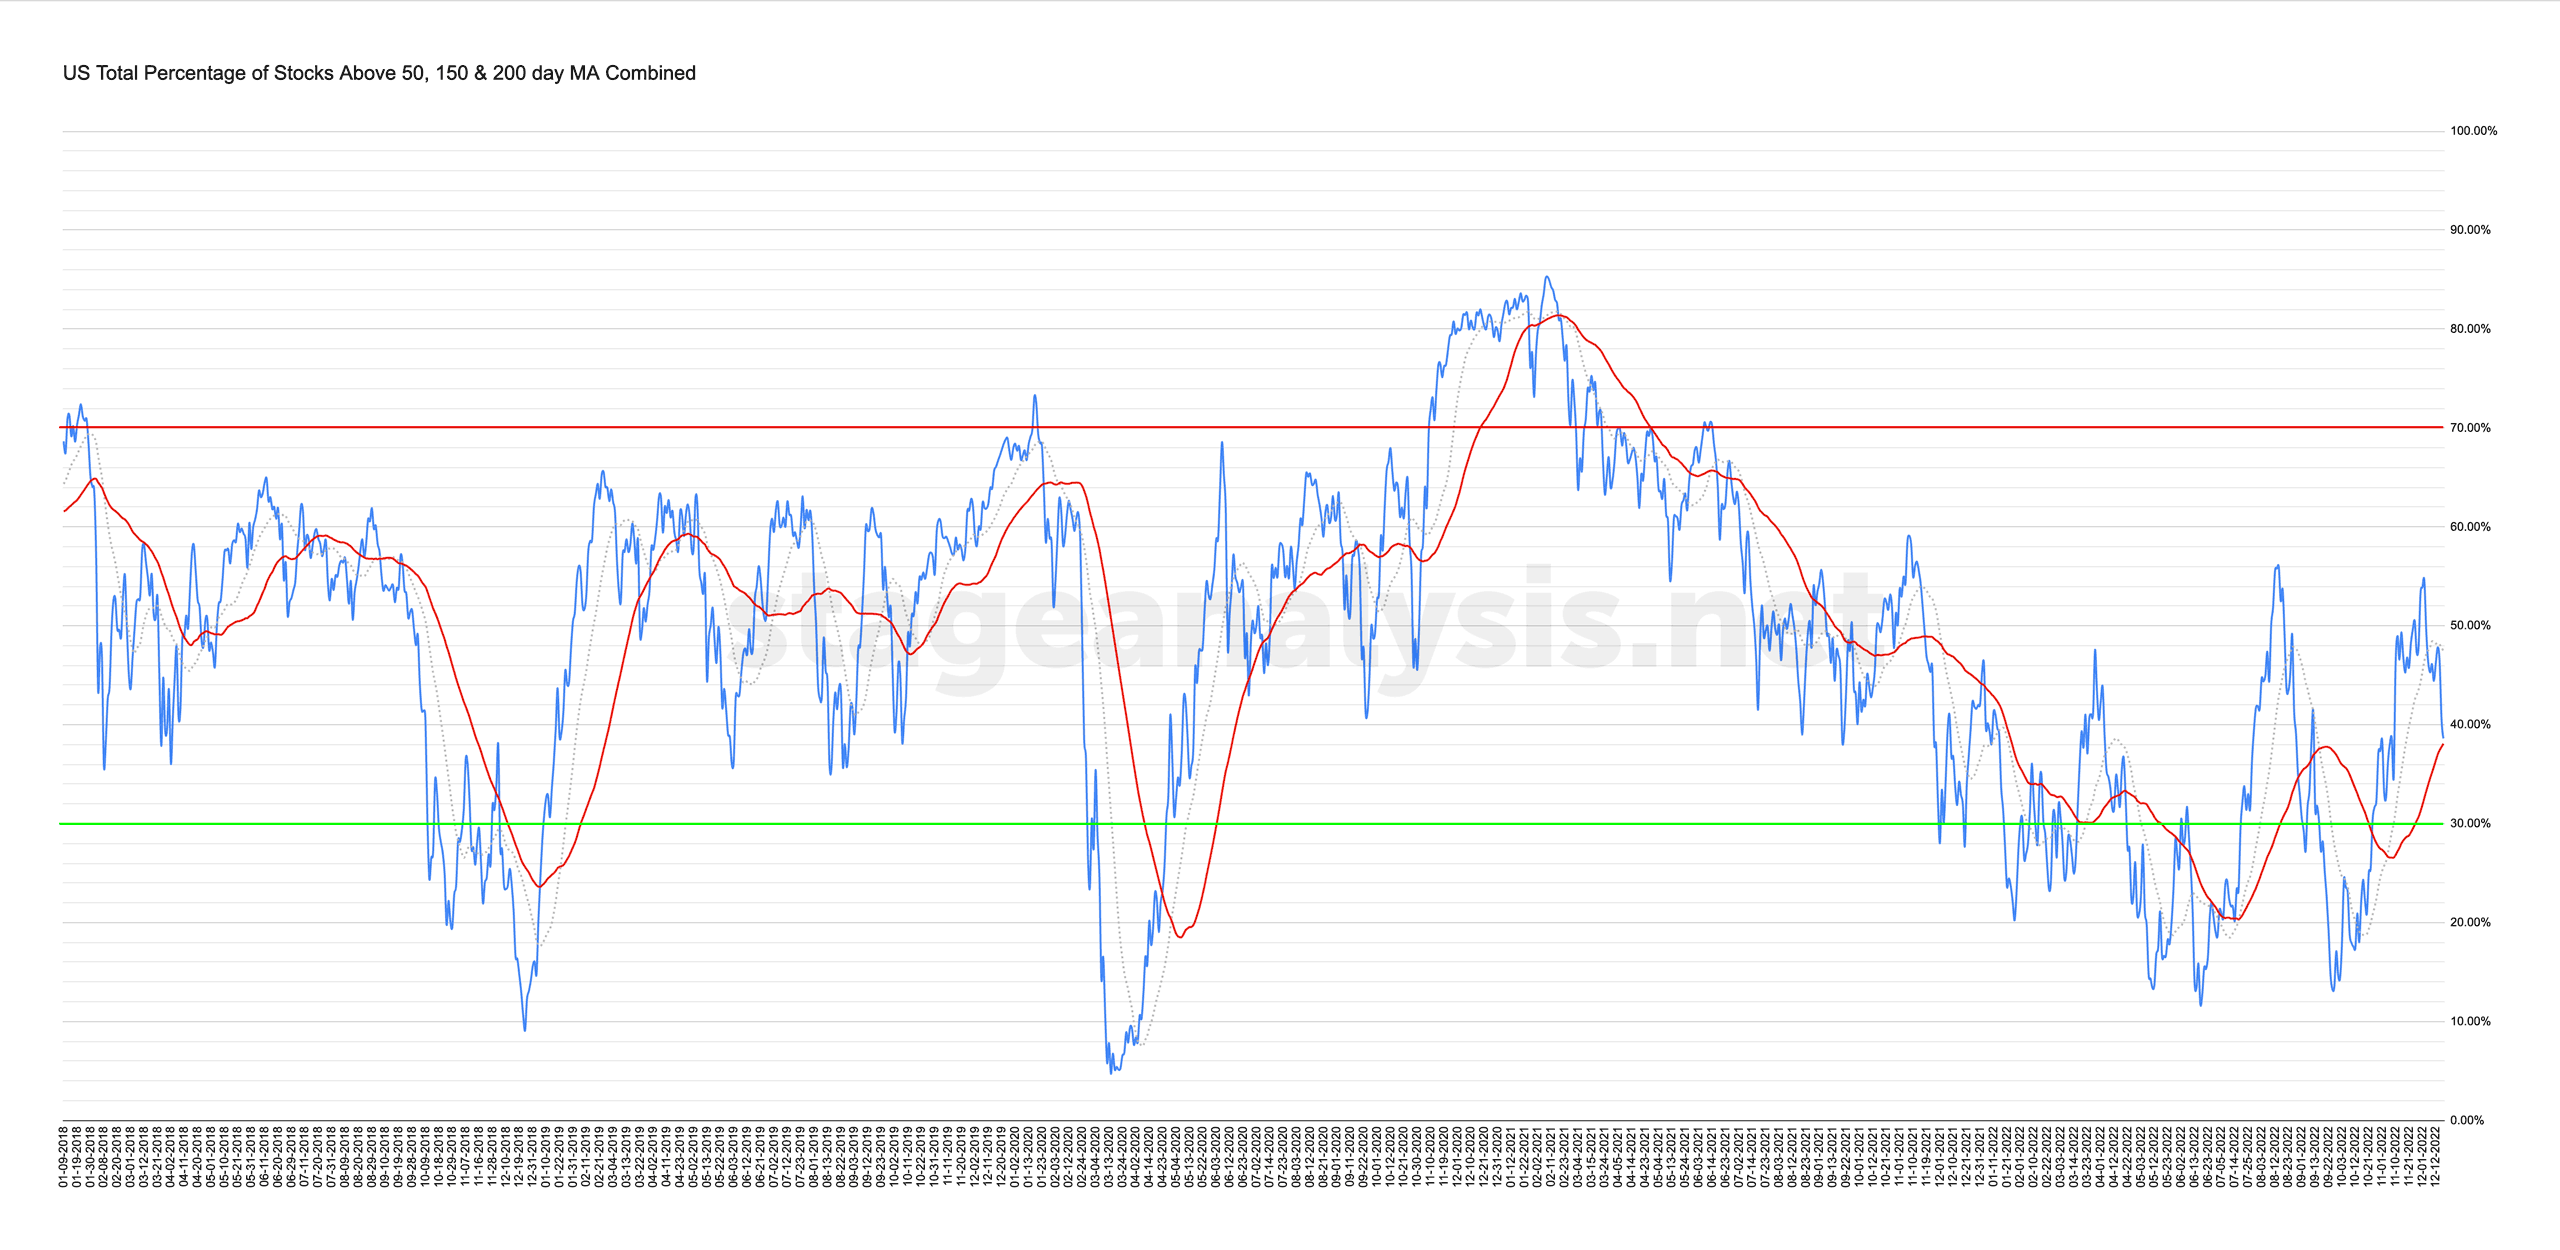
38.62% (-5.81% 1wk)
Status: Neutral Environment (borderline between Stage 1 and Stage 4 zone)
The US Total Percentage of Stocks above their 50 Day, 150 Day & 200 Day Moving Averages (shown above) continued its decline this week, closing a further -5.81% down week on week, after an initial move higher on Monday and Tuesday. So at 38.62% it has moved into borderline territory of potentially moving back into the Stage 4 zone. But with it still above its own 50 day MA, it remains on Neutral Environment status currently. But at only 0.54% above its 50 day MA, it won't take much further deterioration for the status to change to Difficult Environment in the Stage 4 zone. So it is at a critical point.
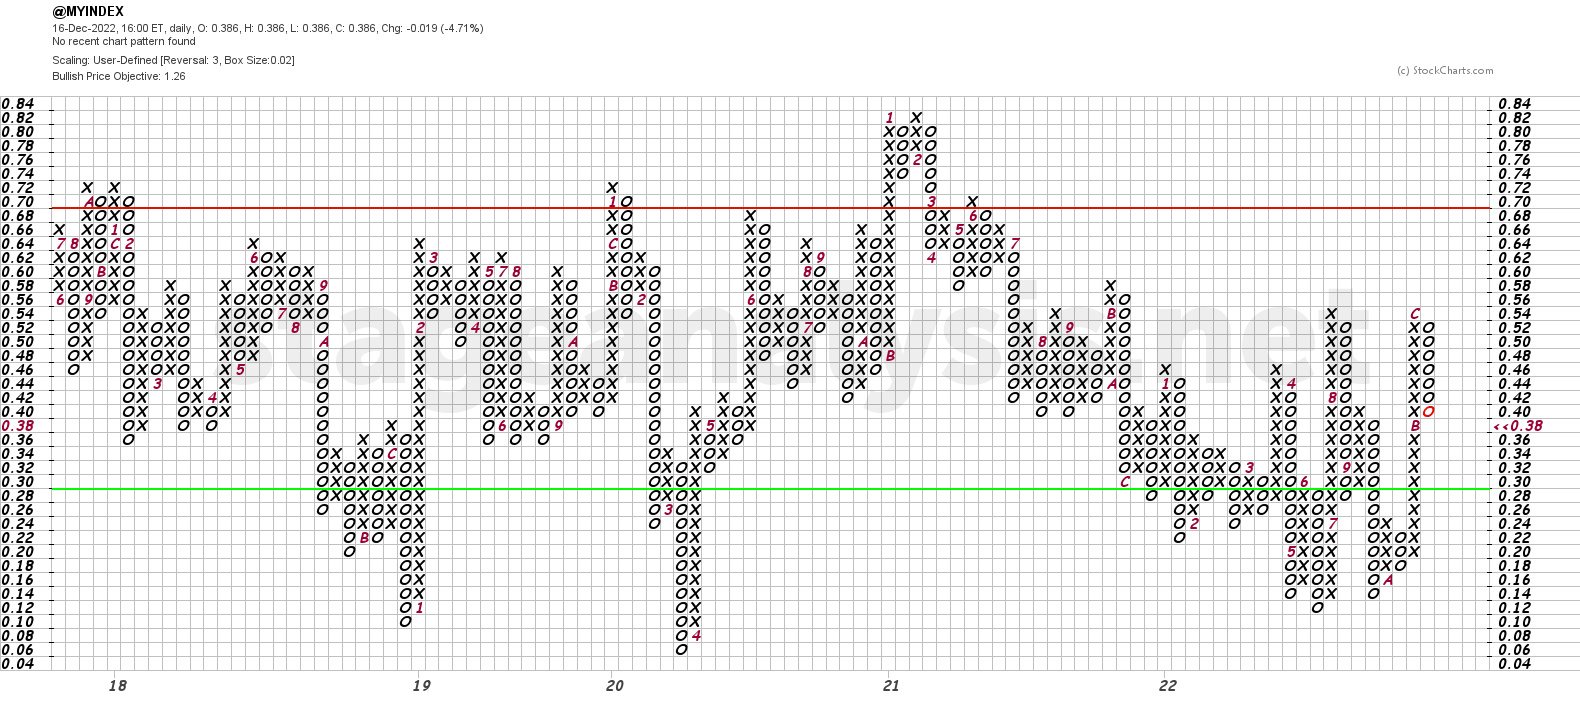
The Point and Figure chart (shown above) added a further 3 Os to its current column, and has pulled back almost half of the prior column. So the P&F strategy remains on Defense (as it is in a column of Os) and the P&F status continues to be on Bull Correction status.
Become a Stage Analysis Member:
To see more like this – US Stocks watchlist posts, detailed videos each weekend, use our unique Stage Analysis tools, such as the US Stocks & ETFs Screener, Charts, Market Breadth, Group Relative Strength and more...
Join Today
Disclaimer: For educational purpose only. Not investment advice. Seek professional advice from a financial advisor before making any investing decisions.