
Market Breadth: Percentage of Stocks Above their 50 Day, 150 Day & 200 Day Moving Averages Combined
The full post is available to view by members only. For immediate access:
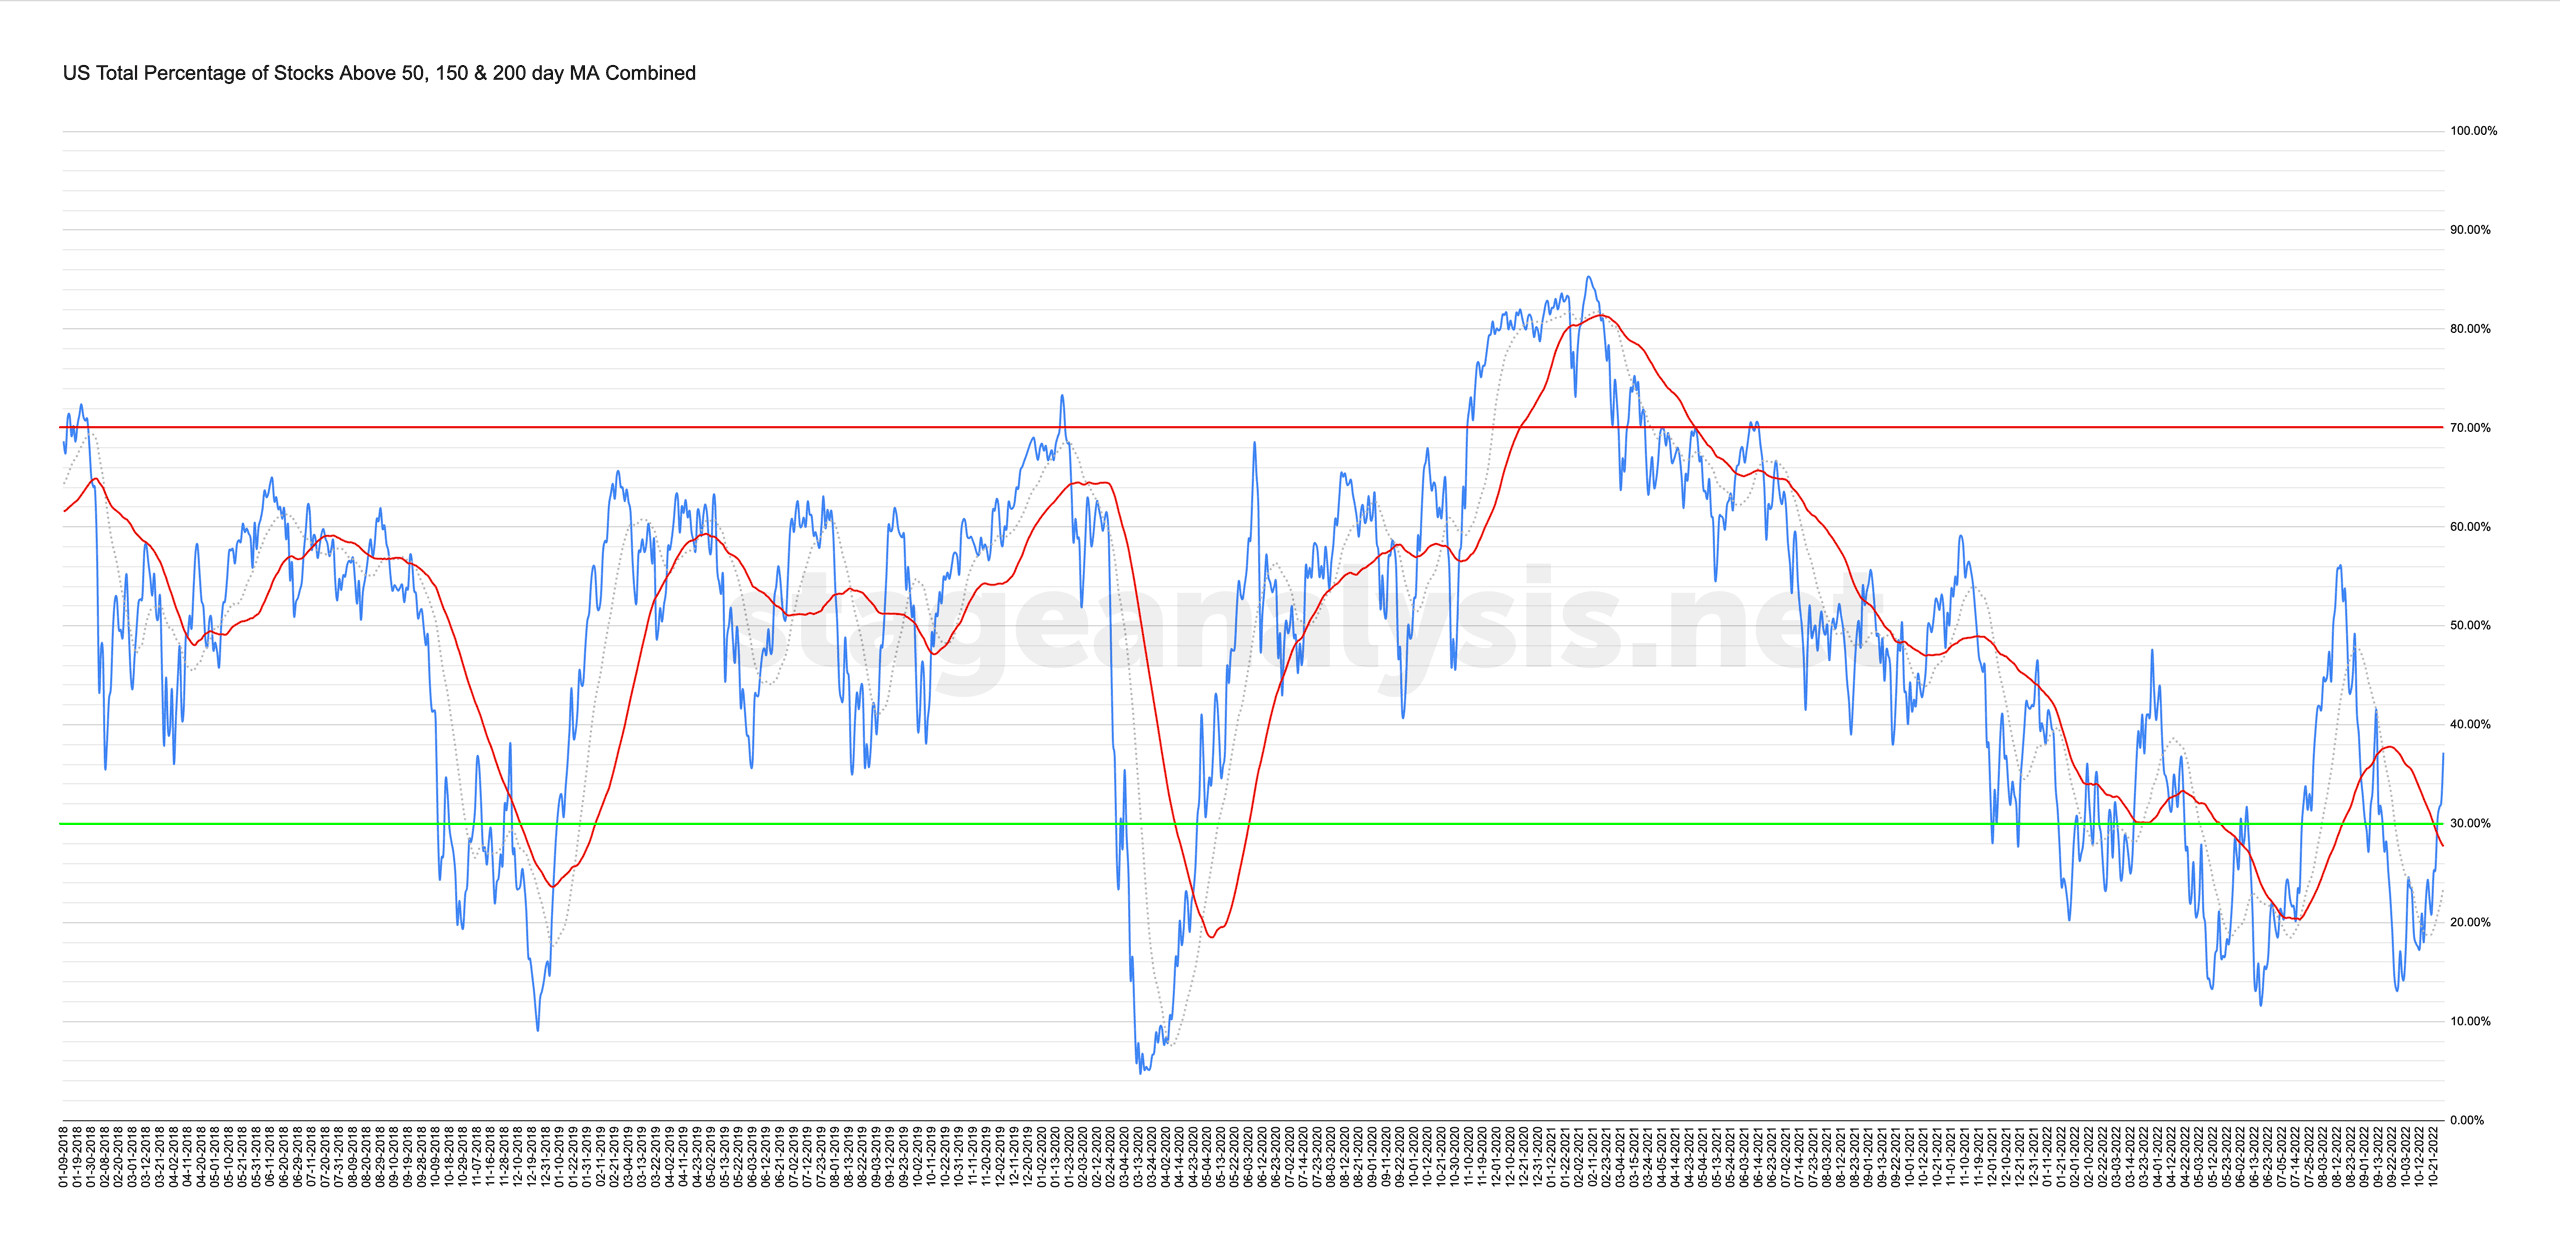
37.18% (+12.15% 1wk)
Status: Tentative Positive Environment in the Stage 4 zone
The US Total Percentage of Stocks above their 50 Day, 150 Day & 200 Day Moving Averages (shown above) surged higher for a second week by +12.15%, with the NYSE once again seeing the bulk of the weeks gains – rising by +14.68%. So with this weeks strong gains, the combined percentage of stocks average moved back above its own 50 day MA (that is used as the key signal line) on Tuesday, and closed the week at 37.18%.
Therefore, with the fairly strong close above the combined averages 50 day MA. The status has changed to a Tentative Positive Environment in the Stage 4 zone. As at 37.18%, it's still not cleared the Stage 4 zone (below 40%). But could move back into the Stage 1 zone in the coming week/s if the momentum continues.
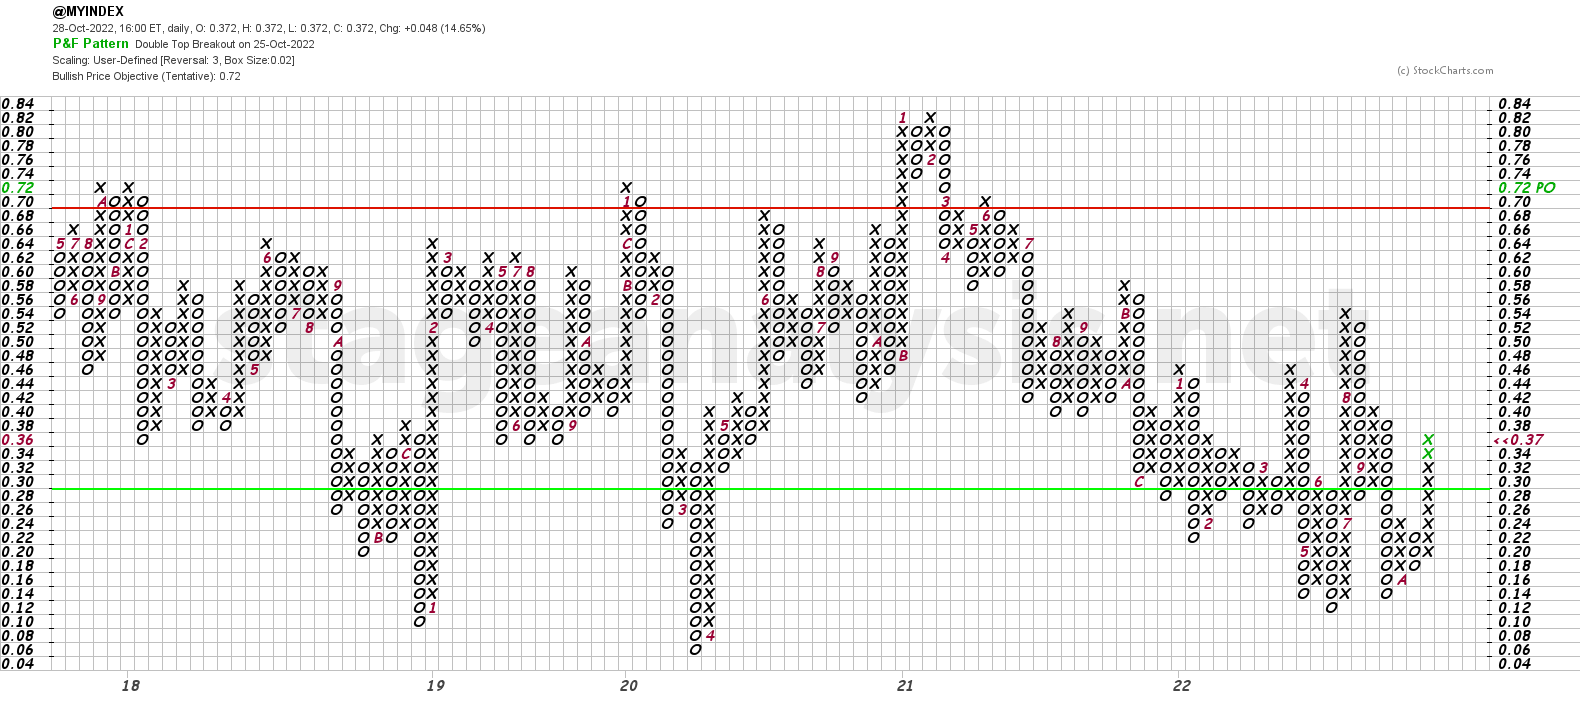
The Point and Figure chart (shown below) continued higher by a further 6 boxes in the column of Xs, and overcame the 26% level that I mentioned last week, that was needed for a double top breakout, and so the P&F status has changed to Bull Confirmed status, after a deep stay in the lower zone. So it is considered a stronger P&F signal than if it occurs from a higher level on the chart. But as we saw with July's similar signal. It can still fail. So risk management as always is key.
Become a Stage Analysis Member:
To see more like this – US Stocks watchlist posts, detailed videos each weekend, use our unique Stage Analysis tools, such as the US Stocks & ETFs Screener, Charts, Market Breadth, Group Relative Strength and more...
Join Today
Disclaimer: For educational purpose only. Not investment advice. Seek professional advice from a financial advisor before making any investing decisions.