
Market Breadth: Percentage of Stocks Above their 50 Day, 150 Day & 200 Day Moving Averages Combined
The full post is available to view by members only. For immediate access:
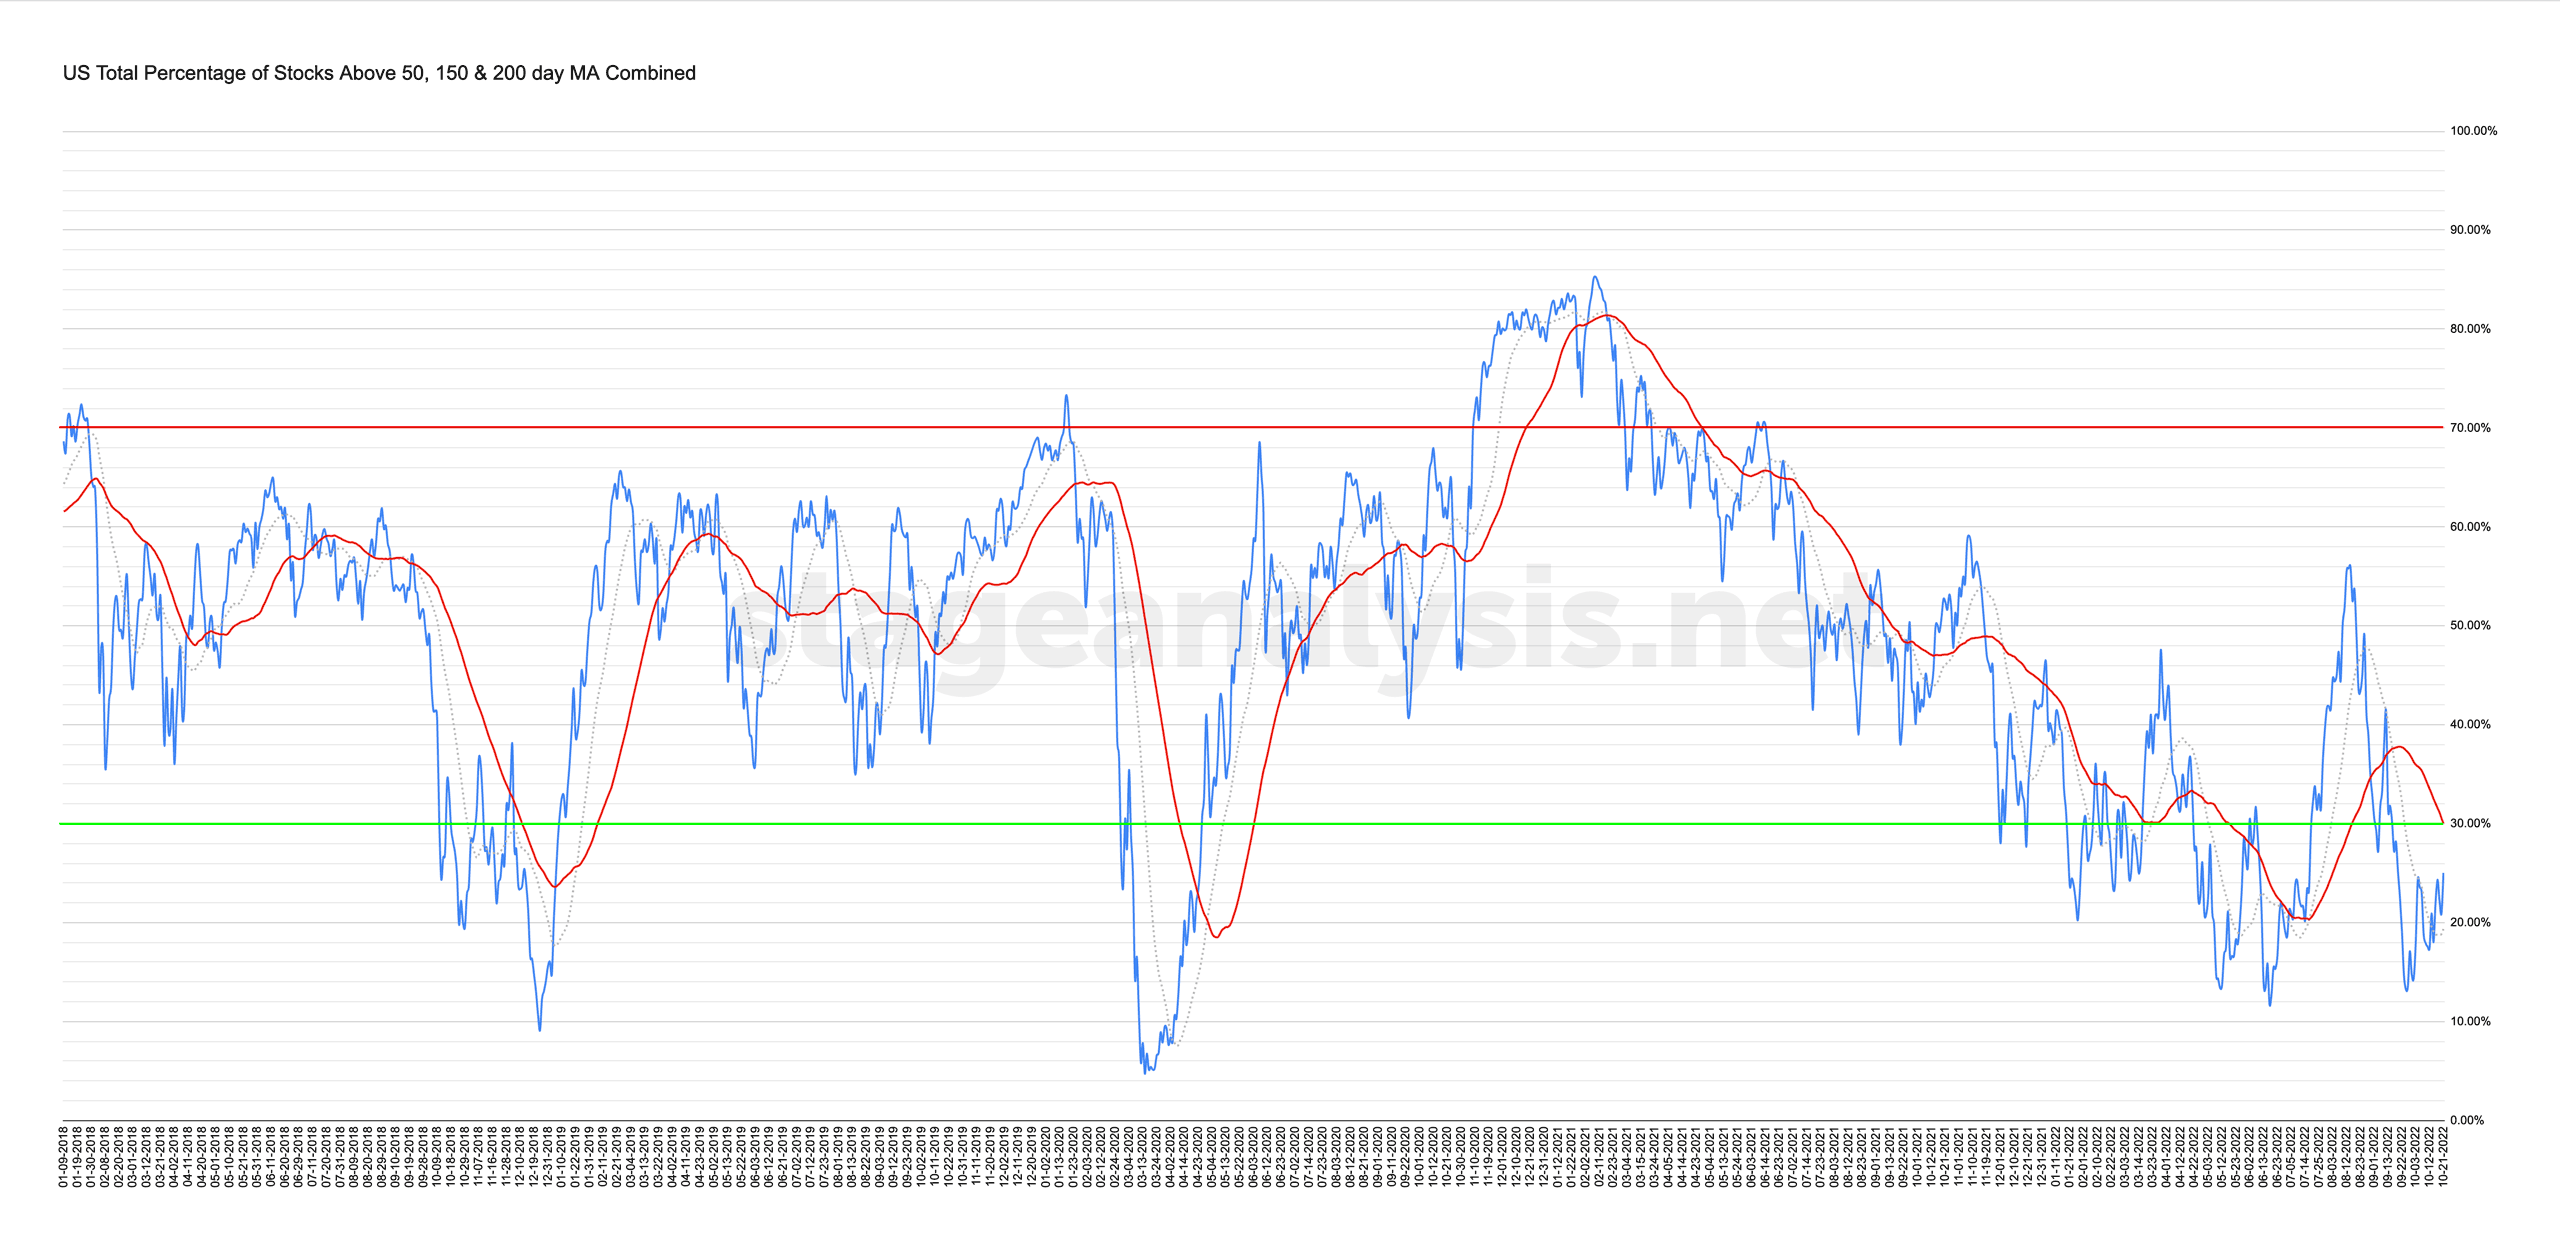
25.03% (+7.01% 1wk)
Status: Neutral / Difficult Environment in the Stage 4 zone
The US Total Percentage of Stocks above their 50 Day, 150 Day & 200 Day Moving Averages (shown above) ended the week higher by +7.01% overall, with the NYSE seeing the bulk of the gains at +9.54% versus the Nasdaq which only gained +4.48%. The line chart is testing the recent pivot highs in the lower zone and moved above its own 20 day MA earlier in the week and is now 5% below its 50 day MA, which is used as the signal line, and needs to be overcome in order for the status to change to a positive environment.
So with the combined line between the 20 day MA and 50 day MA, the status has changed to a Neutral / Difficult Environment in the Stage 4 zone.
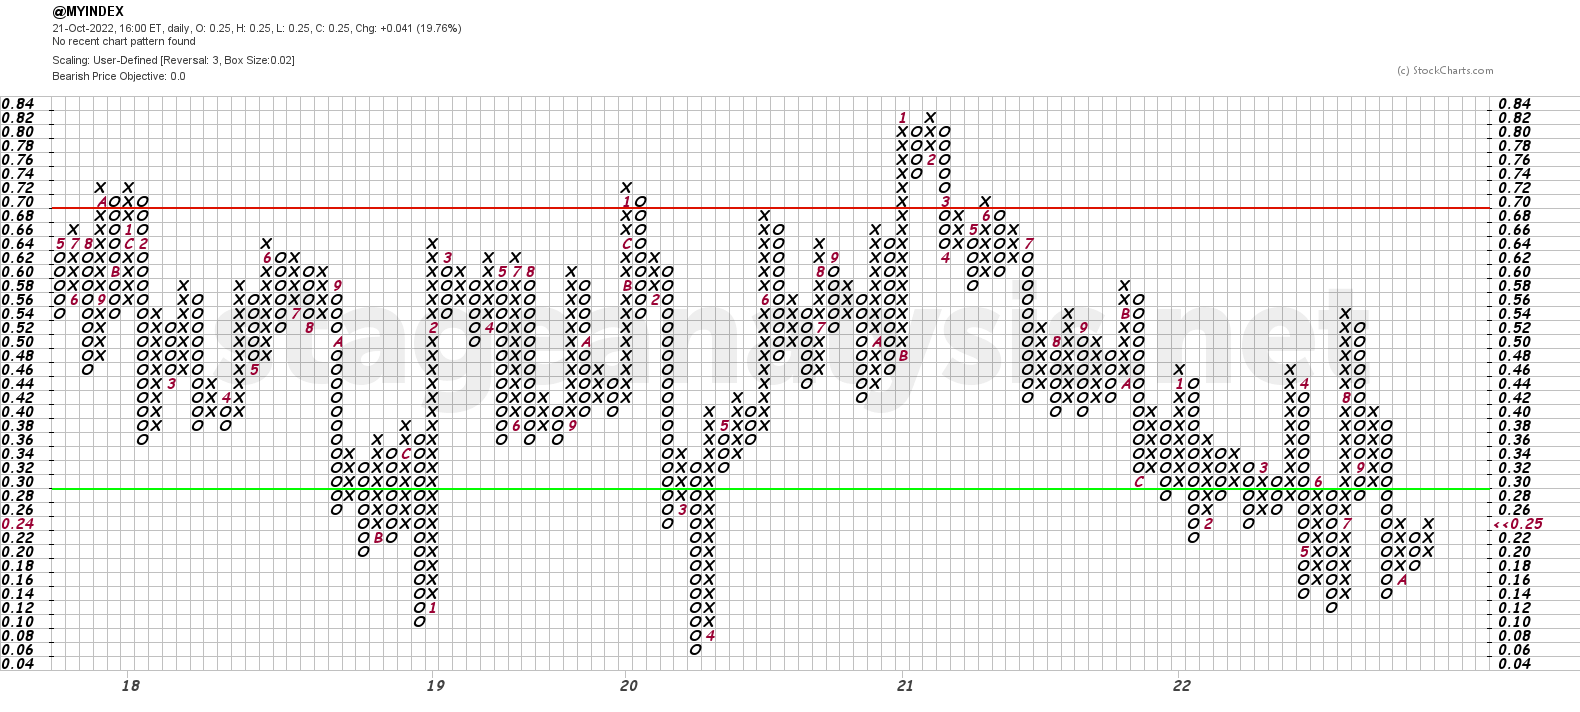
The Point and Figure chart (shown below) reversed higher by 3 boxes into a column of Xs, but needs to overcome the 26% level in order to change status to Bull Confirmed. So with the reversal to a column of Xs in the lower zone the status shifts to Bull Alert status.
Become a Stage Analysis Member:
To see more like this – US Stocks watchlist posts, detailed videos each weekend, use our unique Stage Analysis tools, such as the US Stocks & ETFs Screener, Charts, Market Breadth, Group Relative Strength and more...
Join Today
Disclaimer: For educational purpose only. Not investment advice. Seek professional advice from a financial advisor before making any investing decisions.