
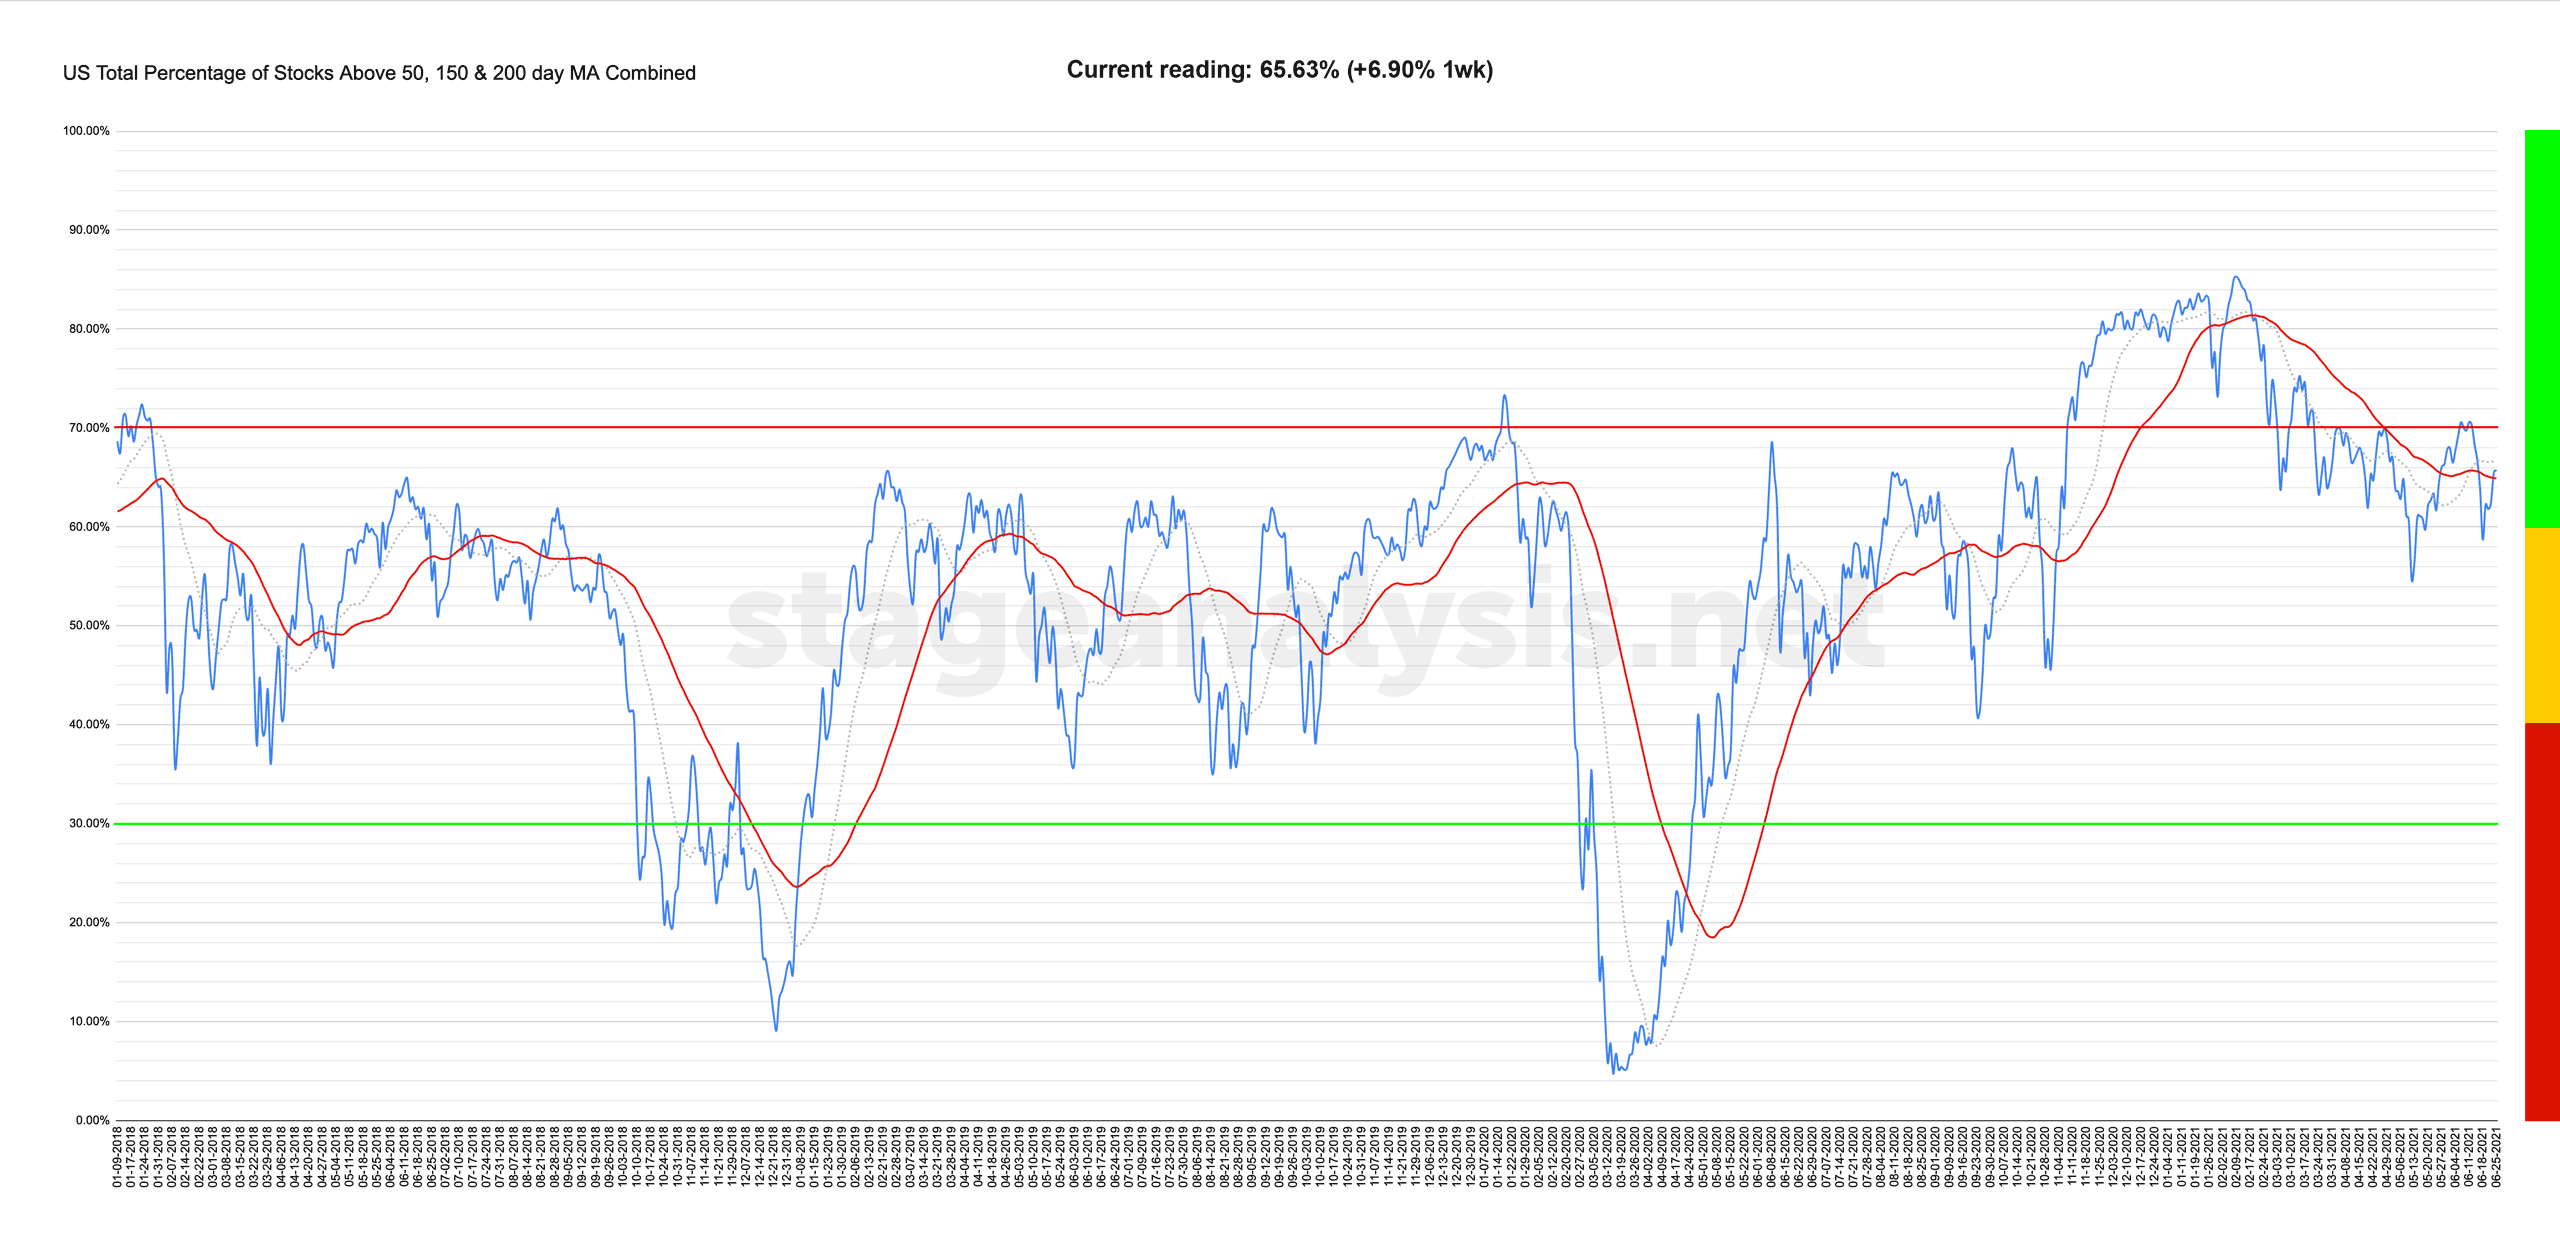
US Total Percentage of Stocks Above their 50 Day, 150 Day and 200 Day Moving Averages Combined
US Total Percent Stocks Above their 50 Day, 150 Day and 200 Day Moving Averages = 65.63% (+6.90% 1wk)
Closed back above the 50 day MA
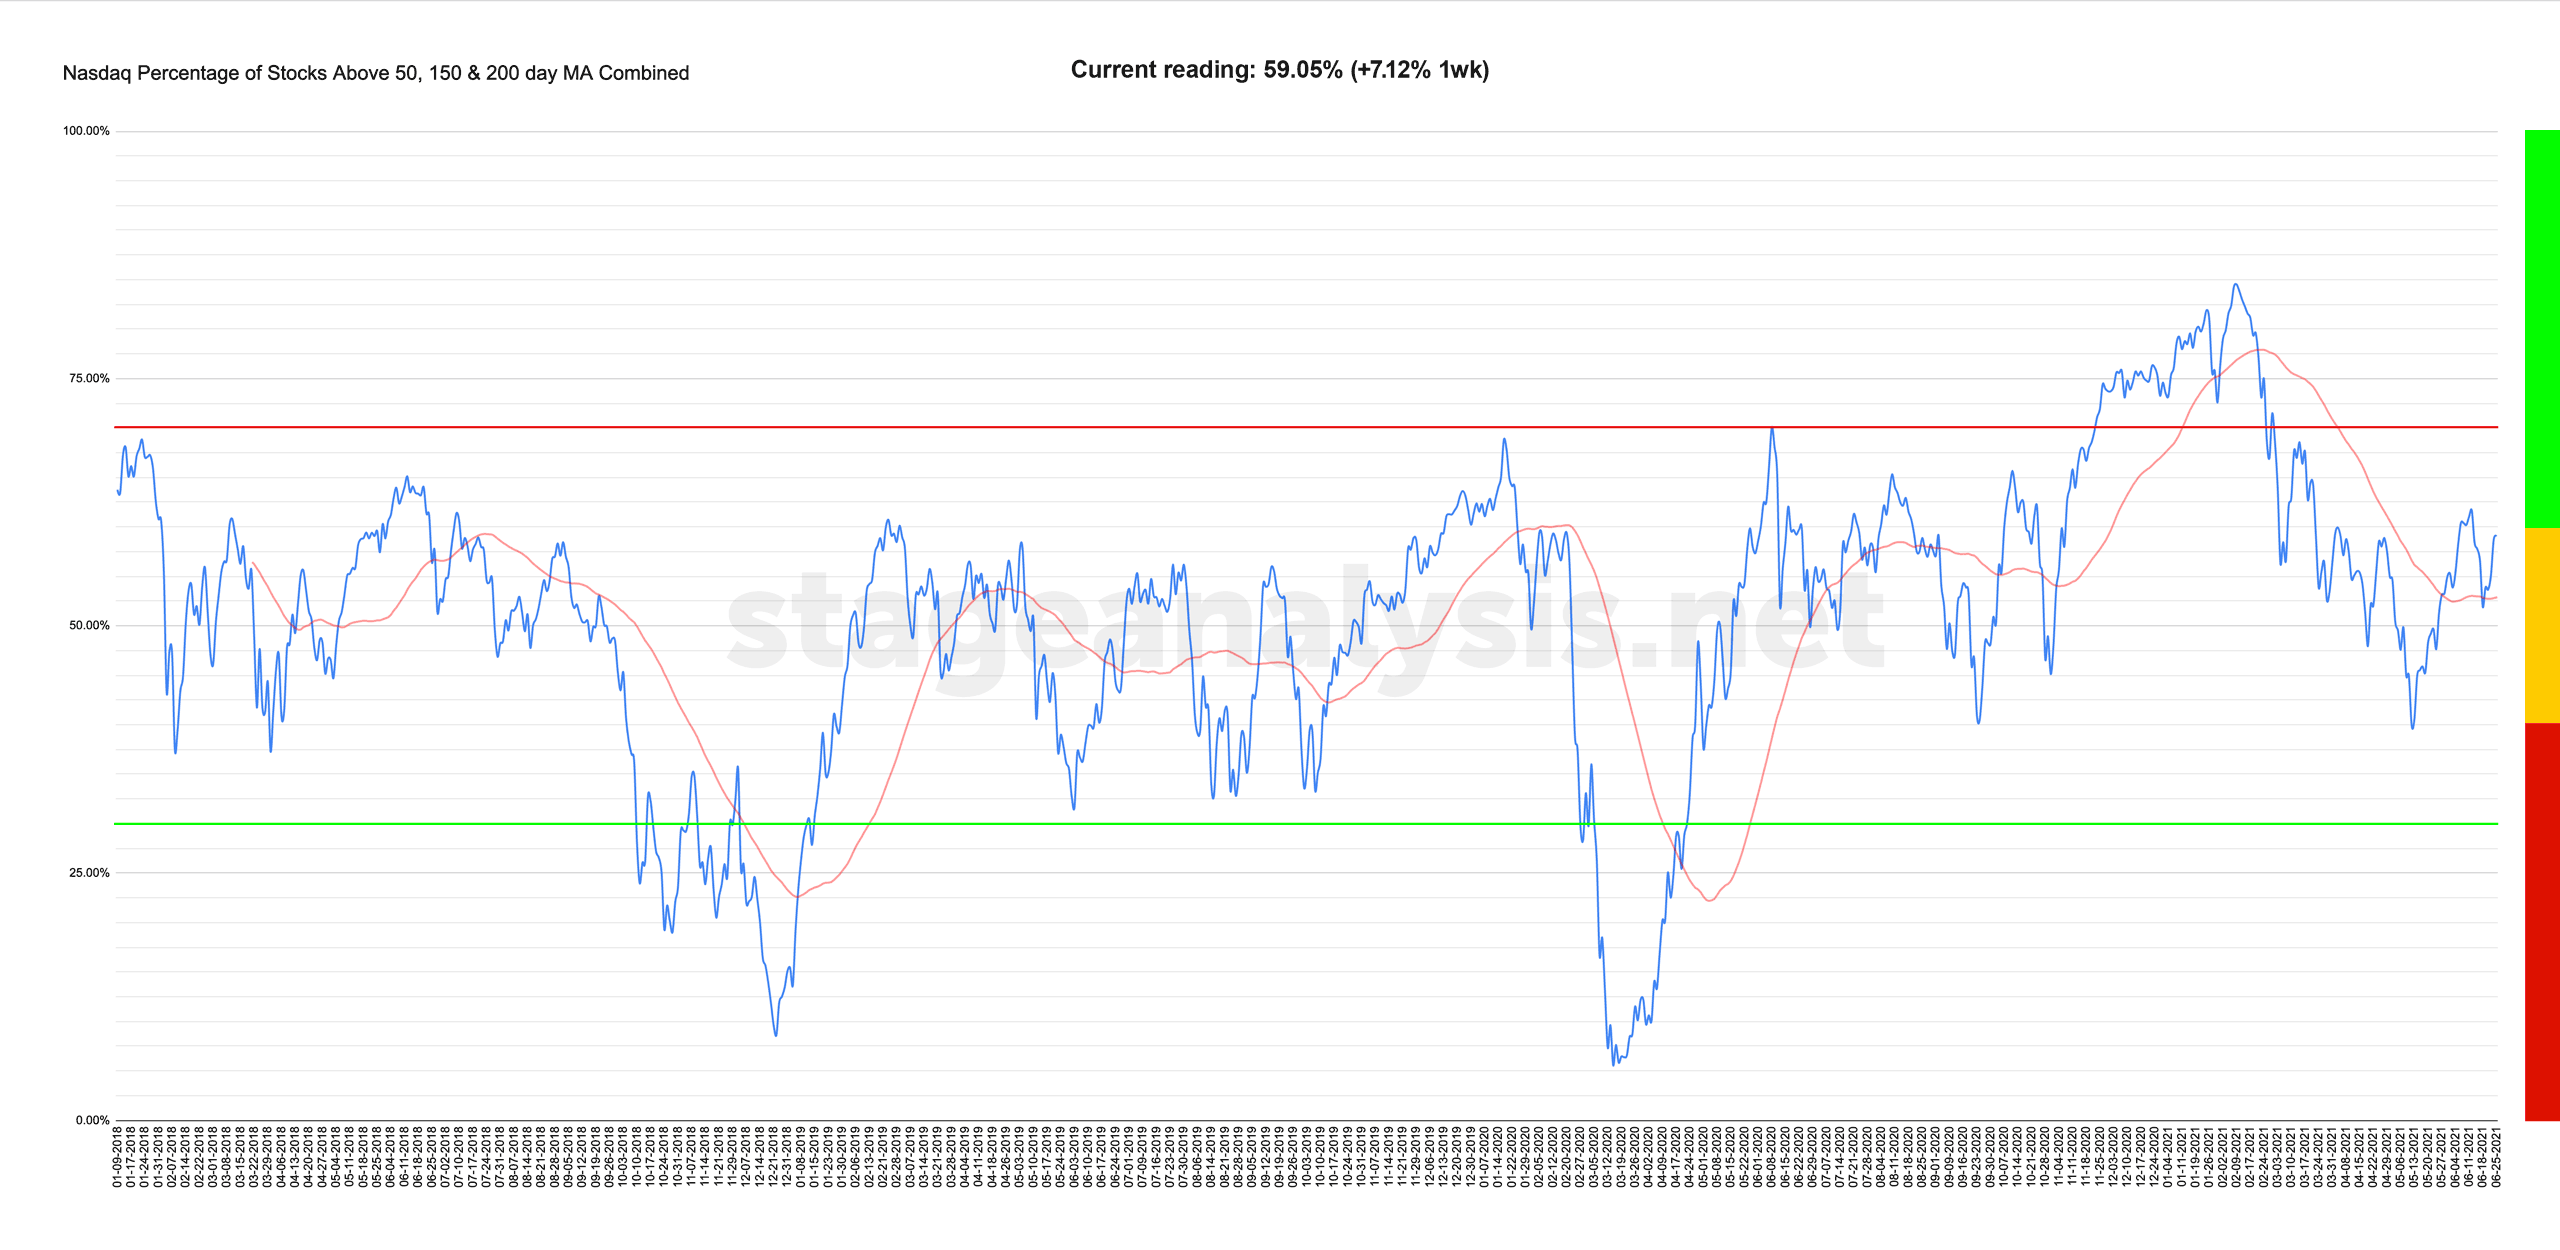
Nasdaq % Stocks Above their 50 Day, 150 Day & 200 Day Moving Averages = 59.05% (+7.12% 1wk)
Rebounded at the 50 day MA earlier in the week and closed the week strongly above.
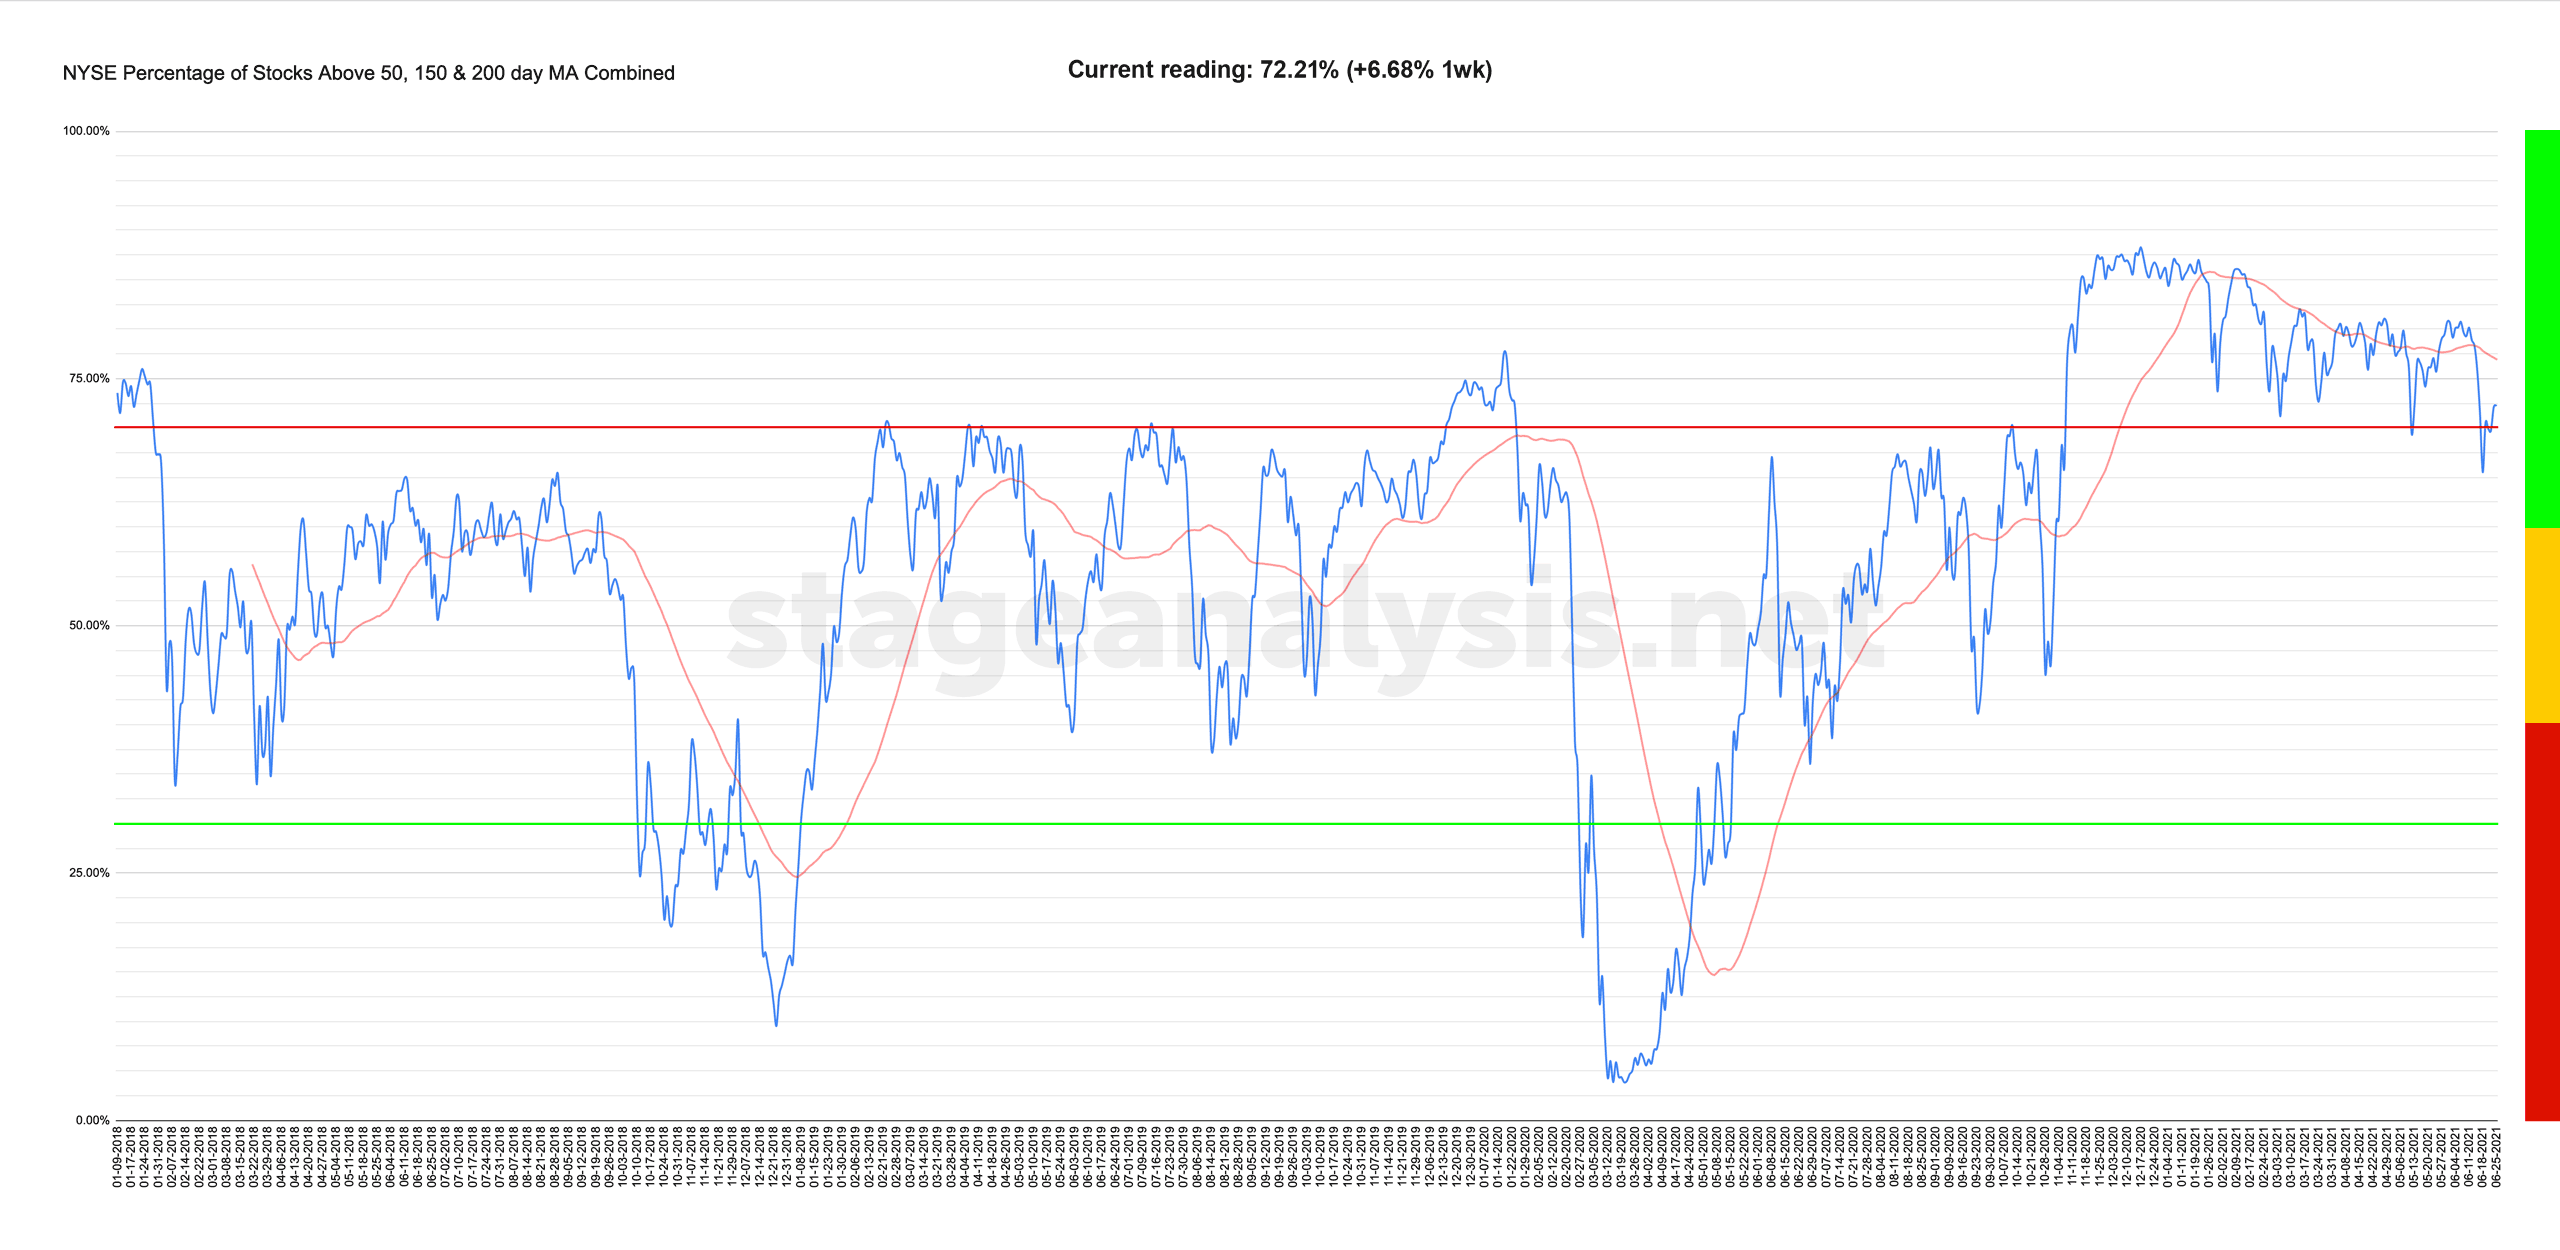
NYSE % Stocks Above their 50 Day, 150 Day and 200 Day Moving Averages = 72.21% (+6.68% 1wk)
Closed up for the week, but below the 50 day MA
#stocks #trading #investing #money
Disclaimer: For educational purpose only. Not investment advice. Seek professional advice from a financial advisor before making any investing decisions.