
Market Breadth: Percentage of Stocks Above their 50 Day, 150 Day & 200 Day Moving Averages Combined
The full post is available to view by members only. For immediate access:
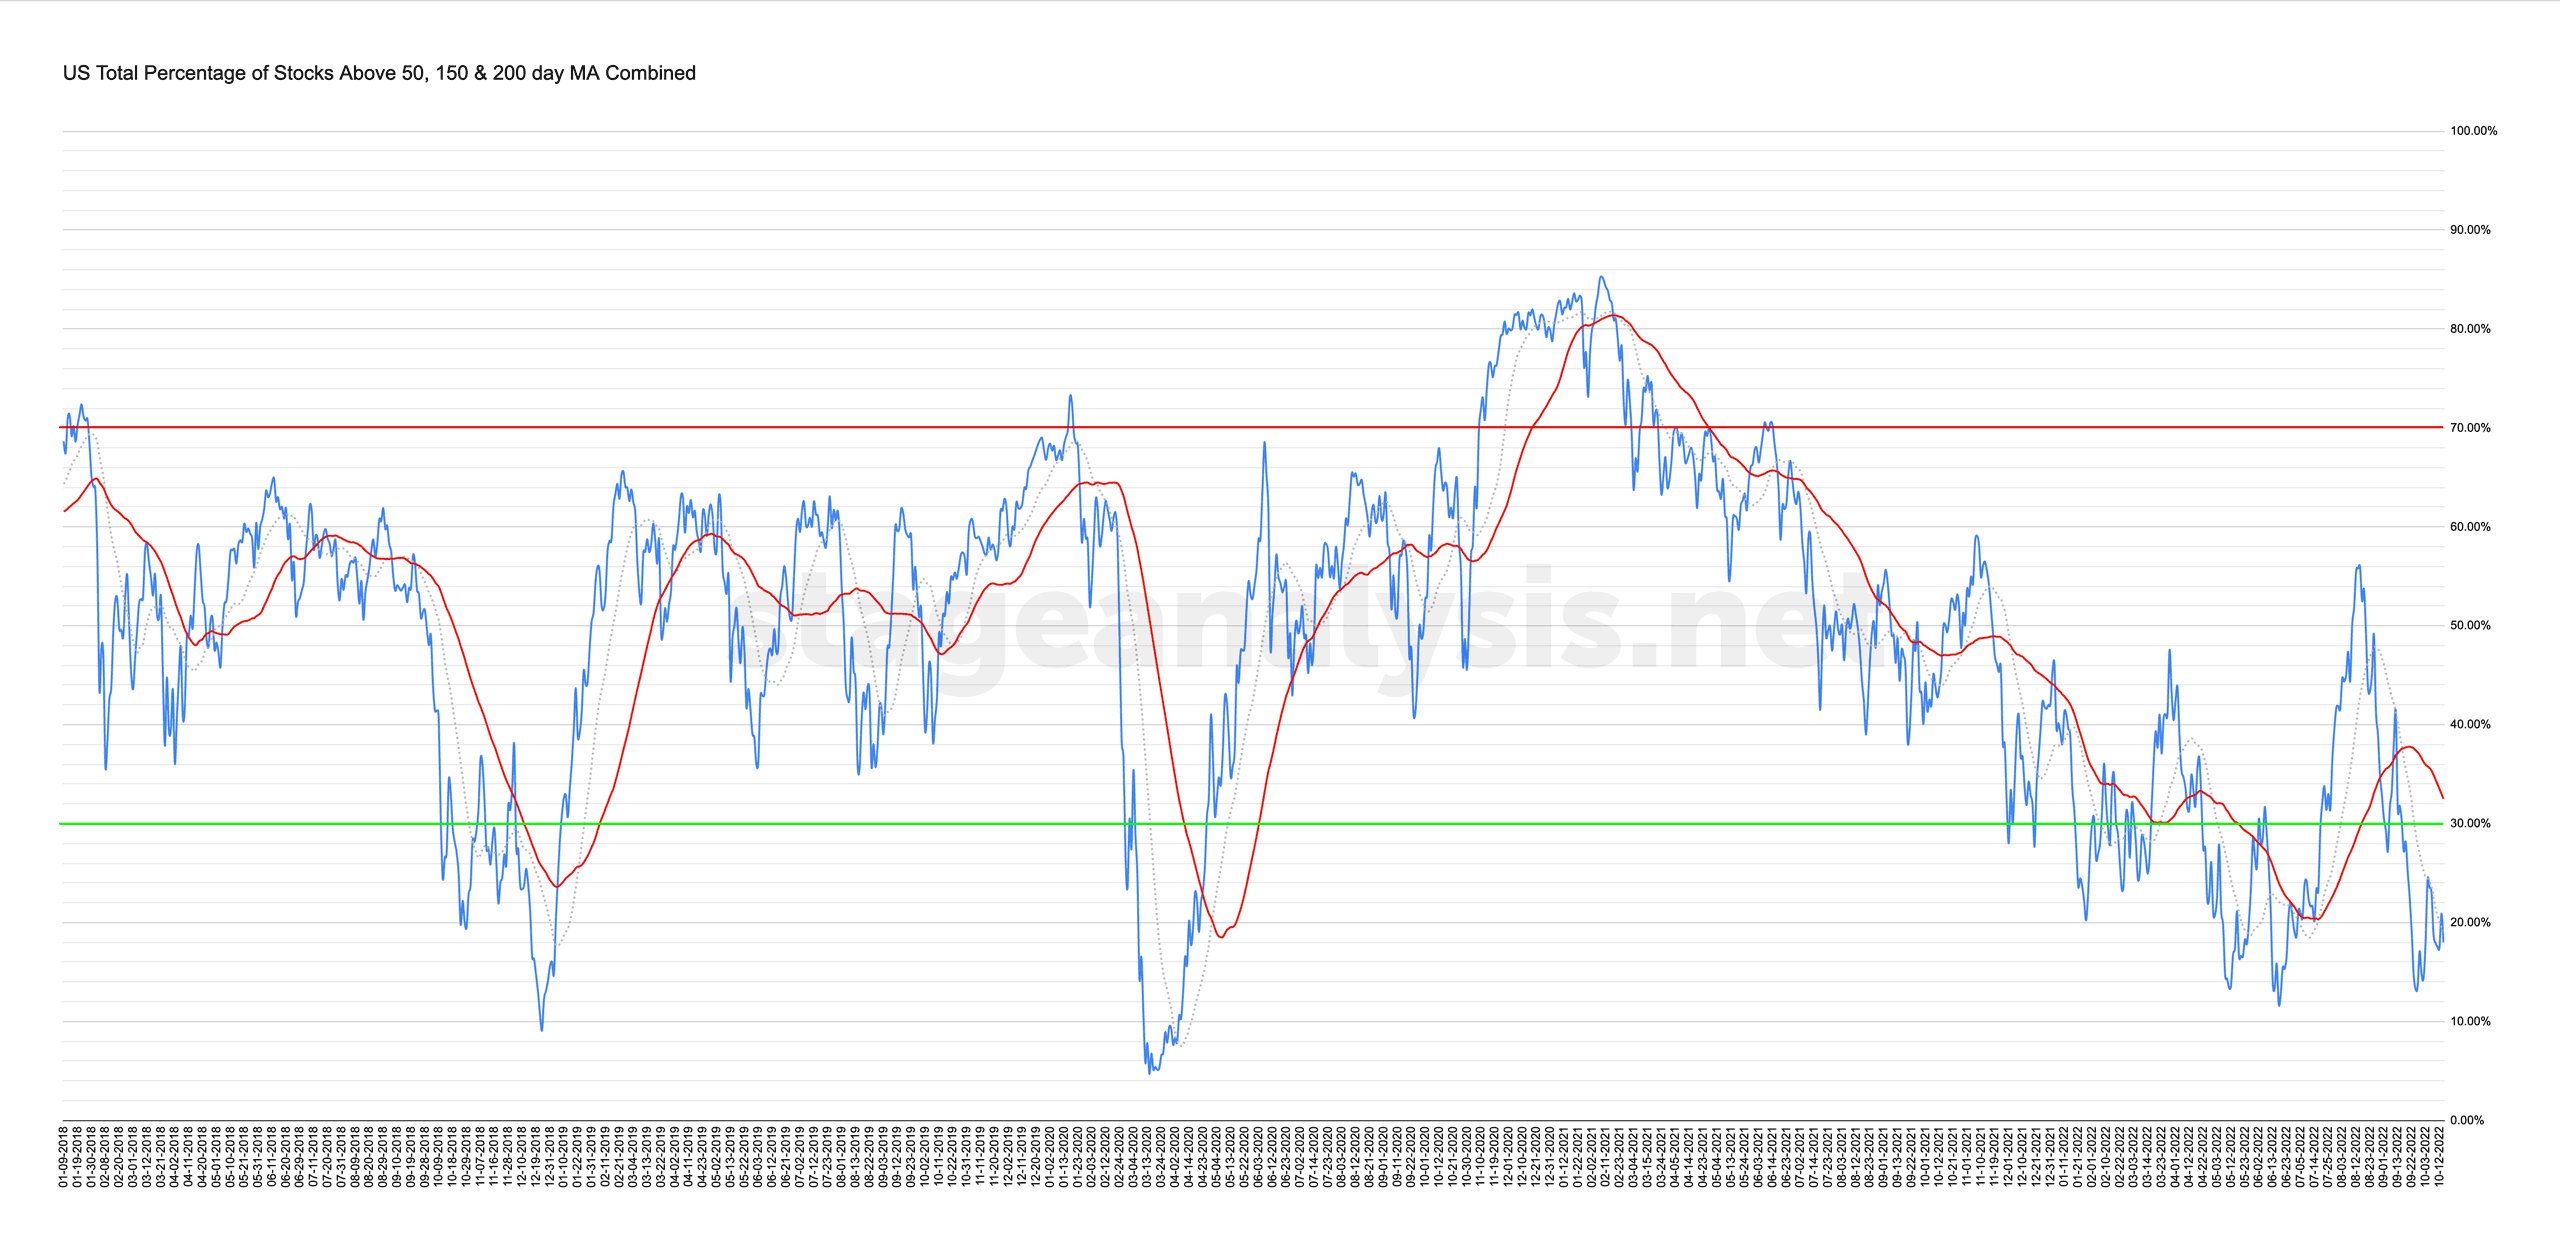
18.02% (-0.80% 1wk)
Status: Difficult Environment in the Stage 4 zone
The US Total Percentage of Stocks above their 50 Day, 150 Day & 200 Day Moving Averages (shown above) ended the week slightly lower by -0.80% at 18.02%, and briefly closed above its own short-term 20 day MA on Thursday. But fell away from it on Friday once more, and so the current status remains as a Difficult Environment in the Stage 4 zone with a +14.49% swing needed to get back to its current 50 day MA position and move the status towards a positive environment.
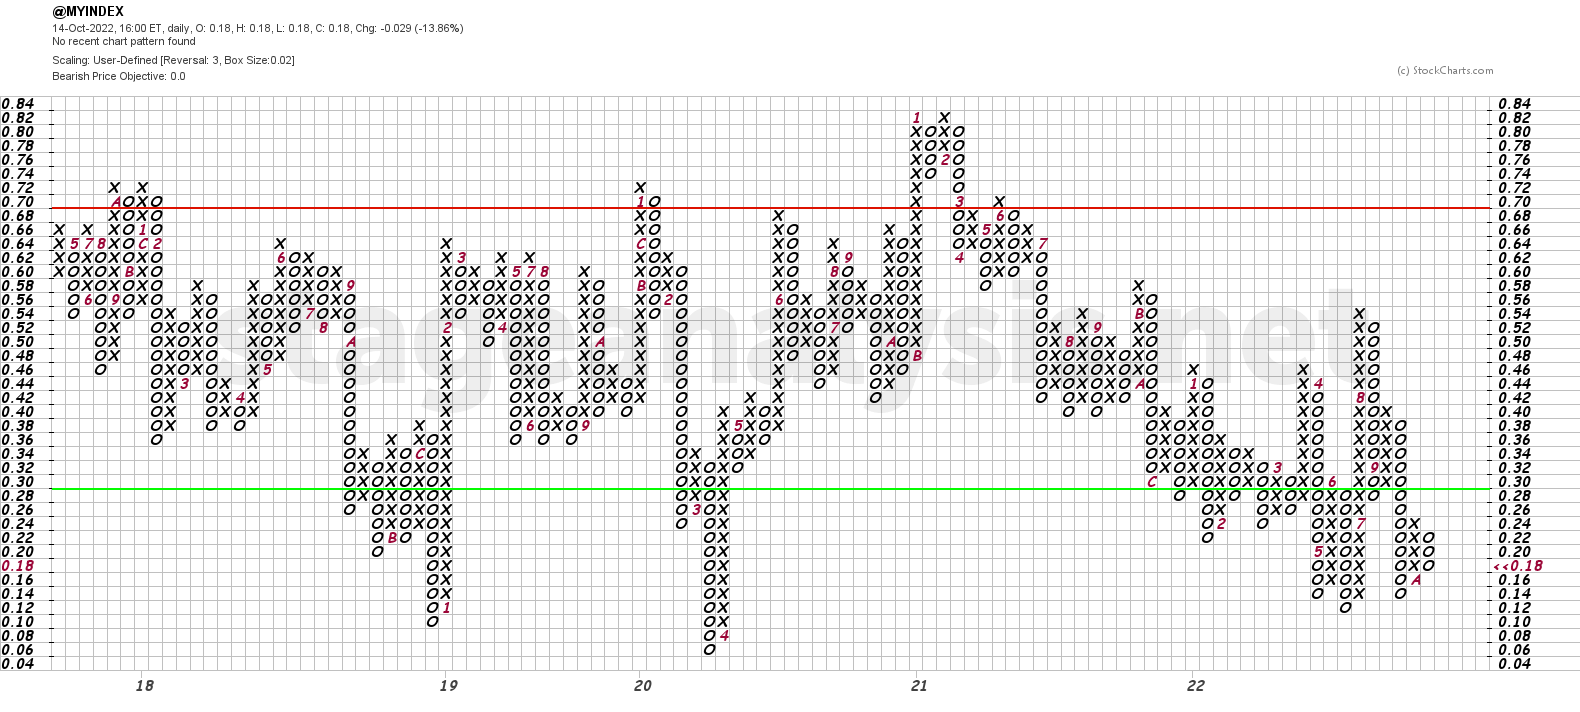
The Point and Figure chart reversed back to a column of Os again on Monday, changing its P&F status to Bear Confirmed status and put it back on Defensive posture (as it is in a column of Os). However with the latest reversal to a column of Os, it has formed a lower swing high level for a potential future bullish status change, as a move above the 26% level would now change the status to Bull Confirmed. Which would be a strong position for the signal to occur (only if it does), moving up from the lower zone.
Become a Stage Analysis Member:
To see more like this – US Stocks watchlist posts, detailed videos each weekend, use our unique Stage Analysis tools, such as the US Stocks & ETFs Screener, Charts, Market Breadth, Group Relative Strength and more...
Join Today
Disclaimer: For educational purpose only. Not investment advice. Seek professional advice from a financial advisor before making any investing decisions.