
Sector Breadth: Percentage of US Stocks Above Their 150 day (30 Week) Moving Averages
The full post is available to view by members only. For immediate access:
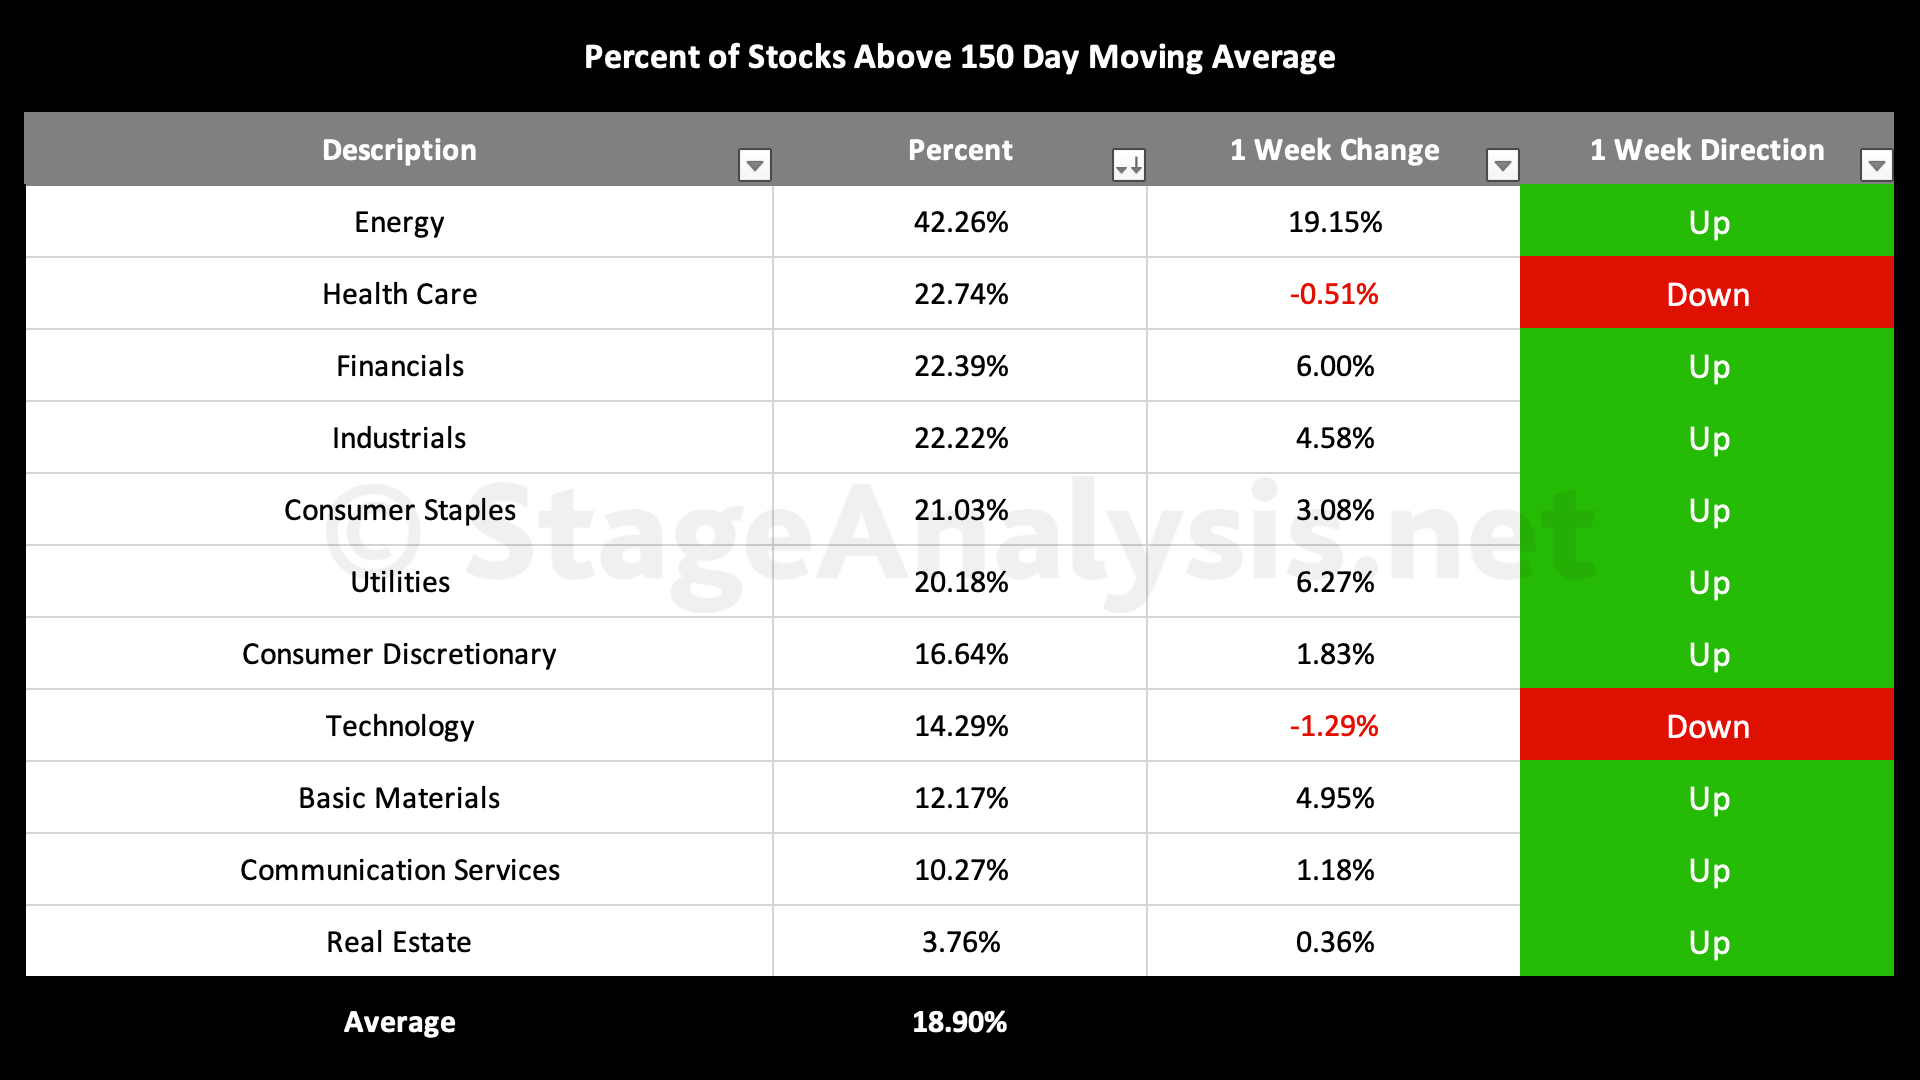
Average: 18.90% (-10.27% 3wks)
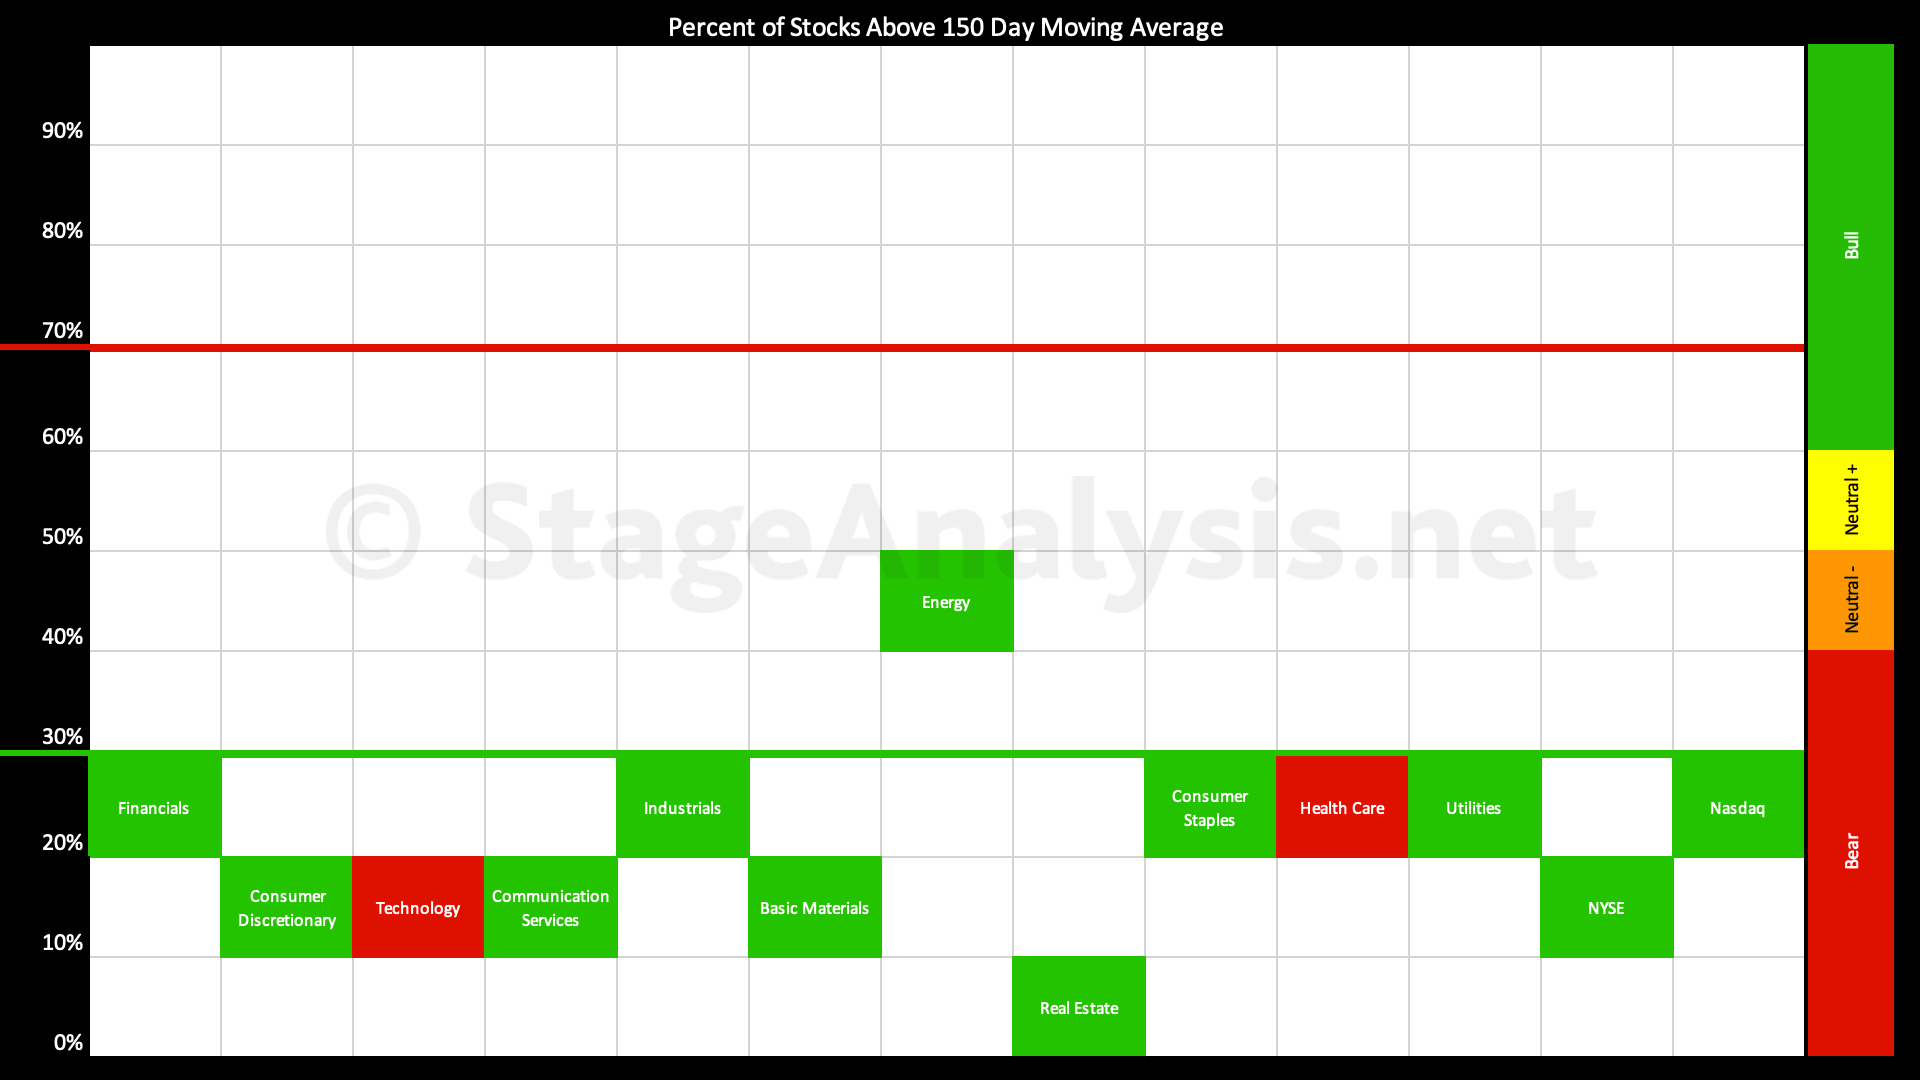
- 0 sectors in the Stage 2 zone
- 1 sector is in Stage 1 / 3 zone (Energy)
- 10 sectors are in Stage 4 zone (Health Care, Financials, Industrials, Consumer Staples, Utilities, Consumer Discretionary, Technology, Communication Services, Real Estate)
The Percentage of US Stocks Above Their 150 day Moving Averages in the 11 major sectors has declined by a further -10.27% over the last three weeks since the last sector breadth post, and is currently at 18.90%, which is one of the lowest readings of the year to date, but as you can see from the green on a lot of the sectors in the visual above, the previous week (30th September) hit a new low of 14.76% for the sector breadth this year, when all of the sectors were in the lower Stage 4 zone (below the 40% level). However, there have been some small rebounds since the start of the month across the majority of sectors, but the major mover was Energy, which gained 19.15% over the last week to take it a back into the middle of the range in the more neutral Stage 1 / Stage 3 zone.
Therefore currently there are 10 sectors in Stage 4 and only 1 sector in Stage 1 or Stage 3. With zero sectors in Stage 2 once more, as the 2022 Stage 4 bear market continues.
On the more positive side, the sector breadth is a contrarian measure. So the fact that it's at a fairly extreme reading in the lower zone means it's time to start paying attention again, as once multiple sectors start moving back through the key 30% level once more, then there could be some very good opportunities for Stage 2 breakouts. But don't jump the gun, as oversold levels can get more oversold. So wait for positive signs, and in the mean time buckle up and proceed with extreme caution.
The table of the sectors is shown below, and is in order of relative strength.
Sector Breadth Charts – Percentage of US Stocks Above Their 150 day (30 Week) Moving Averages
Below is the charts for the 11 sectors that shows back to late 2018*. Which gives a very clear picture of the overall health of each sector and the market as a whole.
*I've updated more of the charts data gaps now, but there are still a few to do.
Become a Stage Analysis Member:
To see more like this – US Stocks watchlist posts, detailed videos each weekend, use our unique Stage Analysis tools, such as the US Stocks & ETFs Screener, Charts, Market Breadth, Group Relative Strength and more...
Join Today
Disclaimer: For educational purpose only. Not investment advice. Seek professional advice from a financial advisor before making any investing decisions.