
Market Breadth: Percentage of Stocks Above their 50 Day, 150 Day & 200 Day Moving Averages Combined
The full post is available to view by members only. For immediate access:
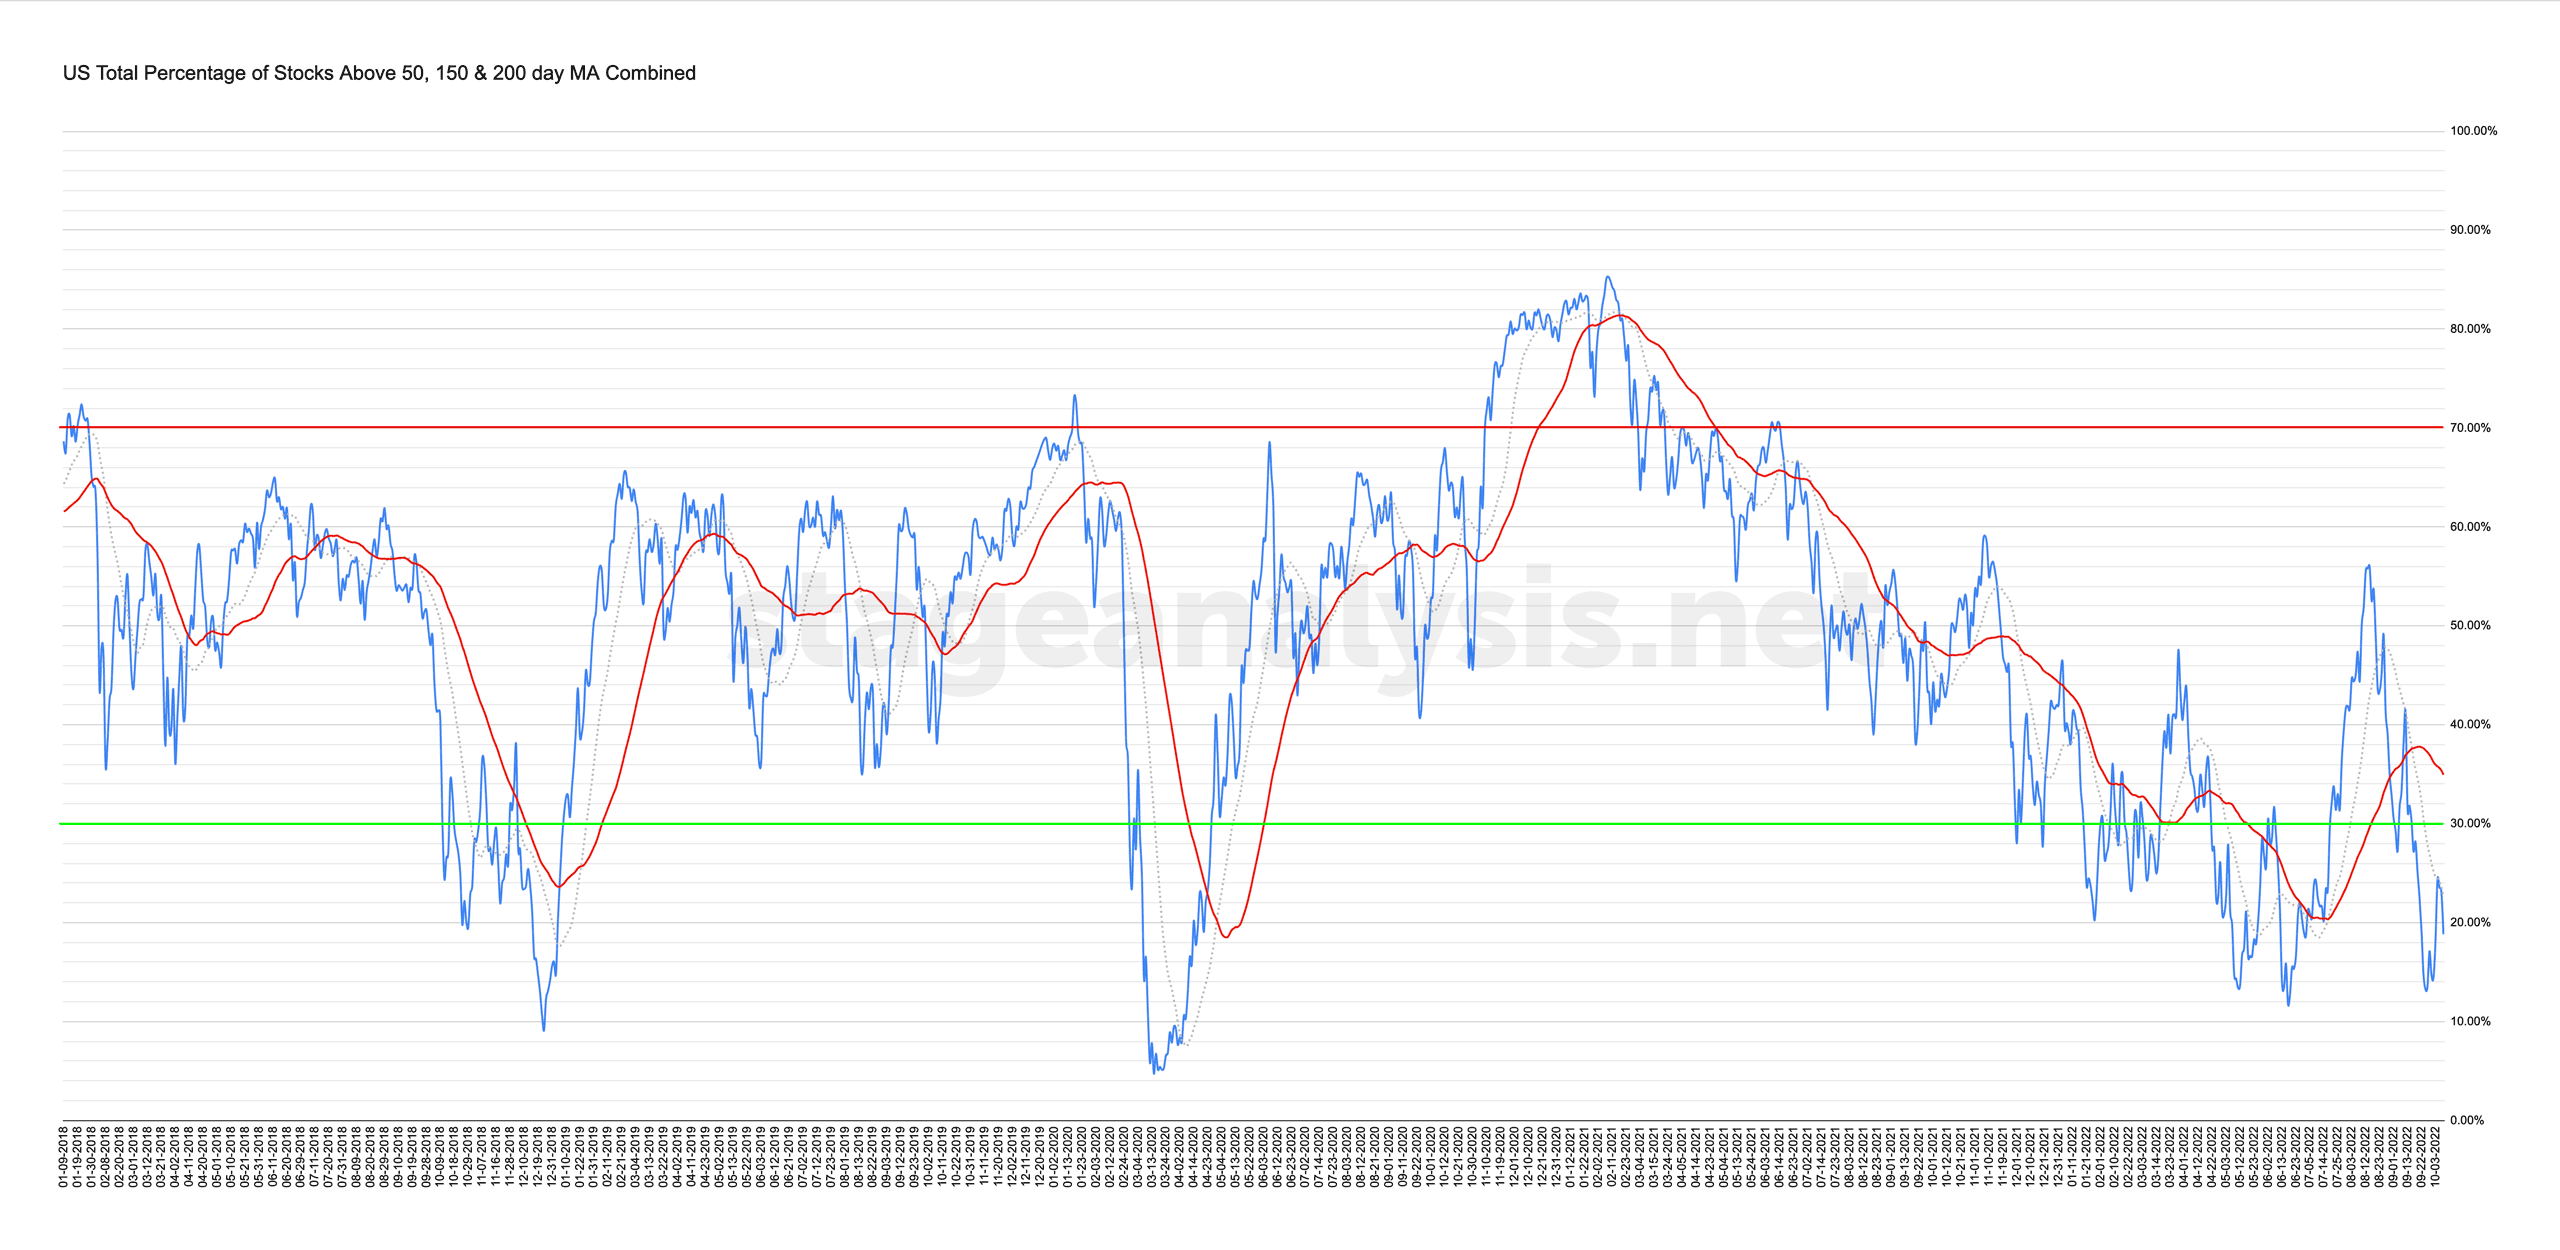
18.82% (+4.41% 1wk)
Status: Difficult Environment in the Stage 4 zone
The US Total Percentage of Stocks above their 50 Day, 150 Day & 200 Day Moving Averages (shown above) rallied strongly early in the week by over 9%, but Fridays heavy price action took it down by around 5%, and so it did still manage to close the week higher by +4.41% at 18.82%. But the level remains firmly in the lower zone and below the 20 day MA and 50 day MA that are used for the statuses on this breadth indicator. Hence the status continues to be a Difficult Environment in the Stage 4 zone.
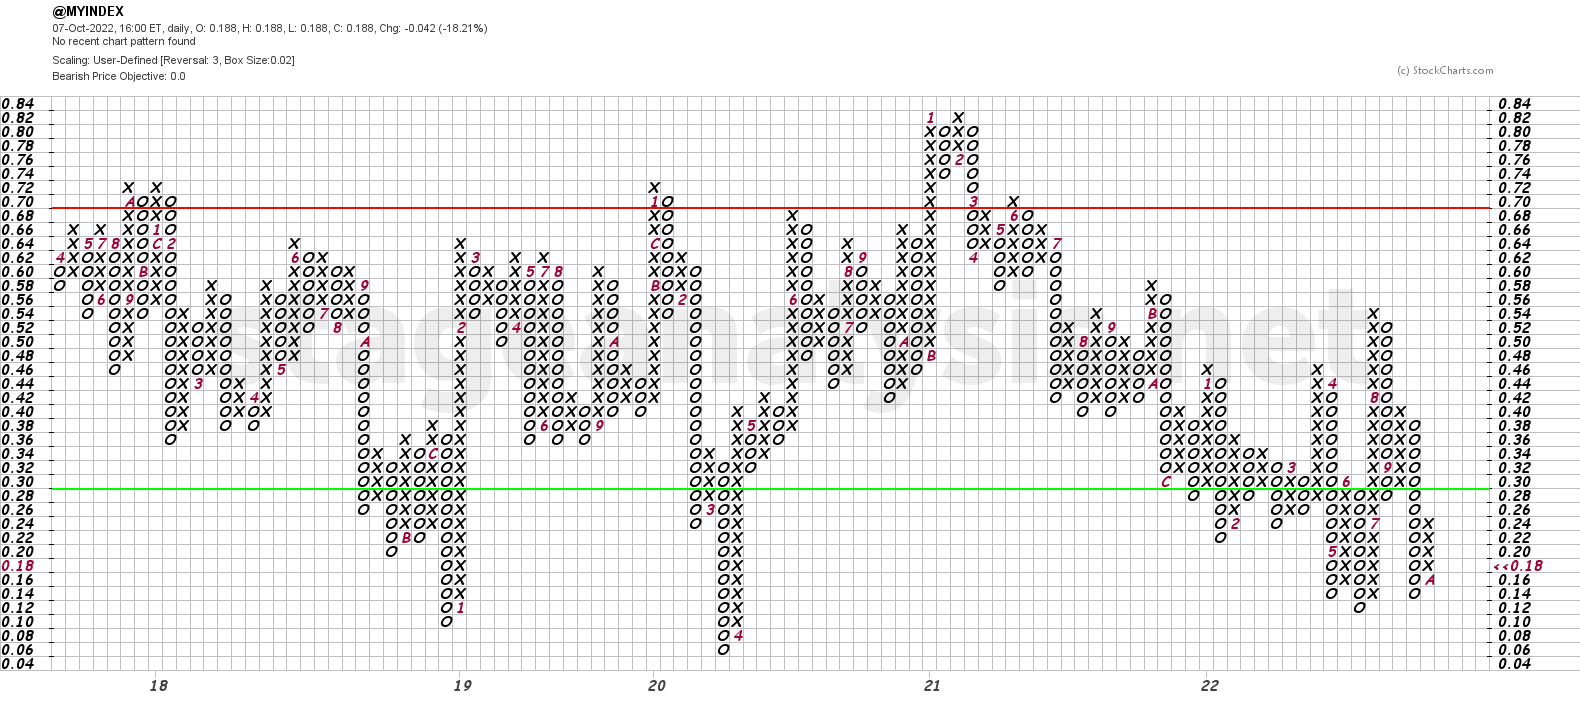
The strong start to the week caused the Point and Figure chart (shown below) to reverse to a column of Xs, and hence changes the P&F status to Bull Alert – which as Tom Dorsey described this week on an IBD interview is referred to as a red light turning to a flashing yellow/orange. So slow down, look both ways and proceed with caution. However, with the strong reversal on Friday it's close to potentially changing back to a column of Os again if the pressure continues. So while technically the column of Xs suggests moving to a cautious offensive posture. Much more caution seems prudent at this juncture as the market tests the recent swing low.
Become a Stage Analysis Member:
To see more like this – US Stocks watchlist posts, detailed videos each weekend, use our unique Stage Analysis tools, such as the US Stocks & ETFs Screener, Charts, Market Breadth, Group Relative Strength and more...
Join Today
Disclaimer: For educational purpose only. Not investment advice. Seek professional advice from a financial advisor before making any investing decisions.