
Market Breadth: Percentage of Stocks Above their 50 Day, 150 Day & 200 Day Moving Averages Combined
The full post is available to view by members only. For immediate access:
14.41% (-0.33% 1wk)
Status: Difficult Environment in the Stage 4 zone
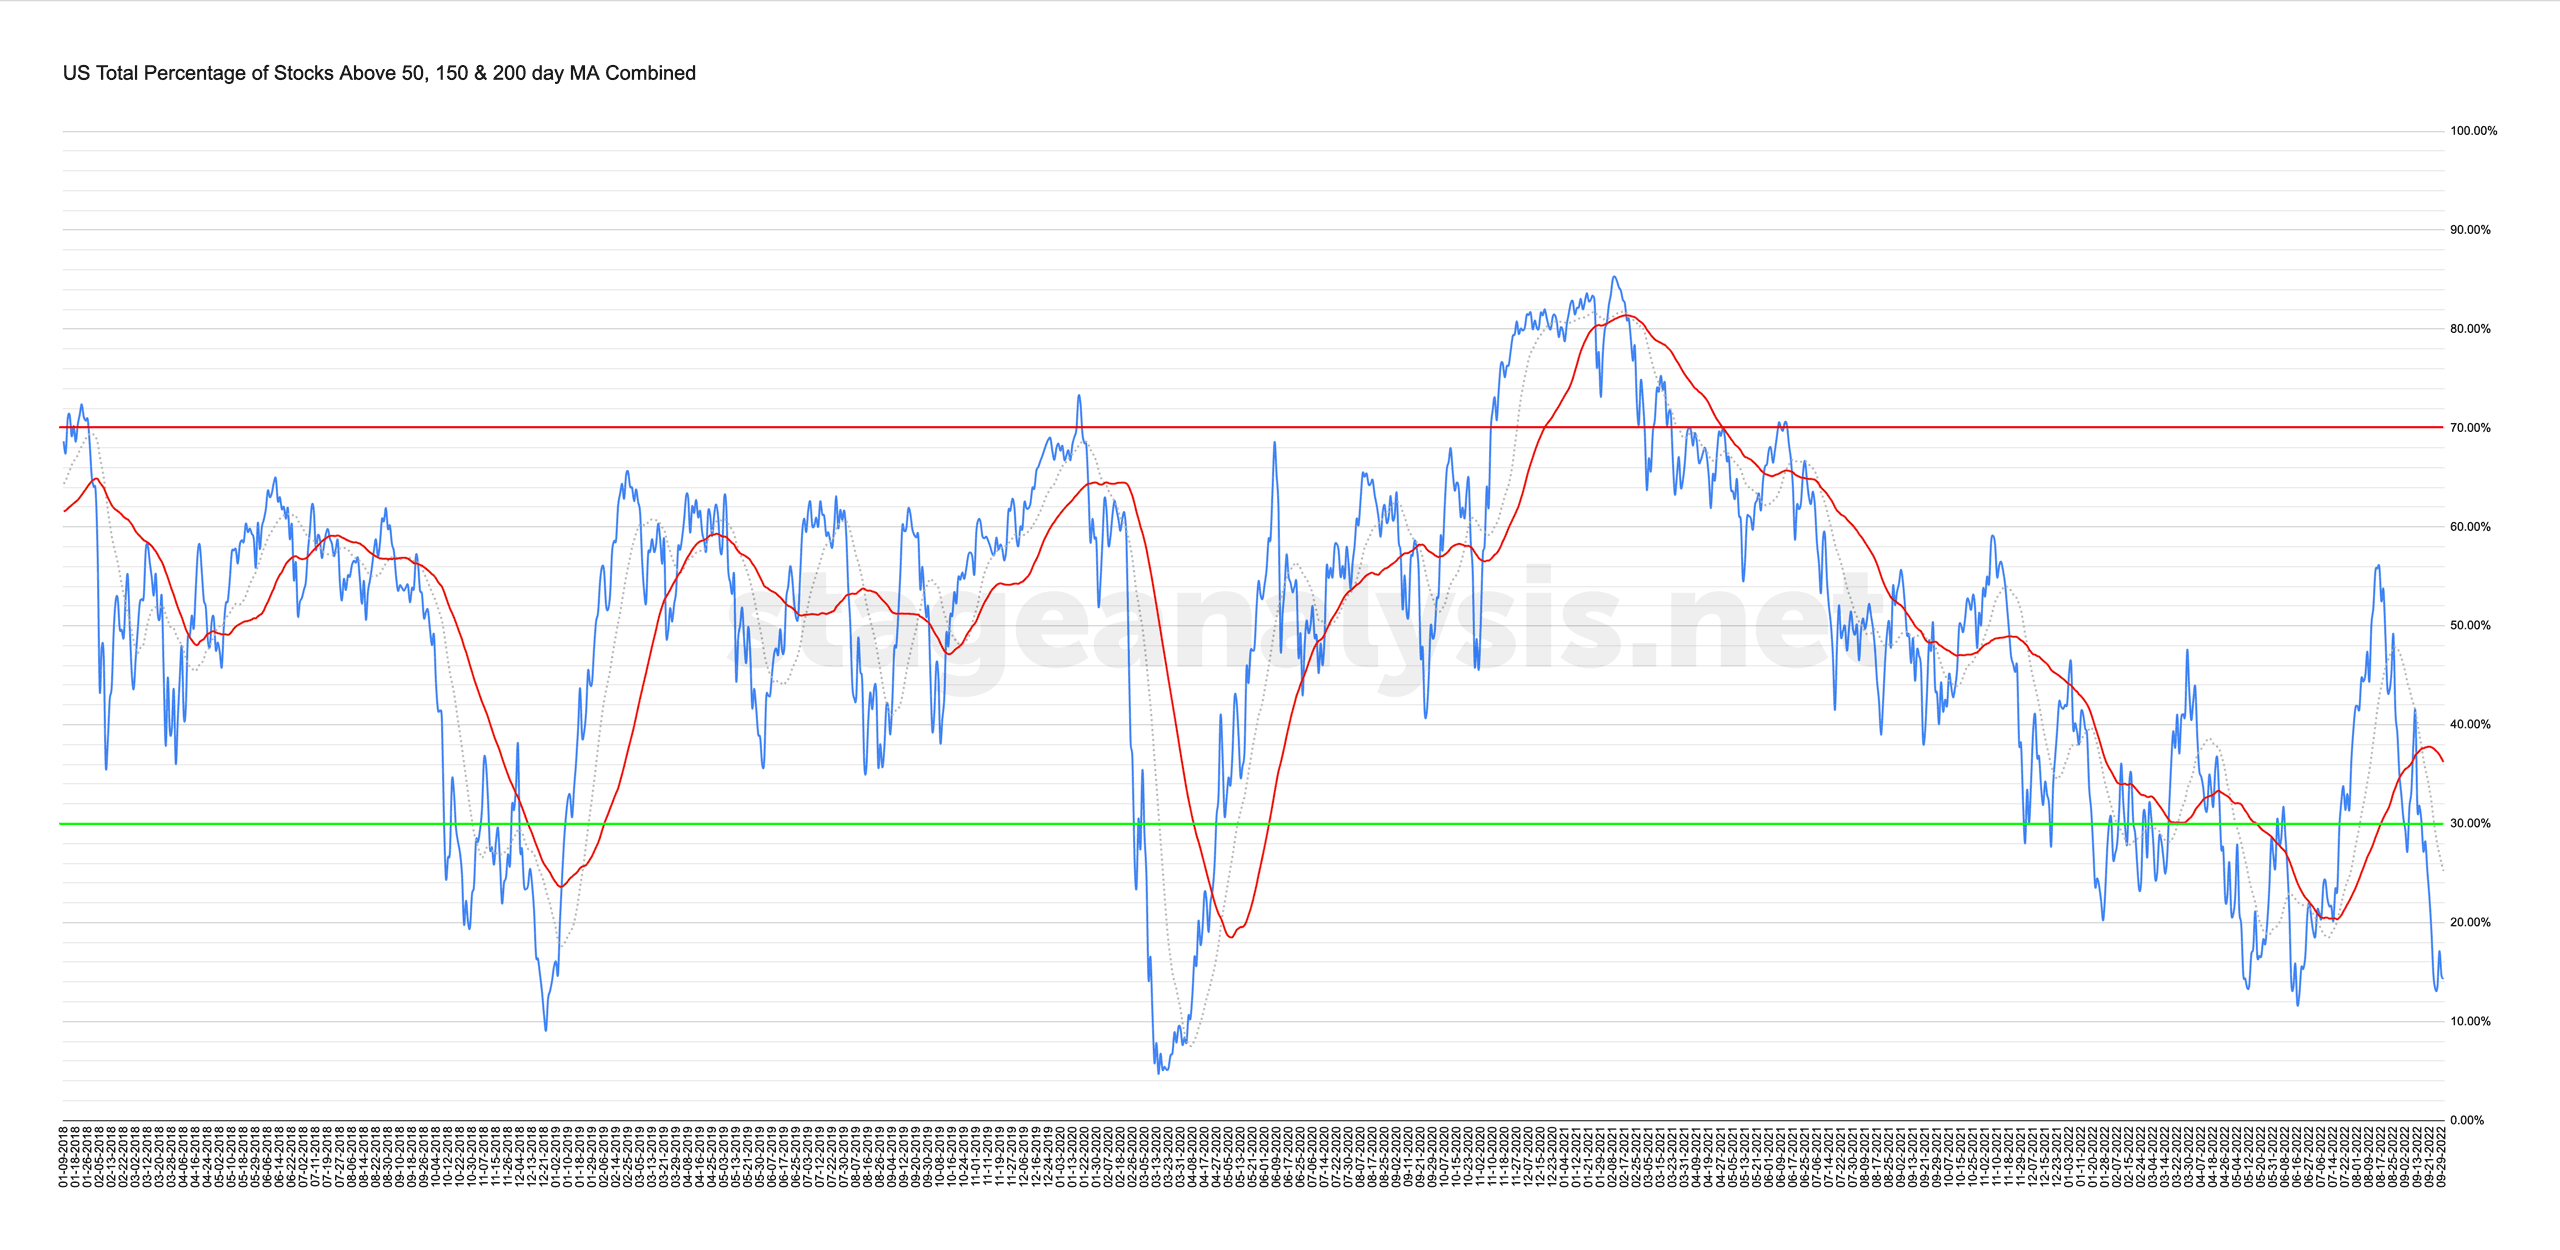
The US Total Percentage of Stocks above their 50 Day, 150 Day & 200 Day Moving Averages (shown above) had a flattish week that was slightly down with the Nasdaq percentage rising slightly and the NYSE percentage falling slightly. Hence the overall average remains in the lower zone at a fairly extreme level with more than 85% of stocks below their short, medium and long term moving averages, which as I mentioned in the previous post is a fairly rare level as the overall average only traded lower than this level for brief periods, except in late 2008, when it held below for multiple months.
So the current status from the line chart continues to be a Difficult Environment in the Stage 4 zone.
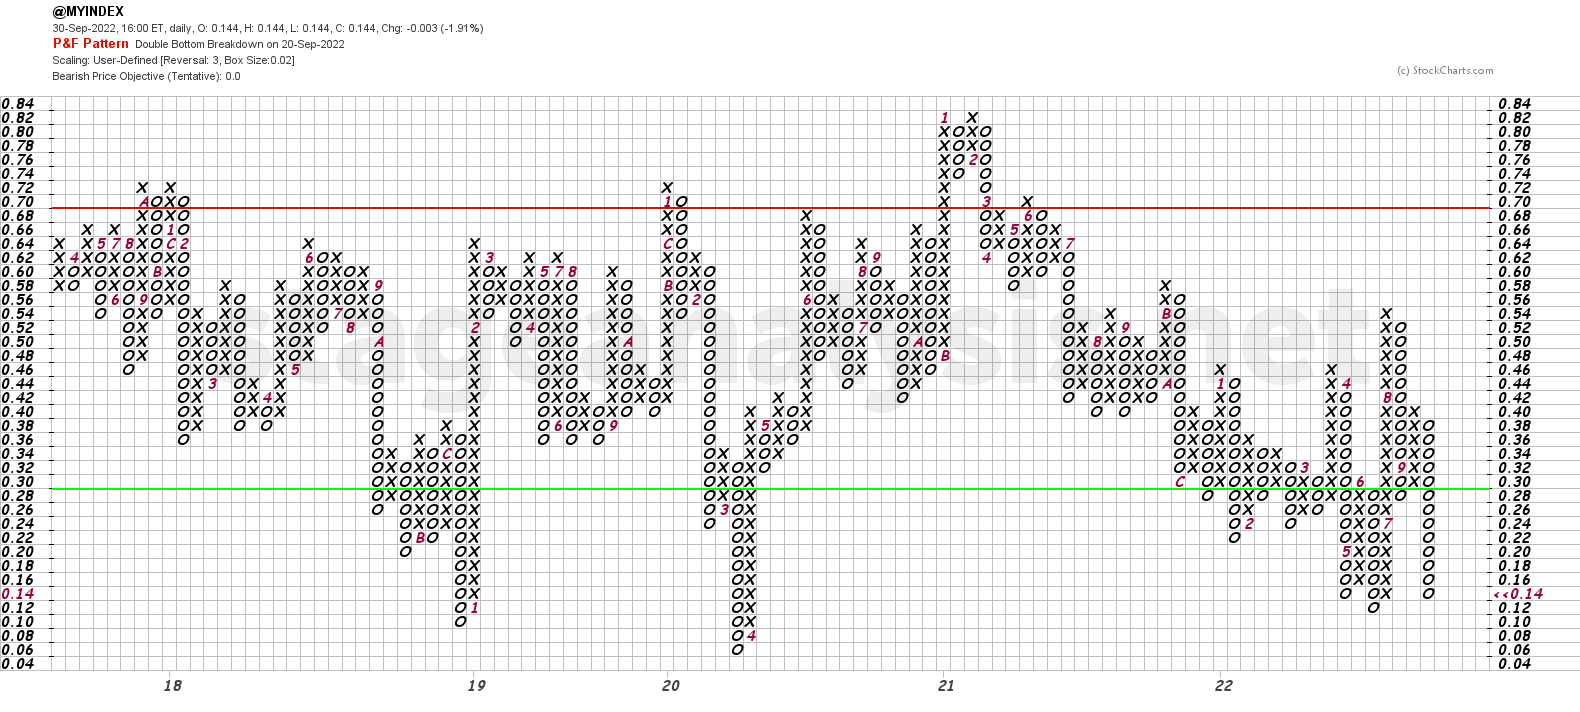
The Point and Figure chart (shown below) declined by a further 1 box, with a P&F status remaining on Bear Confirmed. So the P&F chart remains in a column of Os, which means the strategy continues to be on Defense.
Become a Stage Analysis Member:
To see more like this – US Stocks watchlist posts, detailed videos each weekend, use our unique Stage Analysis tools, such as the US Stocks & ETFs Screener, Charts, Market Breadth, Group Relative Strength and more...
Join Today
Disclaimer: For educational purpose only. Not investment advice. Seek professional advice from a financial advisor before making any investing decisions.